arXiv:1306.6011v1 [astro-ph.SR] 25 Jun 2013
Atmospheric Parameters of 169 F, G, K and M-type Stars
in the
Kepler Field
⋆
J. Molenda- ˙Zakowicz
1, S.G. Sousa
2, A. Frasca
3, K. Uytterhoeven
4,5, M. Briquet
6,7,
H. Van Winckel
7, D. Drobek
1, E. Niemczura
1, P. Lampens
8, J. Lykke
9, S. Bloemen
7,
J.F. Gameiro
2,10, C. Jean
7, D. Volpi
8, N. Gorlova
7, A. Mortier
2,10, M. Tsantaki
2,10,
G. Raskin
71 Instytut Astronomiczny Uniwersytetu Wroc lawskiego, ul. Kopernika 11, 51-622 Wroc law, Poland, E-mail: [email protected] 2 Centro de Astrof´ısica, Universidade do Porto, Rua das Estrelas, 4150-762 Porto, Portugal
3 INAF, Osservatorio Astrofisico di Catania, via S. Sofia, 78, 95123 Catania, Italy 4 Instituto de Astrof´ısica de Canarias, 38200 La Laguna, Tenerife, Spain
5 Departamento de Astrof´ısica, Universidad de La Laguna, 28206 La Laguna, Tenerife, Spain
6 Institut d’Astrophysique et de G´eophysique, Universit´e de Li`ege, All´ee du 6 Aoˆut 17, Bˆat B5c, 4000 Li`ege, Belgium 7 Instituut voor Sterrenkunde, KU Leuven, Celestijnenlaan 200D, 3001 Leuven, Belgium
8 Koninklijke Sterrenwacht van Belgi¨e, Ringlaan 3, 1180 Brussel, Belgium 9Nordic Optical Telescope, 38700 Santa Cruz de La Palma, Spain
10Departamento de F´ısica e Astronomia, Faculdade de Ciˆencias, Universidade do Porto, Portugal
Accepted 1988 December 15. Received 1988 December 14; in original form 1988 October 11
ABSTRACT
The asteroseismic and planetary studies, like all research related to stars, need precise and accurate stellar atmospheric parameters as input. We aim at deriving the effective temperature (Teff), the surface gravity (log g), the metallicity ([Fe/H]), the projected
rotational velocity (v sin i) and the MK type for 169 F, G, K, and M-type Kepler targets which were observed spectroscopically from the ground with five different instruments. We use two different spectroscopic methods to analyse 189 high-resolution, high-signal-to-noise spectra acquired for the 169 stars. For 67 stars, the spectroscopic atmospheric parameters are derived for the first time. KIC 9693187 and 11179629 are discovered to be double-lined spectroscopic binary systems. The results obtained for those stars for which independent determinations of the atmospheric parameters are available in the literature are used for a comparative analysis. As a result, we show that for solar-type stars the accuracy of present determinations of atmospheric parameters is ± 150 K in Teff, ± 0.15 dex in [Fe/H], and ± 0.3 dex in log g. Finally, we confirm that the
curve-of-growth analysis and the method of spectral synthesis yield systematically different atmospheric parameters when they are applied to stars hotter than 6,000 K.
Key words: stars: atmospheric parameters – open clusters and associations: indi-vidual: NGC 6811, NGC 6819 – space missions: Kepler
⋆ Based on observations acquired at the Canada-France-Hawaii Telescope (CFHT) which is operated by the National Research Council of Canada, the Institut National des Sciences de l’Univers of the Centre National de la Recherche Scientifique of France, and the University of Hawaii, the Telescope Bernard Lyot (USR5026) operated by the Observatoire Midi-Pyr´en´ees (Univer-sit´e de Toulouse and the Institut National des Science de l’Univers of the Centre National de la Recherche Scientifique of France), the Nordic Optical Telescope, operated jointly by Denmark, Finland, Iceland, Norway, and Sweden, and with the Mercator telescope,
operated by the Flemish Community, both located on the island of La Palma at the Spanish Observatorio del Roque de los Mucha-chos of the Instituto de Astrof´ısica de Canarias, and the M.G. Fra-castoro station of the INAF - Osservatorio Astrofisico di Catania, Italy. The Mercator observations were obtained with the HER-MES spectrograph, which is supported by the Fund for Scientific Research of Flanders (FWO), Belgium, the Research Council of K.U.Leuven, Belgium, the Fonds National de la Recherche Sci-entifique (FNRS), Belgium, the Royal Observatory of Belgium,
1 INTRODUCTION
Since March 2009, the 105 deg2 field located in
be-tween the constellations of Cygnus and Lyra has been continuously monitored by the NASA space mission
Ke-pler (Borucki et al. 2003; Koch et al. 2010). The effective temperature (Teff), surface gravity (log g), and metallicity
([Fe/H]) of stars in the Kepler field were derived from the Sloan griz photometry and are provided in the Kepler Input Catalog (KIC, Brown et al. 2011). KIC was created with the aim of providing a distinction between main-sequence stars and giants in the temperature range from 4,500 to 6,500 K. Within that range, the nominal precision of the values of Teff and log g in KIC is 200 K and 0.5 dex, respectively. For
hotter and cooler stars, the values of Teff and log g in KIC
become imprecise, while the estimates of [Fe/H] are poor in general (Brown et al. 2011).
This situation is very unfortunate for asteroseismic and planetary studies which require precise and accurate at-mospheric parameters of stars to produce reliable results (see, e.g., Stello et al. 2009; Creevey et al. 2012). There-fore, ground-based follow-up observations aiming at deriving the values of Teff, log g, and [Fe/H] are essential for
fur-ther investigation of the Kepler targets. Such programmes started well before the Kepler satellite was launched (see Molenda- ˙Zakowicz et al. 2007) and then, after the success-ful launch of the mission, were continued in the framework of the Kepler Asteroseismic Science Consortium1 (KASC)
as a series of coordinated observing programmes for sys-tematic spectroscopic and photometric observations (see Uytterhoeven et al. 2010a,b).
The first results of those proposals have been published by Molenda- ˙Zakowicz et al. (2010, 2011); Frasca et al. (2011); Fr¨ohlich et al. (2012); Bruntt et al. (2012); Thygesen et al. (2012). In this paper, we report the results of spectroscopic analysis of a next subset of F, G, K, and M-type stars. In Sect. 2, we outline the method of selecting targets. In Sect. 3, we provide information about the instruments and data acquisition, reduction and calibration. Our methods of analysis are described in Sect. 4. In Sect. 5, the atmospheric parameters are provided and compared with other determinations reported in the literature. Sect. 6 contains a discussion of the accuracy of our results and the accuracy of the determinations of the atmospheric parameters of the solar-type stars in general. Sect. 7 provides a summary.
2 TARGET SELECTION
Targets for each instrument were selected slightly differently. Those selected for the FIES spectrograph at the Nordic Optical Telescope (the principal investigator: KU) and the HERMES spectrograph at the Mercator telescope (the prin-cipal investigator: MB and EN) included solar-like p-mode oscillators, γ Dor, δ Sct, and β Cep–type stars, and stars in the open clusters NGC 6811 and NGC 6819 requested for observations by the KASC community. In this paper, we
the Observatoire de Gen`eve, Switzerland and the Th¨uringer Lan-dessternwarte Tautenburg, Germany.
1 http://astro.phys.au.dk/KASC
analyse the F, G, K, and M-type stars observed with FIES (ten stars) and HERMES (twenty stars). The results ob-tained for early-type stars will be presented by Niemczura et al. and Catanzaro et al. (in prep.) When prioritising targets in those two proposals, more weight was given to stars that showed a particular interesting variable signal in the Kepler light-curves and hence promise to be the best targets for a comprehensive asteroseismic study, and to stars that were of interest to different KASC working groups. Brightness of the stars was another important selection factor. Since we made use of medium- and high-resolution spectrographs at 1-m and 3-m-class telescopes, we were limited to stars brighter than about V = 13 mag. The final list of targets observed with HERMES included stars falling into the mag-nitude range of 10 > V > 8 mag, while those observed with FIES, into the range of 11.5 > V > 7 mag.
The 18 stars which were observed with the FRESCO spectrograph at the 91-cm telescope at INAF-Osservatorio Astrofisico di Catania (INAF-OACt, the principal investi-gator: JM- ˙Z) were selected from faint (11 > V > 8 mag), late-type (1.7 > B − V > 0.5 mag), close (the paral-lax π > 20 mas) stars in the Tycho catalogue (Høg et al. 2000) which are optical counterparts of X-ray sources in the ROSAT All-Sky Survey Catalogue (see Guillout et al. 1999). These stars were proposed for Kepler asteroseismic targets and for the follow-up ground-based observations by AF in the first call for proposals announced by KASC.
Our list of programme stars includes also 91 Kepler targets which were observed with the ESPaDOnS spectro-graph at the Canada-France-Hawaii Telescope (the princi-pal investigator: Claude Catala) and 50 stars observed with the NARVAL spectrograph at the Bernard Lyot Telescope (the principal investigators: KU and Claude Catala), for which the data are now public2. Those two instruments ob-served solar-type stars with the widest range of brightness: 12 > V > 7 mag.
The total number of spectra which we analyse is 189. However, because 15 stars were observed with two instru-ments and one star, with three, the number of the indi-vidual stars that we discuss in this paper is 172. Three of those stars are double-lined spectroscopic binaries (SB2) and therefore, we do not compute their atmospheric parameters; those values are provided for 169 stars. The stars with multi-ple observations are used for an internal check of the consis-tency of our results. Those for which Teff, log g, and [Fe/H]
have been derived by Bruntt et al. (2012) or Thygesen et al. (2012) from the ESPaDOnS and NARVAL spectra are in-cluded for the sake of analysing possible differences in the results obtained by means of different methods.
124 stars from our sample have been recently discovered to show solar-like oscillations and eleven, to show other types of photometric variability (see Table 3 and the references therein.) Four stars fall into the field of the open cluster NGC 6811 (KIC 9655101, 9655167, 9716090, and 9716522) and three, into the field of NGC 6819 (KIC 5024851, 5112786, and 5199859.) KIC 3632418 (= Kepler 21b) is a planet-hosting star (Howell et al. 2012) while KIC 8866102,
2 http://www.cfht.hawaii.edu/ObsInfo/Archive, http://tblegacy.bagn.obs-mip.fr/narval.html
9414417, 9955598, and 10963065 are Kepler candidates for stars with planets3.
3 OBSERVATIONS
Our programme stars were observed with five different in-struments. In Table 1, we provide names of those instru-ments, the names of the telescopes, the acronyms of the observatories, the number of acquired spectra (n), the year in which the data were acquired, the spectral range and the resolving power (R) of the spectrograph, the exposure time, and the typical signal-to-noise ratio (S/N ) along with the location in the wavelength where it was measured.
For all the instruments, the bias, flat field, and cali-bration lamp measurements were acquired in the evening and the morning. For FIES, additional spectra of the cali-bration lamp were obtained before each science observation. The data were reduced and calibrated following standard reduction procedures which included subtraction of the bias frame, correction for flat field, extraction of the orders, wave-length calibration, and cleaning the spectrum from cosmic rays. The normalisation of the spectra to the level of unity was done manually with IRAF4. More details about
obser-vations carried out with each of the five instruments are provided below.
3.1 FIES
FIES (FIber-fed Echelle Spectrograph) is a cross-dispersed high-resolution echelle spectrograph mounted on the 2.56-m Nordic Optical Telescope (NOT) at the Observatorio Roque de los Muchachos (ORM) on La Palma, Spain. We used the medium-resolution mode (R = 46, 000) to observe the bright stars (10 > V > 7 mag), and the low-resolution mode (R = 25, 000), for the faint ones (11.5 > V > 10 mag). The observations were carried out by EN and JL. The spectra were reduced and calibrated using the dedicated reduction software FIEStool (Stempels 2004) that is based on existing standard IRAF reduction procedures.
3.2 FRESCO
FRESCO is a fiber-linked REOSC echelle spectrograph fed by the 91-cm telescope of the Osservatorio Astrofisico di Catania (INAF-OACt), Italy. The observations were carried out by JM- ˙Z. The data were reduced and calibrated with IRAF.
3.3 HERMES
HERMES is a fiber-fed echelle spectrograph attached to the Flemish 1.2-m telescope Mercator, also at the ORM (Spain). It is optimised for high resolution, stability, and broad wave-length coverage which is achieved primarily by implementing an image slicer, an anti-fringe CCD coating, and a thermal
3 http://planetquest.jpl.nasa.gov/kepler/table
4 IRAF is distributed by the National Optical Astronomy Obser-vatory, which is operated by the Association of Universities for Research in Astronomy, Inc.
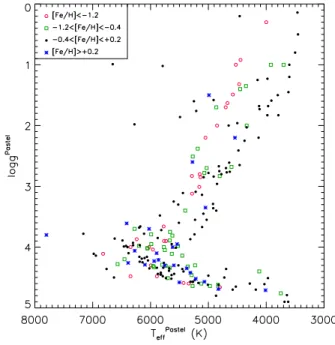
Figure 1.Distribution of the parameters adopted for the refer-ence stars in a Teff–log g plane. Stars in different ranges of metal-licity are displayed with different colours and symbols.
enclosure (Raskin et al. 2011). The observations were car-ried out by DD, PL, JG, NG, DV, SB, and CJ. The data reduction and calibration were performed with a dedicated Python-based pipeline (Raskin et al. 2011).
3.4 ESPaDOnS and NARVAL
The ESPaDOnS and the NARVAL spectrographs are very similar to each other. ESPaDOnS is mounted at the 3.6-m Canada-France-Hawaii Telescope (CFHT) at Mauna Kea Observatories (MKO, USA) while NARVAL is mounted at the 2-m T´elescope Bernard Lyot (TBL) at the Observa-toire Pic du Midi (OPM, France). Both instruments ob-served the Kepler targets in service mode. Data used in the present paper are available in the public archive of the Canada-France-Hawaii Telescope (CFHT) Science Data Archive and the CNRS/INSU CDAB/Bass2000 TBLegacy database. They were reduced and calibrated as part of the service programme by means of the data reduction software Libre-ESpRIT written and provided by J.-F. Donati from IRAP, Observatoire Midi-Pyr´en´ees (Donati et al. 1997).
4 METHODS OF ANALYSIS
We use two different methods of the spectroscopic analysis, ROTFIT and ARES+MOOG, to derive the atmospheric pa-rameters for our programme stars. As described below, each of these methods makes use of a different approach and has different limitations.
Table 1.A summary of instruments and observations.
Instrument Telescope Observatory n Year of Spectral R texp S/N observations range [˚A] [s]
FIES NOT ORM 4 2010-2011 3700-7300 46,000 420-2050 100 at 4900 ˚A FIES NOT ORM 6 2010-2011 3700-7300 25,000 1500-2600 100 at 4900 ˚A FRESCO 91-cm INAF-OACt 18 2009-2010 4300-6800 21,000 2700-4200 80 at 6500 ˚A HERMES Mercator ORM 20 2010-2011 3800-9000 85,000 500-2600 90 at 6500 ˚A NARVAL TBL OPM 50 2010 3700-10500 75,000 < 900 100 at 5200 ˚A ESPaDOnS CFHT MKO 91 2010 3700-10500 80,000 < 900 100 at 5200 ˚A
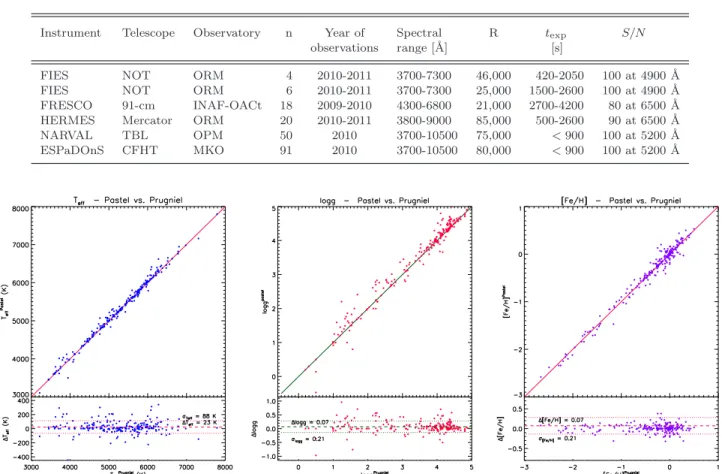
Figure 2.Comparison between the adopted atmospheric parameters (from the PASTEL catalogue, Soubiran et al. 2010) and those from the ELODIE library v3.1 (Prugniel et al. 2007).
4.1 ROTFIT
The code ROTFIT, developed by Frasca et al. (2003, 2006) in IDL5 software environment, was originally designed to perform an automatic MK spectral classification and a v sin i measure by comparing the target spectrum with a grid of slowly-rotating reference spectra. The latter are resampled, aligned to the target spectrum by cross-correlation, and ro-tationally broadened by convolution with a rotational profile of increasing v sin i until the minimum of χ2is reached. The
χ2 is defined by the following equation:
χ2= 1 N X j (yobs j −ytemplj )2 σ2 j (1)
where yjobsis the value of the continuum-normalised flux of
the observed spectrum at the jth point, ytempl
j is the
corre-sponding value for the rotationally-broadened template, σj
is the error of yobs
j , and N the number of data points.
The code was subsequently used for evaluating, in ad-dition to v sin i, the atmospheric parameters Teff, log g,
and [Fe/H] by adopting a list of reference stars with well known parameters (see, e.g., Molenda- ˙Zakowicz et al. 2007;
5 IDL (Interactive Data Language) is a registered trademark of ITT Visual Information Solutions.
Guillout et al. 2009). A good agreement between the val-ues of Teff, log g, and [Fe/H] derived with ROTFIT and
those obtained with other techniques are shown, e.g., by Metcalfe et al. (2010); Fr¨ohlich et al. (2012). Unlike codes based on the measurements of equivalent widths and curves of growth, ROTFIT can also be applied to the spectra of FGK stars with v sin i exceeding 20 km s−1 or spectra with
a moderate resolution, for which the blending of individual lines prevents the use of the previous methods. Our tests done on a selected sample of spectra of slowly rotating stars artificially broadened by convolution with a rotation pro-file showed that the derived atmospheric parameters are not significantly affected up to v sin i ≈ 50 km s−1. For higher
values of v sin i, the uncertainties of the atmospheric param-eters increase and eventually become as high as 1.5–2 times the original values for v sin i = 100 km s−1. As an example
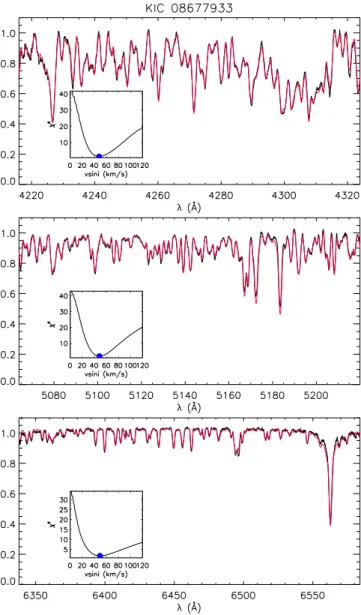
of the output produced by ROTFIT for a fast-rotating star (KIC 8677933, G0IV, v sin i = 49.6 km s−1), the plot of the
observed spectrum and the best-matching template in three spectral regions is shown in Fig. 3. The insets, in which χ2
for the best template is plotted as a function of v sin i, show that even for such a fast-rotating star the minimum of χ2is
well defined and that the observed and the template spectra match well.
Our library of reference stars consists of 221 high-resolution (R = 42,000), high-S/N spectra of slowly ro-tating stars acquired with the fiber-fed echelle
spectro-Figure 3. A part of the output of the ROTFIT code for KIC 8677933, a G0IV fast rotating star (v sin i = 49.6 km s−1) in three different spectral segments. In each panel, the best template spectrum (thin red line), rotationally broadened and Doppler-shifted, is superimposed onto the observed spectrum of KIC 8677933 (thick black line). The insets show the χ2 for the best template as a function of v sin i.
graph ELODIE at the Haute-Provence Observatory which are available in the ELODIE archive (Prugniel & Soubiran 2001). The atmospheric parameters of these stars were re-trieved from the PASTEL catalogue (Soubiran et al. 2010) and are listed in Table 2. Since for most stars in the PAS-TEL catalogue there are several determinations of Teff, log g,
and [Fe/H] obtained by different authors and with different methods, we selected those which are recent, based either on spectral synthesis or on the analysis of the equivalent widths, and which are not significantly different from the bulk of the other determinations. The Teff–log g diagram
(Fig. 1) shows that the reference stars are rather well dis-tributed in all the regions relevant for FGK stars with a den-sity that is not certainly uniform, but not very far from it. A comparison between the values of Teff, log g, and [Fe/H]
adopted by us and those homogeneously re-determined in
the ELODIE library v3.1 by Prugniel et al. (2007) for 220 stars (we note that the latter authors do not provide atmo-spheric parameters for star GJ 166 C) displays very small offsets and dispersions of 88 K, 0.21 dex, and 0.21 dex for Teff, log g, and [Fe/H], respectively (see Fig. 2). That ensures
that the adopted parameters are well consistent with those of Prugniel et al. (2007). Table 2 gives also the MK types of our reference stars. Those were adopted either from the SIMBAD database or from the General Catalogue of Stel-lar Spectral Classifications by Skiff (2013). For most stars that classification agrees with the MK types given for our reference stars in the ELODIE database.
We have analysed independently spectral segments of 100 ˚A each or the individual echelle orders, depending on the format of the spectra. We have excluded from the fit the spectral regions heavily affected by telluric lines, like the O2
band from 6275 to 6330 ˚A. Per each segment, we took the average parameters of the best ten reference stars (∼ 5 % of the total sample), with a weight proportional to χ−2.
Although ROTFIT uses a fixed number of nearest neighbours (10), the weight provided by the χ2limits the contamination
of the final parameters and allows a meaningful estimate of the uncertainties.
We adopted as the best estimates of Teff, log g, and
[Fe/H] the weighted averages of the results of each spectral segment using σ−2
i χ−2i fias the weight. Here, σiis the
stan-dard error of the parameters for the best 10 templates of the ith spectral segment. As such it is adopted as a relative
measure of the internal consistency for the ith spectral
seg-ment/order, χ−2
i is the minimum chi-square of the ith
seg-ment and takes into account differences between orders due to the S/N and the goodness of the fit. The factor fi, which
is an integral over all the ithspectral segment of (Fλ/FC−1),
is proportional to the total line absorption and was included in the weight to correct for the different amount of infor-mation contained in different spectral segments. We evalu-ated the uncertainties of Teff, log g, [Fe/H], and v sin i as the
standard errors on the weighted means to which we have summed in quadrature the average dispersion of differences between the stellar parameters of our reference stars given in the PASTEL catalogue and in Prugniel et al. (2007), i.e., σTeff = 88 K, σlog g = 0.21 dex, and σ[Fe/H]= 0.21 dex (see
Fig. 2). The MK classification of the target star is performed by adopting the spectral type and the luminosity class of the reference star which more frequently matched with the tar-get spectrum in the different spectral segments.
4.2 ARES+MOOG
This method of analysis allows the derivation of Teff, log g,
the microturbulence ξt, and [Fe/H] following a procedure
described and used in (Santos et al. 2004; Sousa et al. 2006, 2008, 2011a,b). Because this method relies on two core codes, namely ARES (Automatic Routine for line Equivalent widths in stellar Spectra) developed by Sousa et al. (2007) and MOOG developed by Sneden (1973), we refer to it as to ARES+MOOG. The method is based on measuring equiv-alent widths (EW s) of Fe I and Fe II weak absorption lines and then imposing excitation and ionisation equilib-rium, assuming LTE approximation. The 2002 version of the code MOOG code is used together with the grid of Atlas 9 plane-parallel model atmospheres (Kurucz 1993). In this
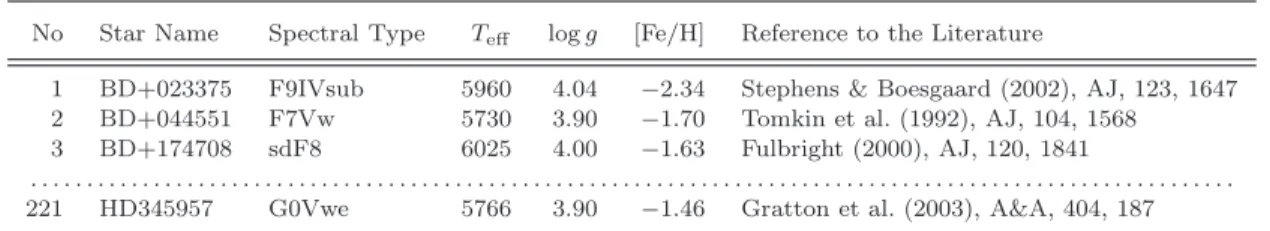
Table 2. The first three rows and the last row of Table 2 which provides the MK type, effective temperature, surface gravity, and metallicity of 221 reference stars used by the ROTFIT code. The atmospheric parameters are adopted mostly from the PASTEL catalogue (Soubiran et al. 2010). The last column provides the references to the sources of the adopted values. The full table is available only in an electronic form.
No Star Name Spectral Type Teff log g [Fe/H] Reference to the Literature
1 BD+023375 F9IVsub 5960 4.04 −2.34 Stephens & Boesgaard (2002), AJ, 123, 1647 2 BD+044551 F7Vw 5730 3.90 −1.70 Tomkin et al. (1992), AJ, 104, 1568 3 BD+174708 sdF8 6025 4.00 −1.63 Fulbright (2000), AJ, 120, 1841
. . . . 221 HD345957 G0Vwe 5766 3.90 −1.46 Gratton et al. (2003), A&A, 404, 187
procedure, [Fe/H] is a proxy of the metallicity. The equiva-lent widths are measured automatically with the ARES code which successfully reproduces the manual, interactive deter-mination of EW s.
One of the unique characteristics of ARES+MOOG is the list of iron lines. Although a preliminary large list of nearly 500 lines was compiled from the Vienna Atomic Line Database (Kupka et al. 1999), the final list includes around 300 most reliable lines that were carefully tested when auto-matically measured with ARES (Sousa et al. 2008). Another important aspect of the list is the adopted atomic param-eters for each line: The oscillator strengths (log gf ) of the lines were recomputed through an inverse analysis of the so-lar spectrum, allowing in this way to perform a differential analysis relatively to the Sun.
The errors of the parameters derived with
ARES+MOOG were obtained by quadratically adding 60 K, 0.1 and 0.04 dex to the method’s intrinsic errors in Teff, log g, and [Fe/H], respectively. Those values were
obtained by measuring the typical standard deviation of the parameters discussed by Sousa et al. (2008). A more complete discussion of errors representative for this spectroscopic method can be found in Sousa et al. (2011a). Since we adopt a differential analysis (using the Sun as the reference), this method is expected to work very well for solar-type stars and to be less accurate for the cooler and the hotter stars, and those which are significantly different from the Sun. For this reason, we don’t provide results for stars cooler than about 4,500 K. Moreover, since ARES+MOOG requires precise measurements of the EW s, we do not pro-vide results for stars with v sin i > 10 km s−1because higher
rotation causes line blending, preventing precise determi-nation of EW . Finally, as ARES+MOOG works best with high-resolution spectra, we do not apply this method to stars observed with R 6 25, 000.
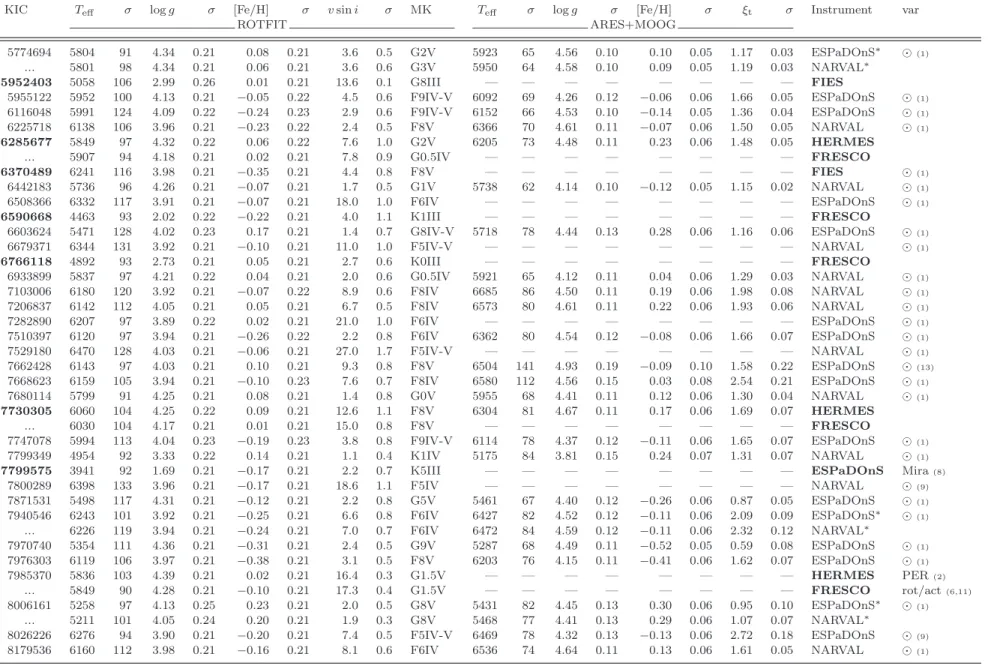
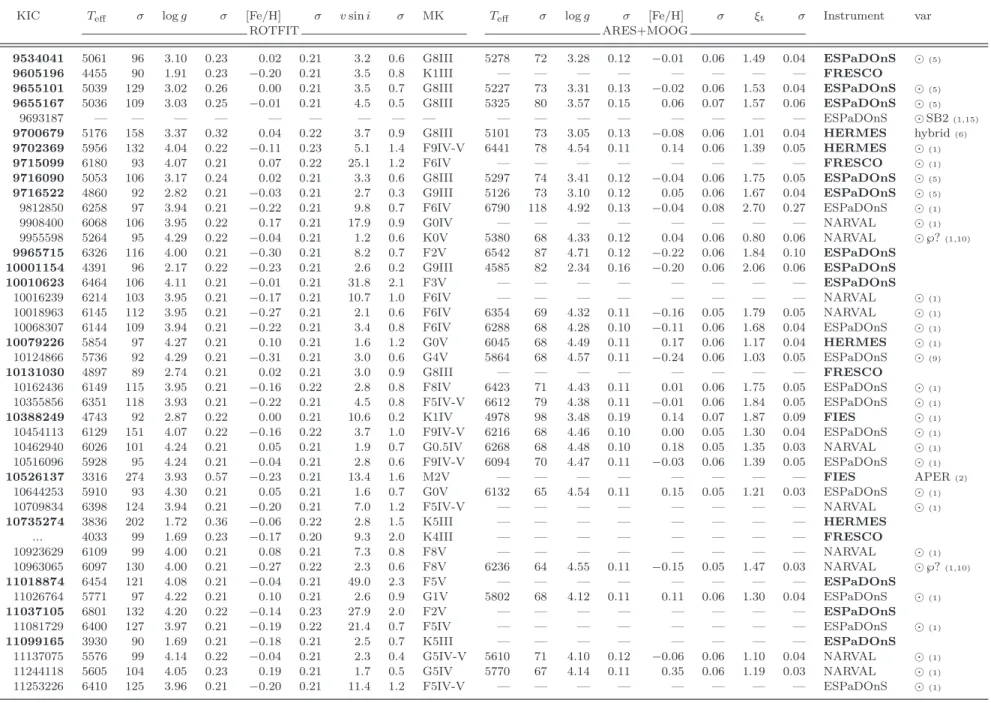
5 ATMOSPHERIC PARAMETERS
The values of Teff [K], log g [cm s−2], [Fe/H] [dex], and
v sin i [km s−1] with their standard deviations, and the MK
type derived with ROTFIT are listed in columns 2-10 of Ta-ble 3. The values of Teff [K], log g [cm s−2], [Fe/H] [dex],
and ξt[km s−1] with their standard deviations derived with
ARES+MOOG are listed in columns 11-18. KIC numbers are provided in the first column and the designations of the instrument, in the last but one. The last column contains information about the type of variability of the stars. We
use boldface font for KIC numbers of the stars for which atmospheric parameters are derived for the first time. The boldface font instrument designations indicate that the re-spective spectrum has not been used in any previous analy-ses in the literature.
For KIC 9693187 and 11179629, we detected lines of both components in the spectrum. KIC 9025370 was discov-ered to be a double-lined spectroscopic binary by Thygesen et al. (in preparation). We do not compute the atmospheric parameters for these three stars and we indicate in Table 3 that they are SB2 systems.
For KIC 6370489, 10709834, and 10923629 we do not provide the atmospheric parameters obtained with ARES+MOOG. In the spectrum of the first star we find too few useful spectral lines for ARES+MOOG to converge. In case of KIC 10709834 and 10923629, ARES+MOOG yields very high values of log g which are not confirmed with ROT-FIT. Therefore, we suspect that the results produced by ARES+MOOG for those two stars may be spurious.
Below, we discuss the values of Teff, log g, and [Fe/H]
determined with ARES+MOOG and with ROTFIT. We com-pare these results with each other and with those ob-tained with the VWA (Versatile Wavelength Analysis) code by Bruntt et al. (2012) and Thygesen et al. (2012) for one hun-dred stars from our sample. For 145 stars, we compare our temperature determinations with the ones derived with the infrared flux method (IRFM) by Pinsonneault et al. (2012).
5.1 Effective temperature
As shown in Fig. 4, the differences between the values of Teff
derived with ARES+MOOG, ROTFIT, VWA and IRFM show various offsets and large standard deviation. The standard deviation is lowest but still significant when the comparisons involve Teff computed with VWA (Fig. 4 b, d, and f ). This
must be related to the fact that VWA was applied to high-S/N , high-resolution spectra from ESPaDOnS and NAR-VAL: When data of high quality are used, all methods yield Teff which are more precise and accurate
For stars with Teff > 6, 000 K, the effective
tempera-tures derived with ARES+MOOG are systematically hotter than those obtained with ROTFIT and VWA (Fig. 4 a and b.) Between 5,000 K and 6,000 K these three methods agree well but for stars cooler than 5,000 K, ARES+MOOG yields slightly higher values of Teffwhich is why for the coolest stars
the agreement between ARES+MOOG and ROTFIT or VWA is worse again. The reason for this may be related to the
se-lection of spectral lines. The original list of lines is optimised for solar-type stars while for cool stars many of those lines are affected by blending. This effect contributes strongly to the observed offset in temperature. A refinement of the se-lection of lines to produce consistent results for stars cooler than 5,000 K will be presented by Tsantaki et al. (2013).
Fig. 4 a and b show that when ROTFIT and VWA are compared to ARES+MOOG, the differences show a similar pattern. This suggest that Teff obtained with ROTFIT and
VWA should be close to each other. Indeed, the mean differ-ence between Teff derived by means of those two methods
is relatively small, only 70 K. Nevertheless, the standard deviation of the differences, 123 K, is still high (Fig. 4 d.)
When compared with the IRFM-based Teff measured by
Pinsonneault et al. (2012), the values of Teff derived with
ARES+MOOG show a negligible offset of 7 K but a high standard deviation of 152 K (Fig. 4 c). The two other meth-ods, ROTFIT and VWA, show a much higher mean difference, 182 and 149 K, and similar standard deviation of 179 and 104 K, respectively (Fig. 4 e and f ). Therefore, it is diffi-cult to say which of those methods, if any, agrees with IRFM best.
Since ARES+MOOG temperature scale is known to be in a very good agreement with IRFM (see Sousa et al. 2008), we would expect the results shown in Fig. 4 c to agree much better than is the case. One of the plausible explanations of the observed scatter is the fact that the IRFM-based Teff
pro-vided by Pinsonneault et al. (2012) were derived only from one colour index, (J − KS). This index produces the
val-ues of Teff which show the highest scatter when compared
with the IRFM Teff derived from other colour indices (see
Figs. 9-11 in Pinsonneault et al. 2012). Indeed, when the mean values of the IRFM Teff of stars in the Hyades and
Praesepe open clusters (computed from (B − V ), (V − IC),
and (V −KS) indices) are compared with the (J −KS)-based
Teff values, and their differences are plotted as a function of
the YREC Teff computed by Pinsonneault et al. (2012) by
using the isochrones by An et al. (2007), the differences are positive by around 100 K for stars which are cooler than 5900 K and negative by around 50 K for stars which are hotter than 6200 K (see the Fig. 13 in Pinsonneault et al. 2012). The (J − KS)-based Teff of the Kepler stars shown in
the same figure show a similar trend as the (J − KS)- based
Teff of stars in Hyades and Praesepe; only for stars hotter
than 6200 K their values are closer to the YREC Teff scale
(but still lower by around 100 K.)
These results allow us to conclude that the high stan-dard deviation of the differences shown in Fig. 4 c is likely due to the calibration issues in the (J − KS) colour index
(c.f. Sect. 3.3 in Pinsonneault et al. 2012), not to any pos-sible weakness of ARES+MOOG. The general consistency of the effective temperatures derived from spectroscopy and the IRFM method is supported also by Bruntt et al. (2012) who show that Teffcomputed with VWA are in a good
agree-ment with the IRFM Teff values derived from the VT−KS
index and the calibration of Casagrande et al. (2012) as the mean difference between those two scales of temperature is only 4 ± 85 K (see Bruntt et al. 2012, figure 2) whereas the standard deviation of the differences between VWA-based Teff and those obtained from the (J − KS) index shown in
Fig. 4 f is comparable to the value obtained for Fig. 4 c. One should also keep in mind that IRFM Teff
de-rived by Pinsonneault et al. (2012) may be slightly affected by interstellar reddening of the stars: Because there are no individual measurements of E(B − V ) for each tar-get, Pinsonneault et al. (2012) correct the observed mag-nitudes for interstellar extinction using the map-based es-timates of extinction from KIC. Unfortunately, those val-ues of E(B − V ) are not accurate as has been shown by Molenda- ˙Zakowicz et al. (2009) for 29 nearby (16 < r < 240 pc), bright (9.0 < V < 11.2) Kepler targets which were observed photometrically by those authors. Molenda- ˙Zakowicz et al. (2009) did not find any evidence that those stars were reddened while E(B − V ) provided in KIC were sometimes as high as 0.06 mag. The influence of inaccurate E(B − V ) used by Pinsonneault et al. (2012) on the IRFM Teff may be small but should be considered as one
of possible sources of the scatter in Fig. 4 c, e, and f .
5.2 Metallicity
As shown in Fig. 5 a, b, and c, the values of [Fe/H] de-rived with ARES+MOOG, ROTFIT and VWA agree with each other to within the error bars for almost all targets. The mean differences between these determinations do not ex-ceed 0.07 dex. However, their standard deviations are quite large and comparable to the typical uncertainty of [Fe/H] derived with ROTFIT or to twice the typical uncertainty of [Fe/H] derived with ARES+MOOG.
For the stars hotter than 6,000 K, the values of [Fe/H] derived with ARES+MOOG are slightly higher than those obtained with ROTFIT or VWA (Fig. 5 a and b). However, this trend does not affect the overall consistency of the re-sults. The values of [Fe/H] obtained with ROTFIT and VWA agree best (Fig. 5 c) showing a mean difference of 0.03 dex and no trends at high temperatures. The high standard de-viation is not reduced, however, and it is as high as that in Fig. 5 a where the mean difference is the highest and the trend at the high temperatures is most obvious.
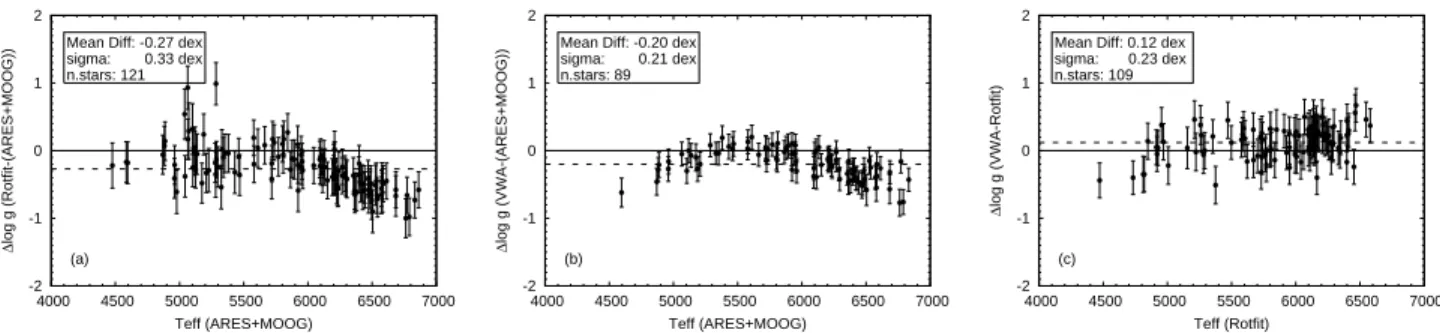
5.3 Surface gravity
The surface gravity is the parameter which is least con-strained when derived with ARES+MOOG. The reason for this is related to the number of iron lines used in the method. Although we use nearly 300 Fe I lines, which constrains very well the temperature, microturbulence, and the metal abun-dance, log g, which comes from the ionisation balance, re-quires an analysis of Fe II lines. Unfortunately, the number of Fe II lines in our line list is limited to less than 20. Due to that small number, the results of the analysis are more sensitive to errors and more uncertain.
The differences between the log g values computed with ARES+MOOG, ROTFIT, and VWA illustrated in Fig. 6 a and b, are around 0.2 dex, and show discrepancies increas-ing for hot stars. The trends visible in Fig. 6 a and b, mimic those in Fig. 4 a and b which may be a result of strong cor-relations between Teff and log g. The values of log g obtained
with ROTFIT and with VWA agree with each other better (Fig. 6 c.) The mean difference between them is the lowest, 0.12 dex, and there are no trends for hot stars. However, the standard deviation of these differences is still high.
-1000 -500 0 500 1000 4000 4500 5000 5500 6000 6500 7000 ∆ Teff (Rotfit-(ARES+MOOG)) Teff (ARES+MOOG) (a) Mean Diff: -178 K sigma: 159 K n.stars: 121 -1000 -500 0 500 1000 4000 4500 5000 5500 6000 6500 7000 ∆ Teff (VWA-(ARES+MOOG)) Teff (ARES+MOOG) Mean Diff: -134 K sigma: 97 K n.stars: 89 (b) -1000 -500 0 500 1000 4000 4500 5000 5500 6000 6500 7000 ∆ Teff (IRFM-(ARES+MOOG)) Teff (ARES+MOOG) (c) Mean Diff: -7 K sigma: 152 K n.stars: 109 -1000 -500 0 500 1000 4000 4500 5000 5500 6000 6500 7000 ∆ Teff (VWA-Rotfit) Teff (Rotfit) (d) Mean Diff: 70 K sigma: 123 K n.stars: 109 -1000 -500 0 500 1000 4000 4500 5000 5500 6000 6500 7000 ∆ Teff (IRFM-Rotfit) Teff (Rotfit) (e) Mean Diff: 182 K sigma: 179 K n.stars: 159 -1000 -500 0 500 1000 4000 4500 5000 5500 6000 6500 7000 ∆ Teff (IRFM-VWA) Teff (VWA) (f) Mean Diff: 149 K sigma: 104 K n.stars: 98
Figure 4.Mutual comparison of Teff values measured with four different methods: ROTFIT and ARES+MOOG (this paper), VWA (Bruntt et al. 2012; Thygesen et al. 2012) and IRFM (Pinsonneault et al. 2012). In the insets, we give the mean difference between the compared sets of data, the standard deviation of the mean, and the number of stars in common.
-2 -1 0 1 2 4000 4500 5000 5500 6000 6500 7000 ∆ [Fe/H] (Rotfit-(ARES+MOOG)) Teff (ARES+MOOG) (a)
Mean Diff: -0.07 dex sigma: 0.12 dex n.stars: 121 -2 -1 0 1 2 4000 4500 5000 5500 6000 6500 7000 ∆ [Fe/H] (VWA-(ARES+MOOG)) Teff (ARES+MOOG) Mean Diff: -0.05 dex
sigma: 0.09 dex n.stars: 89 (b) -2 -1 0 1 2 4000 4500 5000 5500 6000 6500 7000 ∆ [Fe/H] (VWA-Rotfit) Teff (Rotfit) (c)
Mean Diff: 0.03 dex sigma: 0.12 dex n.stars: 109
Figure 5.Mutual comparison of [Fe/H] values measured with three different methods: ROTFIT and ARES+MOOG (this paper), and VWA (Bruntt et al. 2012; Thygesen et al. 2012). In the insets, we give the mean difference between the compared sets of data, the standard deviation of the mean, and the number of stars in common.
-2 -1 0 1 2 4000 4500 5000 5500 6000 6500 7000 ∆ log g (Rotfit-(ARES+MOOG)) Teff (ARES+MOOG) (a)
Mean Diff: -0.27 dex sigma: 0.33 dex n.stars: 121 -2 -1 0 1 2 4000 4500 5000 5500 6000 6500 7000 ∆ log g (VWA-(ARES+MOOG)) Teff (ARES+MOOG) Mean Diff: -0.20 dex
sigma: 0.21 dex n.stars: 89 (b) -2 -1 0 1 2 4000 4500 5000 5500 6000 6500 7000 ∆ log g (VWA-Rotfit) Teff (Rotfit) (c)
Mean Diff: 0.12 dex sigma: 0.23 dex n.stars: 109
6 DISCUSSION
Our analysis shows that deriving precise and accurate at-mospheric parameters is not a trivial task and that limiting such determinations to one method can result in a false im-pression that the accuracy of the atmospheric parameters is as high as is their precision. We showed that while within one method the precision of the computations can be high, when results are compared to those obtained by means of other methods or from different data, various trends and offsets appear, proving that we are not yet able to provide accurate values of Teff, log g, and [Fe/H] for solar-type stars.
KIC 5184732 is a good example of those difficulties. In Table 3, we give the atmospheric parameters of that star derived independently from the spectra acquired with FRESCO, ESPaDOnS, and NARVAL. The atmospheric parameters computed with ARES+MOOG from the ES-PaDOnS and NARVAL data agree with each other very well. A good consistency in the atmospheric parameters for all the spectra computed with ROTFIT is also found. However, the differences between those two sets of determinations amount to around 150 K in Teff, 0.12 dex in log g, and 0.20 dex
in [Fe/H]. For ROTFIT, there are also less pronounced but still not negligible differences between Teff, log g and [Fe/H]
derived from the observations acquired with FRESCO and those obtained with ESPaDOnS and NARVAL.
The trends and discrepancies in the atmospheric param-eters observed for stars hotter than 6,000 K represent yet an-other significant but not a new problem. The problem has been thoroughly discussed, but not solved, by Torres et al. (2012). Those authors compare atmospheric parameters ob-tained with SPC and SME, two codes in which the method of spectral synthesis is used, with the values of Teff, log g,
and [Fe/H] computed with MOOG, which uses the curve-of-growth approach. The differences noticed by Torres et al. (2012) are similar to those reported in the present paper. A similar trend can be noticed also in Fig. 3 b, in Sousa et al. (2008), where Teff computed with ARES+MOOG are
com-pared with those obtained with SME. The origin of those discrepancies is not clear but they seem to reflect systematic differences between atmospheric parameters obtained from the spectral synthesis and the analysis of equivalent widths. However, confirming that suspicion would require detailed examination of the input physics used in all the discussed methods which is beyond the scope of this paper.
The comparative analysis which we carried out showed that the currently available accuracy of atmospheric pa-rameters of solar-type stars is ±150 K in Teff, ±0.15 dex
in [Fe/H] and ±0.3 dex in log g. This applies particularly to faint stars and those hotter than 6,000 K. Since log g is the parameter most difficult to constrain in spectro-scopic analysis, for stars showing solar-like pulsations and those with planetary transits, the seismic log g or the val-ues of log g derived from the transit light curves may be used as an alternative value for asteroseismic modelling. Indeed, the log g values derived from transit light curves (Seager & Mallen-Ornelas 2003) are currently preferred in the investigation of the transiting planets (c.f. Torres et al. 2012) whereas in asteroseismic modelling of stars showing solar-like oscillations, the seismic values of log g are pre-ferred to the spectroscopic ones (c.f. Morel & Miglio 2012). Another potentially important application of the
asteroseis-mically determined surface gravities may be a validation test for the values of log g derived from the spectroscopic analy-ses (see Creevey et al. 2013).
7 SUMMARY
In this paper, we provided two sets of determinations of at-mospheric parameters for 169 F, G, K, and M-type stars, dwarfs and giants, with Teff ranging from 3,200 to 6,700 K.
The first set was computed with ARES+MOOG, a method based on the analysis of the equivalent widths of spectral lines. The other was derived with ROTFIT, which makes use of the full spectrum by comparison to a grid of ref-erence stars with well-known atmospheric parameters. The latter code was used also to derive the projected rotational velocities of the stars. For 67 stars, the atmospheric pa-rameters (Teff, log g, and [Fe/H]) are provided for the first
time. KIC 9693187 and KIC 11179629 are newly discovered double-lined spectroscopic binary systems.
The typical internal precision of the atmospheric pa-rameters obtained with ARES+MOOG is rather high: ±80 K, ±0.12 dex, and ±0.06 dex in Teff, log g, and [Fe/H], re-spectively. ROTFIT displays a lower internal precision with typical errors of 110 K in Teff, and 0.21 dex in log g and
[Fe/H], however, the values of the atmospheric parameters are in good agreement with those derived by Bruntt et al. (2012) and Thygesen et al. (2012). Therefore, we conclude that both ROTFIT and ARES+MOOG produce determina-tions which can be safely used for asteroseismic modelling of stars or for studying stellar structure and evolution.
Having shown that for solar-type stars the present ac-curacy of the spectroscopic determinations of atmospheric parameters is ±150 K in Teff, ±0.15 dex in [Fe/H], and
±0.3 dex in log g, we emphasise the importance of collect-ing high-quality spectra with sufficiently large telescopes equipped with efficient spectrographs. We stress also the need of examining reasons why for hot stars the spectral synthesis method and the curve-of-growth analysis yield at-mospheric parameters which are systematically different.
ACKNOWLEDGEMENTS
We thank Thierry Louge for help in retrieving the data from the CNRS/INSU CDAB/Bass2000 TBLegacy database operated by the University of Toulouse/OMP, Tarbes, France. We thank the Spanish Night time CAT for award-ing the observaward-ing time to programs 61-Mercator3/11B, 119-NOT12/11A, and 61-NOT7/10A. J.M.- ˙Z., E.N., and D.D. acknowledge the Polish MNiSW grant N N203 405139. D.D. acknowledges the Polish National Science Cen-tre grant No. 2011/01/N/ST9/00400. A.F. acknowledges the Italian Ministero dell’Istruzione, Universit`a e Ricerca
(MIUR). S.G.S., A.M., and M.T. acknowledge the sup-port of the European Research Council/European Com-munity under the FP7 through Starting Grant agree-ment number 239953. S.G.S. and J.M.- ˙Z. acknowledge the support from Funda¸c˜ao para a Ciˆencia e a Tecnolo-gia (FCT) through the grant SFRH/BPD/47611/2008, the projects AST/098528/2008, PTDC/CTE-AST/098754/2008, and the ’Coopera¸c˜ao Cientifica e
Tec-nologica FCT/Polonia 2011/2012 (Proc. 441.00 Polonia)’, funded by FCT/MCTES, Portugal and POPH/FSE (EC). SB acknowledges funding from the European Research Council under the European Community’s Seventh Frame-work Programme (FP7/2007–2013)/ERC grant agreement n◦227224 (PROSPERITY). KU acknowledges financial
sup-port by the Spanish National Plan of R&D for 2010, project AYA2010-17803. M.B. is F.R.S.-FNRS Postdoctoral Re-searcher, Belgium.
We thank the anonymous Referee for the comments which helped us improve this paper.
REFERENCES
An D., Terndrup D. M., Pinsonneault M. H., Paulson D. B., Hanson R. B., Stauffer J. R. 2007, ApJ, 655, 233 Appourchaux T., et al. 2012, A&A, 543, 54
Borucki W. J., et al. 2003, in Society of Photo-Optical In-strumentation Engineers (SPIE) Conference Series, Vol. 4854, Society of Photo-Optical Instrumentation Engi-neers (SPIE) Conference Series, J. C. Blades, O. H. W. Siegmund, eds., pp. 129140
Brown T. M., Latham D. W., Everett M.
E., Esquerdo G. A. 2011, AJ, 142, 112
(http://cdsarc.u-strasbg.fr/viz-bin/Cat?V/133) Bruntt H., et al. 2012, MNRAS 423, 122
Casagrande L., Ram´ırez I., Mel´endez J., Bessell M., As-plund M. 2010, A&A 512, 54
Chaplin W. J., et al. 2011, Science, 332, 213 Creevey O. L., et al. 2012, A&A 537, A111 Creevey O. L., et al. 2013, MNRAS, 431, 2419
Donati J.-F., Semel M., Carter B. D., Rees D. E., Collier Cameron A. 1997, MNRAS, 291, 658
Frasca A., Alcal`a J. M., Covino E., Catalano S., Marilli E., Paladino R. 2003, A&A, 405, 149
Frasca A., Guillout P., Marilli E., Freire Ferrero R., Biazzo K., Klutsch A. 2006, A&A, 454, 301
Frasca A., Fr¨ohlich H.-E., Bonanno A., Catanzaro G., Bi-azzo K., Molenda- ˙Zakowicz J. 2011, A&A, 532, 81 Fr¨ohlich H.-E., Frasca A., Catanzaro G., Bonanno A.,
Cor-saro E., Molenda- ˙Zakowicz J., Klutsch A., Montes D. 2012, A&A, 543, 146
Gai N., Basu S., Chaplin W. J., Elsworth Y. 2011, ApJ, 730, 63
Guillout P., Schmitt J. H. M. M., Egret D., Voges W., Motch C., Sterzik M. F. 1999, A&A 351, 1003
Guillout P., et al. 2009, A&A 504, 829 Hekker S., et al. 2011, MNRAS, 414, 2594 Høg E., et al. 2000, A&A, 355, 27 Howell S. B., et al. 2012, ApJ, 746, 123 Huber D., et al. 2011, ApJ, 743, 143
Katz D., Soubiran C., Cayrel R., Adda M., Cautain R. 1998, A&A, 338, 151
Koch D. G., et al. 2010, ApJ, 713, L79
Kupka F., Piskunov N., Ryabchikova T. A., Stempels H. C., Weiss W. W. 1999, A&AS, 138, 119
Kurucz R. 1993, ATLAS9 Stellar Atmosphere Programs and 2 km/s grid. Kurucz CD-ROM No. 13, Cambridge (Mass.: Smithsonian Astrophysical Observatory)
Metcalfe T. S., et al. 2010, ApJ, 723, 1583 Molenda- ˙Zakowicz J., et al. 2010, AN, 331, 981
Molenda- ˙Zakowicz J., Frasca A., Latham D. W.,
Jerzykiewicz M. 2007, AcA, 57, 301
Molenda- ˙Zakowicz J., Kopacki G., St¸e´slicki M., Narwid A. 2009, AcA, 59, 193
Molenda- ˙Zakowicz J., Latham D. W., Catanzaro G., Frasca A., Quinn S. N. 2011, MNRAS, 412, 1210
Morel T., Miglio A. 2012, MNRAS, 419, L34
Pigulski A., Pojma´nski G., Pilecki B., Szczygie l D. M. 2009, AcA, 59, 33
Pinsonneault M. H., An D., Molenda- ˙Zakowicz J., Chaplin W. J., Metcalfe T. S., Bruntt H. 2012, ApJS 199, 30 Prugniel Ph., Soubiran C. 2001, A&A, 69, 1048
Prugniel Ph., Soubiran C., Koleva M., Le Borgne D. 2007, New release of the ELODIE library: Version 3.1, arXiv:astro-ph/0703658
Raskin G., et al. 2011, A&A, 526, 69
Santos N. C., Israelian G., Mayor M. 2004, A&A, 415, 1153 Seager S., Mallen-Ornelas G. 2003, ApJ, 585, 1038 Sergey I. 2007, Perem. Zvezdy Prilozh., 7, 2
Skiff B.A. 2013, Catalogue of Stellar Spectral Classifications (Skiff, 2009-2013)
Smelcer L. 2003, IBVS, 5436, 1
Sneden C. 1973, Ph.D. Thesis, Univ. of Texas
http://www.as.utexas.edu/~chris/moog.html Soubiran C., Katz D., Cayrel R. 1998, A&AS, 133, 221 Soubiran C., Le Campion J.-F., Cayrel de Strobel G., Caillo
A. 2010 A&A 515, A111
Sousa S. G., Santos N. C., Israelian G., Mayor M., Monteiro M. J. P. F. G. 2006, A&A, 458, 873
Sousa S. G., Santos N. C., Israelian G., Mayor M., Monteiro M. J. P. F. G. 2007, A&A, 469, 783
Sousa S. G., Santos N. C., Israelian G., Mayor M., Udry S. 2011, A&A, 533, A141
Sousa S. G., Santos N. C., Israelian G., Lovis C., Mayor M., Silva P. B., Udry S. 2011a, A&A, 526, A99
Sousa S. G., Santos N. C., Israelian G., Mayor M., Udry S. 2011b, A&A, 533, A141
Sousa S. G., et al. 2008, A&A, 487, 373 Stello D., et al. 2009, ApJ 700, 1589 Stello D., et al. 2011, ApJ 739, 13
Stempels E. 2004, FIES Automatic Data Reduction Software (http://www.not.iac.es/instruments/fies/ fiestool/FIEStool-manual-1.0.pdf)
Thygesen A. O., et al. 2012, A&A, 543, A160
Torres G., Fischer D. A., Sozzetti A., Buchhave L. A., Winn J. N., Holman M. J., Carter J. A. 2012, ApJ, 757, 161 Tsantaki M., Sousa S. G., Adibekyan V. Zh., Santos
N. C., Mortier A., Israelian G. 2013, A&A (in press) (arXiv:1304.6639)
Uytterhoeven K., et al. 2010a, AN, 331, 993 Uytterhoeven K., et al. 2011, A&A 534, 125
Uytterhoeven K., et al. 2010b, AN, 331, P30
(arXiv:1003.6089)
A
tm
o
sp
h
er
ic
P
a
ra
m
et
er
s
o
f
1
6
9
F
,
G
,
K
a
n
d
M
-t
y
pe
S
ta
rs
in
th
e
K
ep
le
r
F
ie
ld
1
1
KIC Teff σ log g σ [Fe/H] σ v sin i σ MK Teff σ log g σ [Fe/H] σ ξt σ Instrument var
ROTFIT ARES+MOOG
1430163 6412 123 3.97 0.21 −0.25 0.21 8.1 0.9 F5IV 6833 87 4.70 0.11 0.02 0.06 2.12 0.10 NARVAL ⊙(1)
1435467 6169 130 3.95 0.21 −0.04 0.22 9.0 1.0 F8IV 6485 92 4.53 0.13 0.08 0.07 2.02 0.09 NARVAL ⊙(1)
2837475 6462 125 3.95 0.23 −0.06 0.21 18.3 1.0 F5IV-V — — — — — — — — ESPaDOnS ⊙(1)
3335176 3225 132 1.23 1.25 −0.22 0.21 9.3 2.5 M7II — — — — — — — — FIES PER(2)
3424541 6165 108 3.90 0.21 0.13 0.21 24.6 0.8 G0IV — — — — — — — — NARVAL ⊙(1) 3427720 5949 98 4.26 0.21 0.00 0.21 2.0 0.7 F9IV-V 6111 68 4.51 0.11 0.04 0.06 1.25 0.04 ESPaDOnS ⊙(1) 3430868 4969 101 2.91 0.23 −0.01 0.21 2.6 0.4 G8III 5208 67 3.24 0.12 0.13 0.06 1.46 0.03 ESPaDOnS 3443483 4856 93 3.05 0.21 0.04 0.21 11.1 0.2 K1IV 5043 82 3.43 0.18 0.09 0.06 1.63 0.06 FIES ⊙(1) 3456181 6290 111 3.94 0.21 −0.24 0.21 5.0 1.0 F5IV-V 6584 91 4.43 0.11 −0.02 0.07 2.01 0.11 NARVAL ⊙(1) 3632418 6148 111 3.94 0.21 −0.19 0.21 6.3 0.5 F6IV 6409 74 4.43 0.12 −0.03 0.06 1.86 0.06 NARVAL ⊙℘(1,3) 3643774 5928 96 4.26 0.22 0.17 0.21 1.4 1.4 G2IV 6125 75 4.39 0.12 0.25 0.06 1.39 0.05 HERMES ⊙(1) 3644223 4918 93 3.11 0.24 −0.22 0.21 2.8 0.8 G8III — — — — — — — — FRESCO ⊙(4) 3656476 5586 108 4.07 0.21 0.20 0.21 1.4 0.4 G5IV 5719 64 4.26 0.11 0.28 0.05 1.11 0.03 ESPaDOnS ⊙(1) 3733735 6548 156 3.99 0.22 −0.12 0.21 13.0 1.4 F5IV-V — — — — — — — — ESPaDOnS ⊙(1) 3747220 6668 147 4.18 0.21 0.00 0.21 50.8 12.4 F3V — — — — — — — — ESPaDOnS 4072740 4847 94 3.08 0.23 0.09 0.21 1.6 0.3 K1IV 4960 77 3.49 0.13 0.19 0.06 1.13 0.06 NARVAL ⊙(1) 4346201 6154 109 3.98 0.22 −0.25 0.21 2.8 1.0 F8V 6239 91 4.28 0.12 −0.17 0.07 1.64 0.10 HERMES ⊙(1) 4586099 6304 109 3.92 0.21 −0.20 0.21 2.3 0.7 F5IV-V 6533 80 4.37 0.11 −0.04 0.06 1.84 0.08 ESPaDOnS ⊙(1) 4638884 6286 123 3.91 0.21 −0.17 0.21 4.6 0.8 F5IV-V 6684 98 4.58 0.17 −0.05 0.08 3.39 0.28 NARVAL ⊙(1) 4859338 6013 131 4.09 0.23 0.19 0.21 34.3 1.5 G0IV — — — — — — — — HERMES ⊙(13) 4914923 5808 92 4.28 0.21 0.13 0.21 2.3 0.8 G1.5V 5948 65 4.34 0.12 0.18 0.05 1.26 0.03 ESPaDOnS ⊙(1) 4931363 7045 128 4.07 0.22 −0.05 0.21 65.9 8.0 F0III — — — — — — — — ESPaDOnS 4931390 6410 160 3.97 0.21 −0.25 0.21 3.2 1.2 F5IV-V 6862 80 4.55 0.11 −0.02 0.06 1.93 0.09 ESPaDOnS ⊙(1) 5021689 6141 107 3.94 0.21 −0.16 0.22 7.0 0.6 F8IV 6378 80 4.55 0.13 −0.02 0.06 1.90 0.08 ESPaDOnS ⊙(1) 5024851 4046 92 1.77 0.21 −0.18 0.21 1.9 0.7 K4III — — — — — — — — ESPaDOnS ⊙(5) 5080290 5157 169 3.60 0.35 −0.06 0.22 4.6 0.9 K0III-IV 5072 77 3.31 0.16 −0.10 0.07 0.69 0.07 HERMES δ Sct(6) ... 5261 182 4.21 0.26 0.01 0.23 6.1 0.5 K0III-IV 5064 78 3.28 0.13 −0.14 0.06 0.79 0.06 ESPaDOnS 5112786 4207 92 1.99 0.21 −0.17 0.21 2.5 0.9 K3III 4477 114 2.21 0.22 −0.13 0.07 1.83 0.08 ESPaDOnS 5184732 5669 97 4.07 0.21 0.24 0.21 2.8 0.3 G4V — — — — — — — — FRESCO ⊙(1) ... 5723 103 4.18 0.23 0.21 0.21 2.2 0.6 G4V 5894 68 4.31 0.12 0.43 0.06 1.18 0.03 ESPaDOnS∗ ... 5740 115 4.22 0.22 0.18 0.21 2.4 0.5 G1V 5877 68 4.34 0.11 0.40 0.06 1.14 0.03 NARVAL∗ 5199859 3722 133 1.63 0.35 −0.07 0.21 10.8 1.3 M0III — — — — — — — — FIES 5371516 6138 90 3.98 0.22 0.10 0.21 9.7 1.2 F8IV 6526 107 4.49 0.15 0.11 0.08 2.35 0.14 ESPaDOnS ⊙(1) 5450445 6099 99 4.13 0.21 0.05 0.21 5.4 0.6 F8V 6396 75 4.49 0.11 0.23 0.06 1.75 0.06 NARVAL ⊙(1) 5512589 5764 95 4.22 0.21 0.06 0.21 1.6 0.4 G3V 5812 66 4.05 0.11 0.12 0.06 1.20 0.03 NARVAL ⊙(1) 5557932 5936 100 4.37 0.21 0.00 0.21 13.7 0.3 G1.5V — — — — — — — — ESPaDOnS RS CVn(7) 5596656 5375 112 3.99 0.24 −0.18 0.21 3.8 0.4 G5IV 5188 69 3.75 0.13 −0.44 0.06 1.05 0.05 ESPaDOnS ⊙(1) 5620305 5190 148 3.49 0.32 −0.01 0.21 4.2 1.1 K0III-IV 5040 70 2.95 0.12 −0.01 0.06 0.51 0.05 HERMES 5701829 4927 104 3.19 0.22 −0.24 0.21 2.3 0.5 K0IV — — — — — — — — FRESCO ⊙(1) ... 4914 92 3.18 0.22 −0.13 0.21 2.4 0.7 K0IV 4962 69 3.39 0.13 −0.17 0.06 1.13 0.04 ESPaDOnS 5737655 5163 101 2.88 0.25 −0.44 0.21 3.8 0.6 G4III-IV 5121 63 2.83 0.10 −0.56 0.05 1.68 0.02 ESPaDOnS ⊙(1) 5773345 6007 112 4.17 0.21 0.13 0.21 3.4 1.1 G0.5IV 6399 71 4.36 0.11 0.30 0.06 1.92 0.05 ESPaDOnS ⊙(1)
2
J
.
M
o
le
n
d
a
-˙Za
ko
w
ic
z,
et
a
l.
Table 3.continuation.KIC Teff σ log g σ [Fe/H] σ v sin i σ MK Teff σ log g σ [Fe/H] σ ξt σ Instrument var
ROTFIT ARES+MOOG 5774694 5804 91 4.34 0.21 0.08 0.21 3.6 0.5 G2V 5923 65 4.56 0.10 0.10 0.05 1.17 0.03 ESPaDOnS∗ ⊙(1) ... 5801 98 4.34 0.21 0.06 0.21 3.6 0.6 G3V 5950 64 4.58 0.10 0.09 0.05 1.19 0.03 NARVAL∗ 5952403 5058 106 2.99 0.26 0.01 0.21 13.6 0.1 G8III — — — — — — — — FIES 5955122 5952 100 4.13 0.21 −0.05 0.22 4.5 0.6 F9IV-V 6092 69 4.26 0.12 −0.06 0.06 1.66 0.05 ESPaDOnS ⊙(1) 6116048 5991 124 4.09 0.22 −0.24 0.23 2.9 0.6 F9IV-V 6152 66 4.53 0.10 −0.14 0.05 1.36 0.04 ESPaDOnS ⊙(1) 6225718 6138 106 3.96 0.21 −0.23 0.22 2.4 0.5 F8V 6366 70 4.61 0.11 −0.07 0.06 1.50 0.05 NARVAL ⊙(1) 6285677 5849 97 4.32 0.22 0.06 0.22 7.6 1.0 G2V 6205 73 4.48 0.11 0.23 0.06 1.48 0.05 HERMES ... 5907 94 4.18 0.21 0.02 0.21 7.8 0.9 G0.5IV — — — — — — — — FRESCO 6370489 6241 116 3.98 0.21 −0.35 0.21 4.4 0.8 F8V — — — — — — — — FIES ⊙(1) 6442183 5736 96 4.26 0.21 −0.07 0.21 1.7 0.5 G1V 5738 62 4.14 0.10 −0.12 0.05 1.15 0.02 NARVAL ⊙(1) 6508366 6332 117 3.91 0.21 −0.07 0.21 18.0 1.0 F6IV — — — — — — — — ESPaDOnS ⊙(1) 6590668 4463 93 2.02 0.22 −0.22 0.21 4.0 1.1 K1III — — — — — — — — FRESCO 6603624 5471 128 4.02 0.23 0.17 0.21 1.4 0.7 G8IV-V 5718 78 4.44 0.13 0.28 0.06 1.16 0.06 ESPaDOnS ⊙(1) 6679371 6344 131 3.92 0.21 −0.10 0.21 11.0 1.0 F5IV-V — — — — — — — — NARVAL ⊙(1) 6766118 4892 93 2.73 0.21 0.05 0.21 2.7 0.6 K0III — — — — — — — — FRESCO 6933899 5837 97 4.21 0.22 0.04 0.21 2.0 0.6 G0.5IV 5921 65 4.12 0.11 0.04 0.06 1.29 0.03 NARVAL ⊙(1) 7103006 6180 120 3.92 0.21 −0.07 0.22 8.9 0.6 F8IV 6685 86 4.50 0.11 0.19 0.06 1.98 0.08 NARVAL ⊙(1) 7206837 6142 112 4.05 0.21 0.05 0.21 6.7 0.5 F8IV 6573 80 4.61 0.11 0.22 0.06 1.93 0.06 NARVAL ⊙(1) 7282890 6207 97 3.89 0.22 0.02 0.21 21.0 1.0 F6IV — — — — — — — — ESPaDOnS ⊙(1) 7510397 6120 97 3.94 0.21 −0.26 0.22 2.2 0.8 F6IV 6362 80 4.54 0.12 −0.08 0.06 1.66 0.07 ESPaDOnS ⊙(1) 7529180 6470 128 4.03 0.21 −0.06 0.21 27.0 1.7 F5IV-V — — — — — — — — NARVAL ⊙(1) 7662428 6143 97 4.03 0.21 0.10 0.21 9.3 0.8 F8V 6504 141 4.93 0.19 −0.09 0.10 1.58 0.22 ESPaDOnS ⊙(13) 7668623 6159 105 3.94 0.21 −0.10 0.23 7.6 0.7 F8IV 6580 112 4.56 0.15 0.03 0.08 2.54 0.21 ESPaDOnS ⊙(1) 7680114 5799 91 4.25 0.21 0.08 0.21 1.4 0.8 G0V 5955 68 4.41 0.11 0.12 0.06 1.30 0.04 NARVAL ⊙(1) 7730305 6060 104 4.25 0.22 0.09 0.21 12.6 1.1 F8V 6304 81 4.67 0.11 0.17 0.06 1.69 0.07 HERMES ... 6030 104 4.17 0.21 0.01 0.21 15.0 0.8 F8V — — — — — — — — FRESCO 7747078 5994 113 4.04 0.23 −0.19 0.23 3.8 0.8 F9IV-V 6114 78 4.37 0.12 −0.11 0.06 1.65 0.07 ESPaDOnS ⊙(1) 7799349 4954 92 3.33 0.22 0.14 0.21 1.1 0.4 K1IV 5175 84 3.81 0.15 0.24 0.07 1.31 0.07 NARVAL ⊙(1)
7799575 3941 92 1.69 0.21 −0.17 0.21 2.2 0.7 K5III — — — — — — — — ESPaDOnS Mira(8)
7800289 6398 133 3.96 0.21 −0.17 0.21 18.6 1.1 F5IV — — — — — — — — NARVAL ⊙(9) 7871531 5498 117 4.31 0.21 −0.12 0.21 2.2 0.8 G5V 5461 67 4.40 0.12 −0.26 0.06 0.87 0.05 ESPaDOnS ⊙(1) 7940546 6243 101 3.92 0.21 −0.25 0.21 6.6 0.8 F6IV 6427 82 4.52 0.12 −0.11 0.06 2.09 0.09 ESPaDOnS∗ ⊙(1) ... 6226 119 3.94 0.21 −0.24 0.21 7.0 0.7 F6IV 6472 84 4.59 0.12 −0.11 0.06 2.32 0.12 NARVAL∗ 7970740 5354 111 4.36 0.21 −0.31 0.21 2.4 0.5 G9V 5287 68 4.49 0.11 −0.52 0.05 0.59 0.08 ESPaDOnS ⊙(1) 7976303 6119 106 3.97 0.21 −0.38 0.21 3.1 0.5 F8V 6203 76 4.15 0.11 −0.41 0.06 1.62 0.07 ESPaDOnS ⊙(1) 7985370 5836 103 4.39 0.21 0.02 0.21 16.4 0.3 G1.5V — — — — — — — — HERMES PER(2) ... 5849 90 4.28 0.21 −0.10 0.21 17.3 0.4 G1.5V — — — — — — — — FRESCO rot/act(6,11) 8006161 5258 97 4.13 0.25 0.23 0.21 2.0 0.5 G8V 5431 82 4.45 0.13 0.30 0.06 0.95 0.10 ESPaDOnS∗ ⊙(1) ... 5211 101 4.05 0.24 0.20 0.21 1.9 0.3 G8V 5468 77 4.41 0.13 0.29 0.06 1.07 0.07 NARVAL∗ 8026226 6276 94 3.90 0.21 −0.20 0.21 7.4 0.5 F5IV-V 6469 78 4.32 0.13 −0.13 0.06 2.72 0.18 ESPaDOnS ⊙(9) 8179536 6160 112 3.98 0.21 −0.16 0.21 8.1 0.6 F6IV 6536 74 4.64 0.11 0.13 0.06 1.61 0.05 NARVAL ⊙(1)
A
tm
o
sp
h
er
ic
P
a
ra
m
et
er
s
o
f
1
6
9
F
,
G
,
K
a
n
d
M
-t
y
pe
S
ta
rs
in
th
e
K
ep
le
r
F
ie
ld
1
3
KIC Teff σ log g σ [Fe/H] σ v sin i σ MK Teff σ log g σ [Fe/H] σ ξt σ Instrument var
ROTFIT ARES+MOOG 8211551 4812 93 2.83 0.23 −0.12 0.21 1.9 0.5 G9III 4882 68 2.76 0.12 −0.15 0.06 1.54 0.03 ESPaDOnS∗ ... 4820 93 2.83 0.22 −0.10 0.21 2.0 0.3 G9III 4887 70 2.69 0.13 −0.17 0.06 1.56 0.03 NARVAL∗ 8228742 6061 108 4.02 0.22 −0.12 0.21 3.3 1.1 F9IV-V 6295 76 4.42 0.11 0.00 0.06 1.71 0.06 ESPaDOnS ⊙(1) 8343931 6506 125 4.09 0.22 −0.03 0.21 43.2 4.0 F5IV-V — — — — — — — — ESPaDOnS 8346342 6141 119 3.93 0.21 −0.05 0.22 6.9 0.8 F8IV 6573 139 4.59 0.12 0.21 0.10 1.87 0.15 ESPaDOnS 8352528 3972 89 1.69 0.21 −0.18 0.21 2.2 0.9 K5III — — — — — — — — ESPaDOnS 8360349 6176 91 3.92 0.21 0.07 0.21 10.6 0.7 F8IV 6762 156 4.92 0.15 0.07 0.10 3.45 0.37 ESPaDOnS ⊙(1) 8367710 6227 116 3.92 0.21 0.02 0.21 15.0 1.1 F6IV — — — — — — — — ESPaDOnS ⊙(1) 8379927 5998 108 4.25 0.21 −0.03 0.22 8.8 0.8 F9IV-V 6225 95 4.76 0.13 −0.23 0.07 2.01 0.13 ESPaDOnS∗ ⊙(1) ... 6000 112 4.12 0.22 −0.05 0.23 13.0 2.0 F9IV-V 6202 73 4.47 0.12 −0.20 0.06 0.95 0.05 NARVAL∗ 8394589 6111 116 3.98 0.21 −0.37 0.21 4.4 0.8 F8V 6231 75 4.54 0.11 −0.24 0.06 1.36 0.07 NARVAL ⊙(1) 8429280 5029 103 4.35 0.21 −0.04 0.21 34.8 0.6 K2V — — — — — — — — FRESCO rot/act(12) ... 5108 114 4.56 0.23 0.06 0.21 33.2 1.0 K1V — — — — — — — — HERMES 8491147 5007 95 2.92 0.24 −0.24 0.21 2.5 0.6 G8III 5065 65 2.75 0.12 −0.31 0.06 1.57 0.02 ESPaDOnS ⊙(4) 8524425 5671 105 4.17 0.22 0.12 0.21 1.1 0.5 G2.5V 5664 65 4.09 0.11 0.13 0.05 1.16 0.03 NARVAL ⊙(1) 8542853 5594 99 4.34 0.21 −0.09 0.21 2.1 0.6 G6V 5580 68 4.54 0.12 −0.20 0.06 0.85 0.06 ESPaDOnS 8547390 4732 90 2.80 0.21 −0.01 0.21 3.0 0.3 K0III 4870 74 2.86 0.15 0.12 0.06 1.60 0.04 ESPaDOnS ⊙(1) 8561221 5290 115 3.76 0.23 −0.04 0.21 1.9 0.6 G9.5IV 5352 68 3.80 0.11 −0.04 0.06 1.14 0.04 NARVAL ⊙(1) 8579578 6297 144 3.91 0.21 −0.06 0.21 19.3 1.0 F6IV — — — — — — — — NARVAL ⊙(1) 8677933 5946 161 3.92 0.29 0.15 0.22 49.6 0.7 G0IV — — — — — — — — ESPaDOnS ⊙(1) 8694723 6258 117 3.97 0.21 −0.42 0.21 4.6 1.0 G0IV 6445 80 4.55 0.11 −0.39 0.06 1.91 0.11 NARVAL ⊙(1) ... 6287 116 4.00 0.21 −0.38 0.22 3.8 0.7 G0IV 6489 85 4.50 0.13 −0.35 0.06 1.98 0.13 FIES 8702606 5621 106 4.08 0.21 0.00 0.21 0.7 0.7 G5IV-V 5578 62 3.89 0.10 −0.06 0.05 1.16 0.02 ESPaDOnS ⊙(1) 8738809 6039 104 4.19 0.21 0.07 0.21 2.2 0.9 G0.5IV 6207 68 4.17 0.11 0.12 0.06 1.65 0.03 NARVAL ⊙(1) 8751420 5281 115 3.86 0.24 −0.11 0.21 1.1 0.5 G8IV 5330 62 3.84 0.10 −0.14 0.05 1.07 0.02 NARVAL ⊙(1) 8760414 5850 166 3.94 0.26 −0.90 0.29 3.4 2.3 G0IV 5924 77 4.53 0.11 −1.00 0.06 1.38 0.11 NARVAL ⊙(1) 8816903 7063 142 4.12 0.21 −0.05 0.21 57.6 5.0 F0V — — — — — — — — ESPaDOnS 8831759 3877 107 1.66 0.24 −0.11 0.21 2.4 0.7 M1III 4920 209 3.94 0.34 −0.14 0.10 3.65 0.58 ESPaDOnS 8866102 6195 134 3.95 0.21 −0.16 0.21 11.0 0.8 F6IV — — — — — — — — ESPaDOnS ℘?(10) 8938364 5702 101 4.25 0.21 −0.16 0.22 2.0 0.9 G3V 5808 71 4.31 0.12 −0.10 0.06 1.10 0.05 NARVAL ⊙(1) 9025370 — — — — — — — — — — — — — — — — — ESPaDOnS ⊙SB2(1,14) 9098294 5766 96 4.27 0.21 −0.22 0.22 2.6 0.6 G3V 5959 80 4.56 0.12 −0.04 0.06 1.13 0.07 NARVAL ⊙(1) 9116461 6358 108 3.95 0.21 −0.14 0.21 14.1 0.6 F5IV-V — — — — — — — — ESPaDOnS ⊙(1) 9139151 6004 94 4.26 0.21 0.07 0.21 3.2 0.5 G0.5IV 6213 67 4.64 0.11 0.17 0.06 1.24 0.04 ESPaDOnS ⊙(1) 9139163 6175 123 3.99 0.22 0.00 0.21 2.0 1.0 F8IV 6577 69 4.44 0.10 0.21 0.06 1.68 0.04 ESPaDOnS∗ ⊙(1) ... 6151 128 3.98 0.21 −0.05 0.22 1.9 0.8 F8IV 6584 67 4.47 0.11 0.19 0.05 1.70 0.03 NARVAL∗ 9206432 6204 142 3.95 0.21 −0.02 0.22 1.7 1.2 F8IV 6772 73 4.61 0.11 0.28 0.06 1.92 0.05 ESPaDOnS ⊙(1) 9226926 6580 142 4.12 0.21 −0.15 0.22 30.8 3.0 F5V — — — — — — — — NARVAL ⊙(1) 9289275 5931 103 4.25 0.22 0.07 0.22 2.7 1.5 G0.5IV 6208 77 4.40 0.12 0.20 0.06 1.51 0.06 HERMES ⊙(1) 9414417 6242 104 3.92 0.21 −0.19 0.21 6.0 1.1 F6IV 6496 124 4.66 0.13 −0.07 0.09 2.55 0.26 HERMES ⊙℘?(1,10) 9512063 5882 112 4.14 0.22 −0.19 0.24 2.5 1.3 F9IV-V 5842 72 3.87 0.11 −0.15 0.06 1.12 0.04 HERMES ⊙(1) 9514879 5971 92 4.31 0.21 0.02 0.21 10.1 0.3 G1.5V 6190 79 4.70 0.12 0.12 0.06 1.60 0.07 FIES 9532030 4472 92 2.35 0.22 −0.11 0.21 3.6 0.5 G9III 4596 85 2.53 0.17 −0.06 0.06 1.74 0.06 ESPaDOnS
4
J
.
M
o
le
n
d
a
-˙Za
ko
w
ic
z,
et
a
l.
Table 3.continuation.KIC Teff σ log g σ [Fe/H] σ v sin i σ MK Teff σ log g σ [Fe/H] σ ξt σ Instrument var
ROTFIT ARES+MOOG 9534041 5061 96 3.10 0.23 0.02 0.21 3.2 0.6 G8III 5278 72 3.28 0.12 −0.01 0.06 1.49 0.04 ESPaDOnS ⊙(5) 9605196 4455 90 1.91 0.23 −0.20 0.21 3.5 0.8 K1III — — — — — — — — FRESCO 9655101 5039 129 3.02 0.26 0.00 0.21 3.5 0.7 G8III 5227 73 3.31 0.13 −0.02 0.06 1.53 0.04 ESPaDOnS ⊙(5) 9655167 5036 109 3.03 0.25 −0.01 0.21 4.5 0.5 G8III 5325 80 3.57 0.15 0.06 0.07 1.57 0.06 ESPaDOnS ⊙(5) 9693187 — — — — — — — — — — — — — — — — — ESPaDOnS ⊙SB2(1,15)
9700679 5176 158 3.37 0.32 0.04 0.22 3.7 0.9 G8III 5101 73 3.05 0.13 −0.08 0.06 1.01 0.04 HERMES hybrid(6)
9702369 5956 132 4.04 0.22 −0.11 0.23 5.1 1.4 F9IV-V 6441 78 4.54 0.11 0.14 0.06 1.39 0.05 HERMES ⊙(1) 9715099 6180 93 4.07 0.21 0.07 0.22 25.1 1.2 F6IV — — — — — — — — FRESCO ⊙(1) 9716090 5053 106 3.17 0.24 0.02 0.21 3.3 0.6 G8III 5297 74 3.41 0.12 −0.04 0.06 1.75 0.05 ESPaDOnS ⊙(5) 9716522 4860 92 2.82 0.21 −0.03 0.21 2.7 0.3 G9III 5126 73 3.10 0.12 0.05 0.06 1.67 0.04 ESPaDOnS ⊙(5) 9812850 6258 97 3.94 0.21 −0.22 0.21 9.8 0.7 F6IV 6790 118 4.92 0.13 −0.04 0.08 2.70 0.27 ESPaDOnS ⊙(1) 9908400 6068 106 3.95 0.22 0.17 0.21 17.9 0.9 G0IV — — — — — — — — NARVAL ⊙(1) 9955598 5264 95 4.29 0.22 −0.04 0.21 1.2 0.6 K0V 5380 68 4.33 0.12 0.04 0.06 0.80 0.06 NARVAL ⊙℘?(1,10) 9965715 6326 116 4.00 0.21 −0.30 0.21 8.2 0.7 F2V 6542 87 4.71 0.12 −0.22 0.06 1.84 0.10 ESPaDOnS 10001154 4391 96 2.17 0.22 −0.23 0.21 2.6 0.2 G9III 4585 82 2.34 0.16 −0.20 0.06 2.06 0.06 ESPaDOnS 10010623 6464 106 4.11 0.21 −0.01 0.21 31.8 2.1 F3V — — — — — — — — ESPaDOnS 10016239 6214 103 3.95 0.21 −0.17 0.21 10.7 1.0 F6IV — — — — — — — — NARVAL ⊙(1) 10018963 6145 112 3.95 0.21 −0.27 0.21 2.1 0.6 F6IV 6354 69 4.32 0.11 −0.16 0.05 1.79 0.05 NARVAL ⊙(1) 10068307 6144 109 3.94 0.21 −0.22 0.21 3.4 0.8 F6IV 6288 68 4.28 0.10 −0.11 0.06 1.68 0.04 ESPaDOnS ⊙(1) 10079226 5854 97 4.27 0.21 0.10 0.21 1.6 1.2 G0V 6045 68 4.49 0.11 0.17 0.06 1.17 0.04 HERMES ⊙(1) 10124866 5736 92 4.29 0.21 −0.31 0.21 3.0 0.6 G4V 5864 68 4.57 0.11 −0.24 0.06 1.03 0.05 ESPaDOnS ⊙(9) 10131030 4897 89 2.74 0.21 0.02 0.21 3.0 0.9 G8III — — — — — — — — FRESCO 10162436 6149 115 3.95 0.21 −0.16 0.22 2.8 0.8 F8IV 6423 71 4.43 0.11 0.01 0.06 1.75 0.05 ESPaDOnS ⊙(1) 10355856 6351 118 3.93 0.21 −0.22 0.21 4.5 0.8 F5IV-V 6612 79 4.38 0.11 −0.01 0.06 1.84 0.05 ESPaDOnS ⊙(1) 10388249 4743 92 2.87 0.22 0.00 0.21 10.6 0.2 K1IV 4978 98 3.48 0.19 0.14 0.07 1.87 0.09 FIES ⊙(1) 10454113 6129 151 4.07 0.22 −0.16 0.22 3.7 1.0 F9IV-V 6216 68 4.46 0.10 0.00 0.05 1.30 0.04 ESPaDOnS ⊙(1) 10462940 6026 101 4.24 0.21 0.05 0.21 1.9 0.7 G0.5IV 6268 68 4.48 0.10 0.18 0.05 1.35 0.03 NARVAL ⊙(1) 10516096 5928 95 4.24 0.21 −0.04 0.21 2.8 0.6 F9IV-V 6094 70 4.47 0.11 −0.03 0.06 1.39 0.05 ESPaDOnS ⊙(1) 10526137 3316 274 3.93 0.57 −0.23 0.21 13.4 1.6 M2V — — — — — — — — FIES APER(2) 10644253 5910 93 4.30 0.21 0.05 0.21 1.6 0.7 G0V 6132 65 4.54 0.11 0.15 0.05 1.21 0.03 ESPaDOnS ⊙(1) 10709834 6398 124 3.94 0.21 −0.20 0.21 7.0 1.2 F5IV-V — — — — — — — — NARVAL ⊙(1) 10735274 3836 202 1.72 0.36 −0.06 0.22 2.8 1.5 K5III — — — — — — — — HERMES ... 4033 99 1.69 0.23 −0.17 0.20 9.3 2.0 K4III — — — — — — — — FRESCO 10923629 6109 99 4.00 0.21 0.08 0.21 7.3 0.8 F8V — — — — — — — — NARVAL ⊙(1) 10963065 6097 130 4.00 0.21 −0.27 0.22 2.3 0.6 F8V 6236 64 4.55 0.11 −0.15 0.05 1.47 0.03 NARVAL ⊙℘?(1,10) 11018874 6454 121 4.08 0.21 −0.04 0.21 49.0 2.3 F5V — — — — — — — — ESPaDOnS 11026764 5771 97 4.22 0.21 0.10 0.21 2.6 0.9 G1V 5802 68 4.12 0.11 0.11 0.06 1.30 0.04 ESPaDOnS ⊙(1) 11037105 6801 132 4.20 0.22 −0.14 0.23 27.9 2.0 F2V — — — — — — — — ESPaDOnS 11081729 6400 127 3.97 0.21 −0.19 0.22 21.4 0.7 F5IV — — — — — — — — ESPaDOnS ⊙(1) 11099165 3930 90 1.69 0.21 −0.18 0.21 2.5 0.7 K5III — — — — — — — — ESPaDOnS 11137075 5576 99 4.14 0.22 −0.04 0.21 2.3 0.4 G5IV-V 5610 71 4.10 0.12 −0.06 0.06 1.10 0.04 NARVAL ⊙(1) 11244118 5605 104 4.05 0.23 0.19 0.21 1.7 0.5 G5IV 5770 67 4.14 0.11 0.35 0.06 1.19 0.03 NARVAL ⊙(1) 11253226 6410 125 3.96 0.21 −0.20 0.21 11.4 1.2 F5IV-V — — — — — — — — ESPaDOnS ⊙(1)