www.nature.com/scientificreports
Transcriptomics reveals multiple
resistance mechanisms against
cotton leaf curl disease in a
naturally immune cotton species,
Gossypium arboreum
Rubab Zahra Naqvi
1,2,3, Syed Shan-e-Ali Zaidi
1,2,3,8, Khalid Pervaiz Akhtar
4, Susan Strickler
3,
Melkamu Woldemariam
3, Bharat Mishra
5, M. Shahid Mukhtar
5, Brian E. Scheffler
6, Jodi A.
Scheffler
7, Georg Jander
3, Lukas A. Mueller
3, Muhammad Asif
1& Shahid Mansoor
1 Cotton leaf curl disease (CLCuD), caused by cotton leaf curl viruses (CLCuVs), is among the most devastating diseases in cotton. While the widely cultivated cotton species Gossypium hirsutum is generally susceptible, the diploid species G. arboreum is a natural source for resistance against CLCuD. However, the influence of CLCuD on the G. arboreum transcriptome and the interaction of CLCuD with G. arboreum remains to be elucidated. Here we have used an RNA-Seq based study to analyze differential gene expression in G. arboreum under CLCuD infestation. G. arboreum plants were infested by graft inoculation using a CLCuD infected scion of G. hirsutum. CLCuD infested asymptomatic and symptomatic plants were analyzed with RNA-seq using an Illumina HiSeq. 2500. Data analysis revealed 1062 differentially expressed genes (DEGs) in G. arboreum. We selected 17 genes for qPCR to validate RNA-Seq data. We identified several genes involved in disease resistance and pathogen defense. Furthermore, a weighted gene co-expression network was constructed from the RNA-Seq dataset that indicated 50 hub genes, most of which are involved in transport processes and might have a role in the defense response of G. arboreum against CLCuD. This fundamental study will improve the understanding of virus-host interaction and identification of important genes involved in G. arboreum tolerance against CLCuD.Cotton (Gossypium spp.) is a leading source of natural textile fiber, oil and protein meal, making it one of the most important cash crops in many countries1. The major cotton producing countries include China, India, United
States, and Pakistan which contribute more than 70% of the total cotton production around the globe (https:// apps.fas.usda.gov/). Among the 50 Gossypium species, two diploid species (G. herbaceum and G. arboreum) and two tetraploid species (G. hirsutum and G. barbadense) are cultivated worldwide, but G. hirsutum (upland cotton) accounts for more than 90% of overall cotton production2.
Tetraploid cotton, G. hirsutum, evolved about 1–1.5 million years ago (Mya) as a result of a polyploidization event with an A-genome species G. arboreum and a D-genome species G. raimondii the putative progenitors3. G.
hirsutum cultivars have superior lint yield and produce very high-quality fiber, however, these tetraploid cultivars
are often more susceptible to several abiotic and biotic stresses4,5. In contrast, diploid cotton species, particularly
1Agricultural Biotechnology Division, National Institute for Biotechnology and Genetic Engineering (NIBGE), Jhang Road, Faisalabad, Punjab, Pakistan. 2Pakistan Institute of Engineering & Applied Sciences (PIEAS), Nilore, Islamabad, Pakistan. 3Boyce Thompson Institute, 533 Tower Road, Cornell University, Ithaca, NY, USA. 4Nuclear Institute for Agriculture & Biology (NIAB), Jhang Road, Faisalabad, Punjab, Pakistan. 5Department of Biology, University of Alabama at Birmingham, Birmingham, AL, USA. 6Genomics and Bioinformatics Research Unit (USDA-ARS), Stoneville, MS, USA. 7Crop Genetics Research Unit, United States Department of Agriculture-Agricultural Research Service (USDA-ARS), Stoneville, MS, USA. 8Present address: AgroBioChem Department, Gembloux Agro-Bio Tech, University of Liège, 5030, Gembloux, Belgium. Rubab Zahra Naqvi and Syed Shan-e-Ali Zaidi contributed equally to this work. Correspondence and requests for materials should be addressed to S.M. (email: [email protected])
Received: 21 August 2017 Accepted: 3 November 2017 Published: xx xx xxxx
G. arboreum, are more tolerant to many biotic and abiotic stresses including CLCuD. G. arboreum is a valuable
source for novel genes to enhance genetic diversity as well as for specific traits6,7.
Bemisia tabaci, commonly known as silverleaf whitefly, is one of the sap sucking pests that causes damage to
more than 500 plant species including cotton. Among the list of sap-sucking insects that cause damage to a cotton crop, whitefly is responsible for more than 50% crop losses8. Whitefly serves as a vector for viruses causing cotton
leaf curl disease (CLCuD), which is a major threat to cotton crops in several countries including Pakistan and India9. Viruses causing CLCuD, collectively referred to as cotton leaf curl viruses (CLCuVs), belong to the family
Geminiviridae and the genus Begomovirus, which is the most important genera of this family9. Other members
of this genus also infect important crops including tomato, beans, chillies, cucurbits, mungbean and other vege-tables10–12. Plants infected with CLCuD show typical begomovirus infection symptoms such as leaf curling, vein
yellowing, leaf enations and stunted growth9,13. CLCuD is among the most devastating of viral diseases,
responsi-ble for serious crop losses annually that negatively impact a country’s economy14.
As their defense system, plants mobilize a variety of intrinsic mechanisms to deal with pathogens and it is nec-essary to understand the mechanisms that plants use to cope with different stresses at the genetic level15. Abiotic
and biotic stresses activate a relay network of plant gene expression mechanisms that lead to the reprogramming of a variety of physiological and metabolic processes in accordance with the stress response. Early studies mainly used model plant species to identify a wide spectrum of genes that are involved in different levels of metabolism, signal transduction, osmotic regulation and stress response. Microarray gene expression profiling has been widely used to study differential gene expression in plants under different stresses16,17. Advances in the field of
transcrip-tomics has made RNA-Sequencing (RNA-Seq) a major “-omics” technology for studying global gene expression of plants under different stress conditions18,19. Several RNA-Seq studies have been done to reveal mechanisms in
cotton under different biotic stresses. Transcriptome analysis of cotton flower buds infested with the cotton boll weevil highlighted the diversity of genes and pathways regulated by pest infestation, such as kinase cascades, tran-scription factors (TFs), and phytohormone-signaling pathways20. Significant changes in the expression of
tran-scripts were found to be associated with sugar and amino acid metabolism in cotton following aphid and whitefly infestation21. Another recent transcriptomic study reported several genes for control of phloem-feeding pests22.
Viral infection initiates a complex interaction between the virus and the host. Understanding host responses during viral infection can help in the development of effective strategies for virus control. In recent years, RNA-Seq studies have been applied extensively to uncover the responses of plant hosts to viral infection23–29.
However, the comprehensive molecular mechanisms underlying CLCuD-cotton interactions remain poorly defined.
Therefore, to elucidate the mechanisms involved in cotton defense against CLCuD, we aimed to identify important differentially expressed genes in cotton under CLCuD infestation and to elucidate the resistance mech-anisms of the naturally immune cotton species G. arboreum at a molecular level. We infested G. arboreum with CLCuD by grafting, then performed RNA-Seq followed by data analysis, weighted gene co-expression network analysis (WGCNA), gene ontology enrichment and functional annotation.
Results and Discussion
Cotton is an economically important crop and CLCuD causes drastic losses in crop production. Compared to normally susceptible tetraploid G. hirsutum, the diploid species G. arboreum is a natural source for resistance against CLCuD. Typically, whitefly is the vector that transmits CLCuD in tetraploid cotton, but G. arboreum remains unaffected when infected with viruliferous whiteflies. Recent studies have revealed evidence that G.
arboreum plants support CLCuD replication and its long-distance spread only if CLCuD is transmitted by graft
inoculation. In the presence of CLCuV/CLCuMBBur, mild symptoms of CLCuD have been shown to be induced in G. arboreum by its graft inoculation with scions from CLCuD infested G. hirsutum plants30,31. Interestingly,
only a few leaves of G. arboreum have been observed to develop symptoms of the disease following grafting. The nature of this resistance pattern remains unknown and might be correlated with gene expression levels or other indigenous immune mechanisms of G. arboreum30,32. The present study aims to detect changes G. arboreum gene
expression in response to CLCuD infestation by graft inoculation, even in the absence of severe symptoms. This study will help in understanding the mechanisms involved in resistance of G. arboreum to the begomoviruses causing CLCuD.
Grafting and transcriptome sequencing.
The standard method for CLCuD, delivery into G. hirsutum is by whitefly-mediated virus transmission. However, in most studies, G. arboreum remained asymptomatic and thought to be a non-host against CLCuD33. As an alternative, a graft infestation method was developed forsystemic delivery of the CLCuD complex (cotton leaf curl geminivirus with its associated betasatellite) into G.
arboreum30. In this study, we used the graft-infestation method for delivery of CLCuD complex to G. arboreum.
Characteristic viral infection symptoms were observed on G. arboreum grafted with CLCuD infected G. hirsutum scions (Fig. 1). Out of 30 plants grafted with scions, 27 plants established a successful graft. Among these 27 G.
arboreum plants, 20 plants showed characteristic symptoms of CLCuD on the leaves near the grafted scion, while
7 plants remained asymptomatic for CLCuD (Fig. 1). These results are comparable with previous observations where most of the graft-infested G. arboreum developed mild symptoms with a few plants remaining asympto-matic32. RNA was extracted from three biological replicates of graft-infested, symptomatic and asymptomatic G.
arboreum plants. This RNA was processed for library preparation followed by RNA sequencing.
RNA-Seq data analysis.
All six libraries were sequenced using a HiSeq™
2500 platform. On average, 10 million total reads were obtained from each replicate (Table 1). Quality of individual sequences was evaluated using FastQC analysis, including per base sequence quality analysis which plots the Phred quality score distri-bution on the y axis for each read generated per sample and for each nucleotide base call plotted on the x axiswww.nature.com/scientificreports/
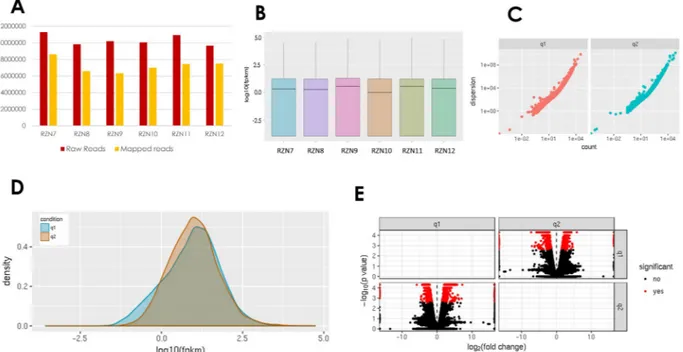
(Figure S1). All FASTQ sequencing files obtained in this study have an average per base Phred score of 64, a con-ventional threshold denoting high quality base calls. High quality sequence reads were aligned to the G. arboreum reference genome with 13 chromosomes and 41,330 gene models (Table S1). The percentage of mapped reads obtained from the alignment summary of HISAT2 is provided in Table 1 (Fig. 2A).
Differential gene expression was quantified and grafted CLCuD symptomatic G. arboreum (RZN7-RZN9) were compared to the grafted asymptomatic G. arboreum (RZN10-RZN12). To assess the biological reproducibil-ity of the experiment, each sample was treated as an individual biological replicate using the cuffdiff package of Figure 1. Experimental design, methodology and RNA-Seq pipeline used in study. Panel A and B show the graphical representation of grafting experiments (A) scion of cotton leaf curl disease (CLCuD) infected
Gossypium hirsutum was used on a rootstock of G arboreum; asymptomatic leaves of CLCuD were collected for
RNA extraction and sequencing. (B) Leaves showing symptoms of CLCuD were collected for RNA extraction and sequencing. (C) Shows an asymptomatic CLCuD free leaf of G. arboreum. (D) Shows a leaf with very mild symptoms of CLCuD including vein swelling and darkening, highlighted with black arrows. (E) Shows the workflow of the RNA-Seq experiment and the tools used at each step.
Cufflinks34. We compared individual runs from each condition and calculated the transcript abundances of each
independent run (Fig. 2B). A quality check of compared transcripts provided standard gene density and disper-sion (Fig. 2C,D). The expression levels of mapped genes were normalized with a FPKM (fragments per kilobase of exon per million fragments mapped) value. To confirm the quality of RNA-Seq, the eight highest-ranking housekeeping control genes in G. arboreum were selected to evaluate gene expression35. Based on comparisons
of our samples, none of these reference genes were significantly differentially expressed (Table 2), suggesting that the sequences obtained and the transcript expression levels qualified for further transcriptome analysis. In the comparison of gene expression levels of symptomatic and asymptomatic G. arboreum plants, an absolute value of log2 fold change >1 and the False Discovery Rate (FDR) <0.05 was set to declare differentially expressed genes (DEGs) involved in the response of CLCuD infestation. Overall, 1062 genes were differentially expressed in this comparison, out of which 563 and 499 were up and downregulated, respectively (Fig. 2E; Fig. 3).
The transcriptome data of all replicates from this experiment is publicly available under BioProject accession number PRJNA380937 and a comprehensive list of up- and downregulated DEGs is provided in Table S2. This data is a valuable resource for understanding CLCuD tolerance in G. arboreum. Furthermore, the DEGs identified were narrowed down by log2 fold-change, p values and q values for further experimentation. Many functional classes of genes related to pathogen defense were found to be significantly affected in CLCuD-infected sympto-matic plants compared to that of the asymptosympto-matic plants.
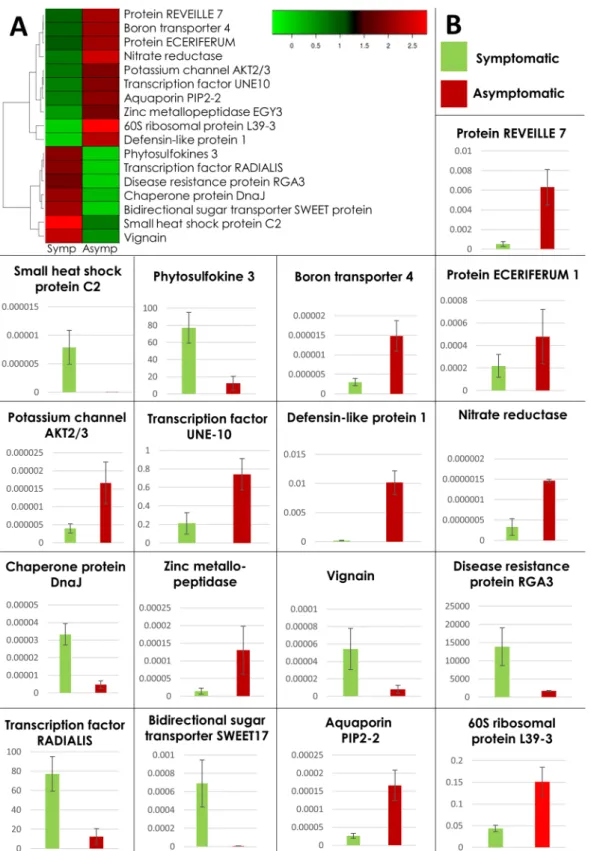
For the validation of our transcriptomic data we selected 17 significant DEGs with a probable role in dis-ease resistance. We designed primers and performed qPCR on cDNA of independent biological replicates of G.
arboreum. Our qPCR data strongly correlated with the RNA-Seq expression data (Fig. 4). The implication of these genes has been discussed with reference to published data (Supplementary Discussion; Table 3).
Putative defense related genes involved in resistance of G. arboreum to CLCuD
infec-tion.
Plants have evolved with sophisticated and well-established defense mechanisms to cope with patho-gens, such as insects, fungi, bacteria and viruses36. Besides physical barriers (like trichomes), toxic compounds orsecondary metabolites, plants have numerous defense pathways to defend themselves against diverse pathogens37.
An initial gene ontology (GO) term analysis of the top one hundred most significantly expressed genes present in the RNA-Seq dataset indicated that several GO terms were involved in regulation of responses related to stress, external stimulus, biotic stress and plant defense (Figure S2).
Further dissection of expression levels of individual genes in symptomatic and asymptomatic G. arboreum plants revealed that many groups of genes were differentially expressed in response to CLCuD infection.
Differential expression of membrane transporters and channel proteins.
Among the DEGs, some transporter genes were observed such as a boron transporter gene that was upregulated while a SWEET 17 gene was downregulated in G. arboreum asymptomatic plants. An interaction of host boron transporter with viral coat protein can regulate boron transport to induce necrosis, or the interaction can modulate an R gene mediated defense response38. Based on these studies, the upregulation of the boron transporter gene in G. arboreum depictsthe protection of the plant from boron toxicity. In G. arboreum, the boron transporter may also be involved in host-viral interaction which modulates the R-gene mediated response in the host to combat virus infection. SWEETs are bidirectional vacuolar fructose transporters in plants predicted to be involved in maintaining sugar homeostasis in plant organs during favorable as well as abiotic and biotic stress conditions. SWEET transporters have been found to be associated with plant pathogen interactions during a pathogen attack in plants39. A reduced
level of SWEET gene expression in tobacco and rice was associated with enhanced resistance to pathogens, sug-gesting a role in pathogen growth and plant disease resistance39,40. The downregulation of G. arboreum SWEET
transporter suggests its role in sugar homeostasis under unfavorable conditions and possible involvement in reduced pathogen growth and disease resistance.
Alteration in expression levels of channel proteins in plants has been reported as a response to environmen-tal stimuli41. Significantly enhanced soybean mosaic virus resistance was observed in soybean by the
overex-pression of GmAKT242. The induction of aquaporin channel proteins encoding genes has been reported with
expression profiling of soybean under Pseudomonas syringae infection43. Studies have also shown the involvement
of aquaporins in plant-viral interactions. For example, aquaporin genes interact with a cucumber mosaic virus (CMV) replication protein that potentially affects CMV replication in the host plant44. Thus, the upregulation of
G. arboreum AKT2 and aquaporin genes might have a role in CLCuD.
Transcription factors and R-gene mediated response.
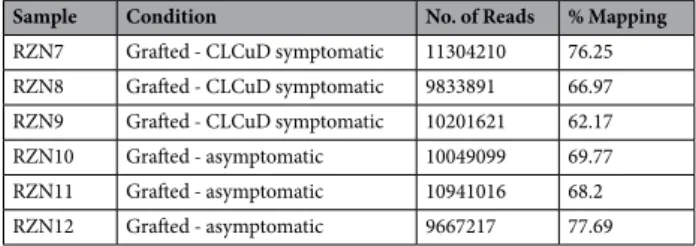
During pathogen attack, transcription factors play an important role in plant innate immunity. MYB transcription factors act as master regulators of cellularSample Condition No. of Reads % Mapping
RZN7 Grafted - CLCuD symptomatic 11304210 76.25 RZN8 Grafted - CLCuD symptomatic 9833891 66.97 RZN9 Grafted - CLCuD symptomatic 10201621 62.17 RZN10 Grafted - asymptomatic 10049099 69.77 RZN11 Grafted - asymptomatic 10941016 68.2 RZN12 Grafted - asymptomatic 9667217 77.69 Table 1. Summary of RNA-Seq runs used in this study.
www.nature.com/scientificreports/
responses and are involved in plant development, secondary metabolism, hormone signal transduction, abiotic stress tolerance and disease resistance. These transcription factors have been found to be involved in mechanisms of disease resistance in several plants through regulation of defense genes45. In the present data set,
differen-tial gene expression of different MYB transcription factors, including RADIALIS and REVEILLE, indicate their role in plant defense against CLCuD. A recent study on genome-wide analysis of bHLH transcription factors in
Solanum lycopersicum shows that bHLH transcription factors are involved in the plant’s defense under infection
by Tomato yellow leaf curl virus and upregulation of bHLH is associated with disease resistance46. G. arboreum
bHLH transcription factor UNE10 was upregulated during CLCuD stress and suggests a role in disease resistance. Transcription factors, particularly ethylene response factor (ERF), lead to the transcriptional regulation of several jasmonate and ethylene responsive defense genes under pathogen attack47. In our experiment, seven DEGS were
found to be ethylene responsive genes (Table S5) that might have a role in G. arboreum defense against CLCuD. R gene-triggered resistance in plants is associated with a rapid defense response known as hypersensitive response (HR) that can bring localized cell death at the site of infection and trigger a series of downstream defense pathways48. R-genes have been found to be induced in response to several pathogens and diseases in
plants, including tobacco mosaic virus, rice blast, Arabidopsis downy mildew, tomato leaf mold and Verticillium wilt-resistance in cotton49. In our experiment, eleven putative R genes were differentially expressed indicating
their role in plant defense against CLCuD (Table S6). Protein kinases along with R genes are well known in disease resistance both in a positive and a negative manner50,51. Forty-six kinase genes were identified as DEGs and most
of them were downregulated in asymptomatic G. arboreum (Table S7).
Figure 2. RNA-Seq data quality check and efficiency of mapping with G. arboreum genome. Panel A shows the raw sequencing reads compared the mapped reads where the y axis indicates the number of reads and x axis indicates the samples used in study. Panel B, C, D and E show the amount of data among replicates in terms of log10_(FPKM), gene dispersion, density and differentially expressed transcripts in the dataset. q1 and q2 represent the two conditions of symptomatic and asymptomatic G. arboreum respectively.
No Function Gene_Id log2FC significant
1 Clathrin adaptor complexes medium subunit family protein Cotton_A_09164_BGI-A2_v1.0 −0.363142 no 2 Catalytic subunit of protein phosphatase 2 A Cotton_A_09192_BGI-A2_v1.0 0.619919 no 3 F-box family Cotton_A_12507_BGI-A2_v1.0 0.510816 no 4 Betatubulin Cotton_A_14308_BGI-A2_v1.0 −0.7817 no 5 Elongation factor Cotton_A_23419_BGI-A2_v1.0 −0.452078 no 6 Glyceraldehyde-3-phosphate dehydrogenase C-2 Cotton_A_31637_BGI-A2_v1.0 −0.539749 no 7 Ubiquitin Cotton_A_32873_BGI-A2_v1.0 0.0623818 no 8 Actin Cotton_A_38366_BGI-A2_v1.0 −0.395614 no Table 2. Expression levels of housekeeping control genes in G. arboretum.
Phytohormone signaling.
CLCuD infestation in G. arboreum also revealed the induced expression of genes associated with phytohormone signaling pathways. Phytohormones are the key players in signaling cas-cades induced by pathogens20. In this study auxin, cytokinin, abscisic acid and brassinosteroid related genes wereupregulated while genes involved in ethylene and salicylic acid pathways were downregulated, highlighting their role in plant defense. Taken together the complex cascade in phytohormone related gene expression demonstrates the interconnection of the signaling pathways regulated by phytohormones in response to CLCuD infection. Figure 3. Hierarchical clustering of differentially expressed genes. A heat map of G. arboreum differentially expressed genes in response to cotton leaf curl disease with respect to hierarchical clustering. Log10 expression values were used for the analysis and negative values were set to zero. Clustering and the heat map were performed using heatmap 2.0 package in R.
www.nature.com/scientificreports/
Figure 4. Validation of gene expression with quantitative RT-PCR. (A) Heat map of 17 selected DEGs for qRT-PCR in G. arboreum in response to cotton leaf curl disease with respect to hierarchical clustering. Log10 expression values were used for the analysis and negative values were set to zero. Clustering and the heat map were performed using heatmap 2.0 package in R. (B) Quantitative RT-PCR was used to measure the relative expression levels of seventeen pathogen resistance related genes with 18 S as an internal reference. Values were expressed as fold changes of transcript levels in the CLCuD infested symptomatic leaf samples with respect to the transcript levels in CLCuD infested asymptomatic leaf samples. Error bars represented standard error (SE) of three biological replicates.
Protein processing in endoplasmic reticulum and ubiquitin proteasome systems are involved
in plant-viral interaction.
Under virus infection, the plant’s cellular machinery is hijacked by viruses for DNA replication of viral genomes and translation of viral proteins. Like other pathogens including bacteria, phytopathogenic viruses activate endoplasmic reticulum (ER) stress signaling machinery. Viruses act as “pirates” and use host machinery for their spread across the plasmodesmata to neighboring cells using viral movement proteins (MP). The ER signaling mechanism has been found to be involved in cell to cell movement and spread of viruses through plasmodesmata52. In Arabidopsis, a broad range of viruses induce gene expression of ER stressmarker genes such as Calreticulins (CRTs). Calreticulin has been shown to interact with movement of viral pro-teins including MP of tobacco mosaic and turnip crinkle virus (TCV). CRT helps in redirecting virus movement through plasmodesmata which leads to symptom development, however, its overexpression leads to delayed cell to cell movement of virus53. Many other well studied host proteins interact with viral MPs for regulation of their
cell to cell movement including β−1,3-glucanase-interacting proteins54. DnaJ and heat shock chaperones act
as potential translocation factors and are involved in regulation of viral cell-to-cell movement55. Deposition of
β−1,3-glucan or callose in plasmodesmata initiates a hypersensitivity response (HR) in hosts, consequently lead-ing to the blocklead-ing of plasmodesmata to hinder cell to cell viral movement. Viral proteins like the TGB2 protein of
Potato Virus X (PVX) interacts with the host ß−1,3-glucanase to degrade the callose, followed by PVX movement
through the plasmodesmata54. DnaJ (HSP 40) is an important co-chaperon of HSP70 and is important for its
function56. HSP70 is proposed to be associated with coat protein interaction, viral transportation and replication
of many geminiviruses. Downregulation of HSP70 showed decreased viral load and reduced viral movement in plants infected with tomato yellow leaf curl virus (TYLCV)57.
In G. arboreum symptomatic plants, the induction of many genes involved in protein processing in ER includ-ing CRT, lectin like gene OS9, glucanase interactinclud-ing gene OST and heat shock proteins HSP70 and HSP 40 indi-cate the possible role of this pathway interacting with CLCuV proteins and helping viral cell to cell movement in the plant, making it susceptible to establishment of mild symptoms from graft inoculation with CLCuD. The downregulation of these genes in asymptomatic plants might have role in impairment of viral movement proteins, restricting viral movement in plasmodesmata (Figure S3).
The ubiquitin proteasome system (UPS) has a very important role in virus host interactions and plant defense against viruses58,59. There are several reports showing the complex interaction of host plant UPS components
with viral proteins, suggesting that the ubiquitin pathway is probably a conserved pathway involved in plant virus interaction. UPS in plants is comprised of ubiquitin-activating enzyme (E1), ubiquitin-conjugating enzyme (E2), and ubiquitin-ligase (E3). These three enzymes make an E3 ubiquitin ligase complex which is required for poly-ubiquitination of cellular proteins, followed by 26 S proteasome targeted degradation60. During viral infection, the
virus takes over the plant host’s UPS machinery regulating its gene expression to enhance pathogenesis, while in parallel the plant uses UPS as a strong layer of defense, mainly by targeting of viral proteins. Different components of UPS, from ubiquitin to 26 S proteasome have been found to be involved in plant defense mechanisms. Host UPS machinery is involved in targeted degradation of TMV and Turnip yellow mosaic virus movement proteins and decreased viral pathogenesis suggest a role for UPS in plant antiviral defense59.
Like other plant viruses, geminiviruses also interact with the different components of host UPS. Rep, a rep-lication protein of geminiviruses, interacts with host plant SUMO-conjugating enzyme 1 (SCE1), which is an essential host factor for viral infection in the plant61. Altered expression of SCE1 leads to unsuccessful
gemi-niviral replication and suppression of infection62. SKP1 is another potent component of the CUL1-based SCF
Gene Probable role in defense References
Probable zinc metallopeptidase EGY3 Development and stress response 94
Defensin-like protein 1 Bacterial and fungal pathogens as well as herbivorous insects 95–97
Phytosulfokines 3 Pattern-triggered immunity against pathogens, Leucine Rich Repeat family (LRR) 98–100
Chaperone protein DnaJ Pathogen defense, antiviral defense 101–103
Transcription factor UNE10 Antiviral defense 46
Protein REVEILLE 7 Plant growth, stress, pathogen response 104,105
Small heat shock protein C2 Antiviral and antibacterial stress response 59,106
Transcription factor RADIALIS Myb encoding genes, plant defense response 45,107
Putative disease resistance protein RGA3 R-gene mediated pathogen and disease response 49,108,109
Bidirectional sugar transporter SWEET17 Abiotic stress tolerance, pathogenesis related protein 39
Protein ECERIFERUM 1 Biotic and abiotic stresses 110
Probable aquaporin PIP2-2 Biotic and abiotic stresses, plant immunity 111–113
Potassium channel AKT2/3 Plant development, stress responses, antiviral defense 41,42
60 S ribosomal protein L39-3 Pathogen and disease resistance, antiviral defense 7,114,115
Boron transporter 4 R-gene mediated viral defense 38
Vignain Plant immunity, pathogenesis and plant defense 116,117
Nitrate reductase [NADH] Pathogen signal-induced NO production 118–120
Table 3. Selected differentially expressed genes for qRT-PCR and their probable functions in plant pathogen defense.
www.nature.com/scientificreports/
ubiquitin E3 ligases that recruits proteins for polyubiquitination. Geminiviral C2 protein interferes with the dif-ferent components of host UPS including SKP159,63. Suppression of SKP1 in plants abolishes the downstream HR
and resistance response in plants60. βC1 from Cotton leaf curl Multan virus (CLCuMV) interacts with the host
ubiquitin-conjugating (UBC) enzyme, SlUBC3, leading to symptom induction that is possibly due to downregu-lation of the UPS64. The upregulation of UPS pathway components including UBC3 (COP1), SCE1(UBE21) and
SKP1 in the G. arboreum asymptomatic plants indicates that ubiquitin mediated proteolysis could be a defense response against symptom development of CLCuD (Figure S4).
Weighted co-expression gene network analysis (WGCNA) identifies two novel modules within
the network.
With the availability of large-scale transcriptome datasets, co-expression network analysis allows identification of a cohort of genes with similar expression patterns in response to a given stimulus or phys-iological condition within a cell65,66. Thus, co-expression networks can identify a set of genes, which mightpartici-pate in a common biological process. To determine CLCuD-responsive common gene signatures, we performed a weighted gene co-expression network analysis67,68 on 468 selected DEGs. Using the WGCNA platform, we created
a topological overlap mapping metric (TOM) plot, a measure of neighborhood proximity that calculates the sim-ilarity matrix of gene expression between two nodes69. TOM also features hierarchical clustering dendrograms
possessing a range of weighted correlations67. These analyses led us to generate an undirected weighted network
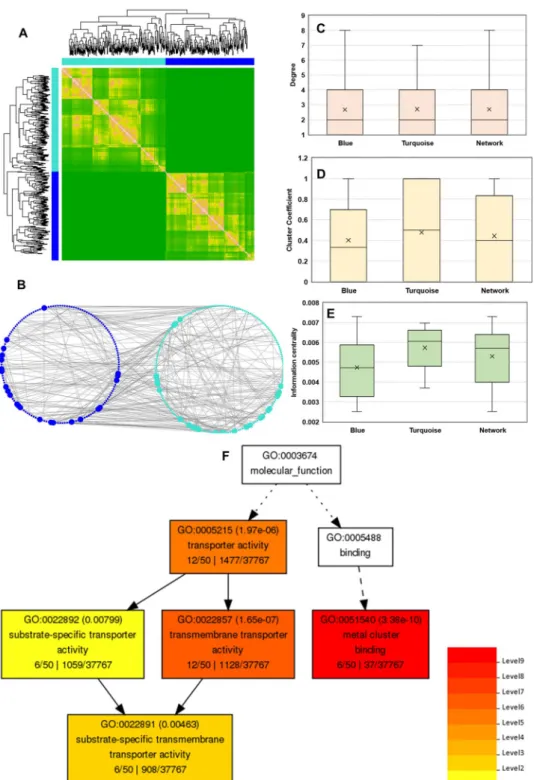
with scale-free topology, a network with power-law degree distribution. This weighted co-expression network encompasses two different modules (Fig. 5A,B; Table S8) that are denoted with two different colors. The turquoise and blue modules comprise of 252 and 216 genes, respectively.
Centrality measures can reveal the most influential vertices in a network. To decipher the most important nodes within this co-expression network, we calculated, degree (number of connections of a node) and clustering coefficients (degree to which a node is connected in a neighborhood) as well as information centrality (the flow of information between any two nodes in a connected network)66,70,71. Degree distribution revealed a total of 50
hubs, nodes with ≥ 5 connections within the co-expression network (Fig. 5B; Table S8).
Out of these identified hub genes, co-expression network upregulated hub genes included Aquaporin TIP4-1, Nitrate/peptide (NRT1/ PTR) transporter, Ammonium transporter 1 member, vacuolar calcium ion transporter, CDGSH iron-sulfur cluster binding protein, 3-isopropylmalate dehydratase and nitrite reductase, while downreg-ulated genes included sugar transport protein 13, NAT3 (Nucleobase-ascorbate transporter 3 ion symporter) and zinc transporter genes. GO term analysis of these hub genes revealed their involvement in transport processes. Plants use a wide array of chemicals as weapons for their defense against pathogens. These chemicals or com-pounds can accumulate at high levels in the infected or attacked tissue72. Proteins involved in transport processes
are vital for long distance transport of these defense compounds to the other tissues and for plant sustainability under viral attack73. The differentially expressed transporters identified here might have a role in transport of
secondary metabolites and defense related compounds that further activate other mechanisms involved in plant defense responses under viral attack.
Moreover, we determined that the average degree of turquoise and blue modules was constant. We did not observe any change in the degree for blue and turquoise modules compared to the entire co-expression network or blue module. Intriguingly, we also found that the turquoise module exhibited a significantly heightened aver-age clustering coefficient (Fig. 5C,D). Finally, our information centrality measure in the largest component with 92 nodes determined that the turquoise module displayed significantly increased information centrality com-pared to the entire network (Fig. 5E; Table S9). These data suggest that nodes in the network may transmit the information via DEGs faster.
Oxidative stress related genes under CLCuD infection.
Light has a major role in photosynthesis and meeting energy demands of the plant under pathogen attack. It provides energy as well as elicits protection to plants against invading microbes74. We found GO enrichment of light and radiation based gene expression undera module after co-expression network analysis (Figure S5). Under plant microbe attack, one protective strategy in plants is to produce reactive oxygen species (ROS)75. Nicotinamide adenine dinucleotide (reduced form NADH)
and cytochrome oxidase (COX) enzymes are involved in synthesis of glutathione S-transferase a major scavenger of ROS. However, another mechanism involved in generation of ROS under biotic stress includes light dependent ROS production from chloroplasts74. Therefore, upregulation of COX1, COX3, NADH and genes related to light
response in asymptomatic G. arboreum plants suggests modulation of gene regulation to combat CLCuD by ROS scavenging.
Role of primary metabolic pathways in plant immunity.
Cellular energy demands have been found to be increased under pathogen attacks in plants. Primary metabolic pathways along with secondary metabolic processes support these increased requirements of the plants. Secondary metabolites including terpenes and phenolics are required by plants for protection against microbial pathogens. However, plant secondary meta-bolic pathways create a large carbon flux by influencing and reconfiguring the primary metabolism for resistance responses76,77. We identified upregulation of genes related to the metabolic pathway specifically involved inster-oid and lipid metabolism in asymptomatic plants (Figure S6). These genes include flavonster-oids, brassinosterster-oid, sphingolipids and terpenoids, suggesting a role in the defense response to CLCuD. Carbohydrates or sugars act as a fuel to boost energy levels in plants during plant microbe interaction. These are studied as potent players in coordinated plant metabolism with development as well as dealing with different stress responses78. The concept
of “sweet immunity” has been established based on their importance in plant immunity. In the present dataset, several genes involved in carbohydrate or saccharide metabolism were found to be highly expressed including phosphoenolpyruvate carboxykinase, fructose-1 6-bisphosphatase and phosphoglucomutase (Figure S6). We detected several genes related to cation or meta ion channel activity by WGCNA (Figure S6). Ca2 + signaling
Figure 5. Weighted gene co-expression network construction and analysis for CLCuD-responsive cotton genes in CLCuD symptomatic and asymptomatic leaves. (A) Transcriptomic data from symptomatic and asymptomatic leaves was analyzed by WGCNA using 468 DEGs. Genes were clustered as per expression arrangements characterized by the dendrogram and topological overlap mapping metric (TOM) heat map. Each line of the dendrogram corresponds to a gene. Clusters of similarly-regulated genes are grouped as modules by corresponding color (blue and turquoise) with a threshold minimum module size of 70 genes. The intensity of pink coloring in heatmap specifies high strength and green as no strength of correlation between pairs of genes on a direct scale and features hierarchical clustering dendrograms possessing a range of weighted correlations. (B) Weighted network illustrates correlations (edges) among the nodes (genes) with a weighted correlation threshold of ≥0.85. The network is composed of 468 connections and 348 genes organized in two different modules. The node color corresponds to modules identified via WGCNA. Nodes with high connectivity ( ≥5 connections, hubs) among different modules are indicated with increased node size. (C) Highly connected nodes (hubs) within the co-expression network are shown. Average degree of turquoise and blue modules is not changed in the entire co-expression network (2.689655172). (D) Clustering coefficient (degree to which a node is connected in a neighborhood) for genes within each node is illustrated in a box plot. Turquoise module
www.nature.com/scientificreports/
related genes, including calmodulins (CaCML) and cyclic nucleotide-gated ion channels (CNGs), were elevated with significantly higher expression levels during CLCuV infection. The upregulation of these ion channels is correlated with the previous studies where cytosolic Ca2 + levels have been observed to be triggered under path-ogen infection. Furthermore, Ca2 + acts as second messenger that induces defense related signaling pathways79,80.
In the blue module, we identified upregulated genes in asymptomatic plants related to metabolic pathways spe-cifically involved in steroid and lipid metabolism (Figure S5). These genes encode flavonoids, brassinosteroids, sphingolipids and terpenoids, known to play a role in defense response.
In this study, we extended the fundamental understanding of G. arboreum’s response to CLCuD infection.
G. arboreum’s natural resistance to CLCuD may involve a complicated gene network, which starts with a basal
response and production of general pathogen-associated molecular pattern molecules, followed by activation of CLCuD defense response signaling cascades leading to the transport of defense compounds to other plant tissues and all these interconnected layers of responses ultimately cause immunity to CLCuD in G. arboreum. The transcriptomic data provided here is a valuable resource to further characterize candidate genes that are responsive to CLCuD infection and involved in the resistance gene network; these genes can be used in future breeding programs using new breeding techniques like CRISPR to engineer resistance against geminiviruses81–83.
Consequently, this study will help the scientific community to better understand the mechanisms of G. arboreum resistance against CLCuD.
Materials and Methods
Plant growth and virus inoculation by grafting.
Plants of G. arboreum, variety Ravi, were grown in an insect-free glasshouse. G. hirsutum, variety CIM 496, plants were maintained in a separate glasshouse and were inoculated with CLCuD by allowing viruliferous whiteflies to feed on these plants. Severely CLCuD infected CIM496 branches were then used as scions to graft on Ravi plants. G. arboreum plants were grafted using a “bottle shoot” grafting method30,32. In this technique, a graft-scion is placed in a tube filled with distilled water tosup-port plant growth at the higher temperatures maintained for this experiment (Fig. 1). The water in the tube was refreshed daily till the graft union between root stock and scion was established. The tube of water was removed at day 9 after grafting. The temperature of the glasshouse was maintained between 38–45 °C for day time and 25–30 °C for night time. The leaf tissue was collected from CLCuD symptomatic and asymptomatic plants at day 25 post graft infestation. Three biological replicates were processed independently.
RNA extraction.
Total RNA was extracted from CLCuD infested symptomatic and asymptomatic leaves using TRIzol reagent according to the manufacturer’s instructions (Invitrogen, Carlsbad, CA, USA). Three bio-logical replicates from each sample were used for this experiment. The quality and quantity of RNA were assessed by electrophoresis on 1% agarose gels and by a NanoDrop 1000 spectrophotometer (Thermo Fisher Scientific, USA). The integrity of RNA samples was examined using Bio-analyzer 2100 equipment (Agilent Technologies, Germany).Library construction and RNA sequencing.
The extracted total RNA samples with a concentration of 10 µg were used for cDNA synthesis and strand specific RNA-Seq libraries were constructed as described earlier84.Poly (A) mRNA was isolated using oligo-dT beads (Qiagen, Hilden, Germany). The mRNA was broken into short fragments (~300 nt). First-strand cDNA was synthesized using random hexamer-primed reverse transcription. Second-strand cDNA was generated using RNase H and DNA polymerase I. The cDNA fragments were purified and washed for end repair and ligated to sequencing adapters. The cDNA fragments of suitable size were purified and enriched by PCR to obtain the final cDNA library. The integrity of each cDNA library was examined using Bio-analyzer 2100 equipment (Agilent Technologies, Germany). The cDNA libraries were then sequenced using single-end mode of HiSeq
™
2500 equipment (Illumina, San Diego, CA, USA).RNA-Seq data analysis.
Clean reads were selected after preprocessing with Trimmomatic85 to removelow-quality sequences (i.e. reads containing adaptor sequences, and reads with more than 5% unknown bases). After preprocessing the RNA-Seq data, the quality of reads was checked by FastQC86. The cleaned reads were
then mapped to the reference G. arboreum genome87 using HISAT2-build and HISAT2 aligner88. Default HISAT2
parameters, which allow up to two mismatches and report up to 20 alignments for reads mapping at multiple positions, were used. The sequence alignment/map files generated by HISAT2 were used as the input to the soft-ware Cufflinks34 which assembles the alignments in the sequence alignment/map file into transfrags. Cufflinks
does this assembly independently of the existing gene annotations and constructs a minimum set of transcripts that best describes the RNA-Seq reads. The unit of measurement used by Cufflinks to estimate transcript abun-dance is FPKM (Fragments Per Kilobase of transcript per Million mapped reads). The Cufflinks statistical model probabilistically assigns reads to the assembled isoforms. Cuffdiff was used to find differentially expressed genes (DEGs). The read coverage of one gene was used to calculate the gene expression level, which was measured with displays significantly a higher average clustering coefficient than whole co-expression network (0.443746579). (E) The information centrality (the flow of information between any two nodes in a connected network) for the largest component of co-expression network (92 nodes) is presented. Turquoise module displays significantly increased information centrality compared to the entire network (0.005299235). (F) Interactive graph of GO terms associated with cotton leaf curl disease responsive G. arboreum hub genes identified by co-expression network analysis. Analysis performed with online tool agriGO (bioinfo.cau.edu.cn/agriGO/) where a key indicates significance levels of GO terms.
the fragment per kilobase of exon model per million mapped reads (FPKM) method. A q value cutoff of 0.05 was used to determine whether a gene had differential expression between samples.
Quantitative real time PCR.
To verify the differential expression detected by the Illumina RNA-Seq data, quantitative real-time RT-PCR (qRT-PCR) was performed on a new set of symptomatic and asymptomatic sam-ples. A set of 17 genes was chosen, including 10 upregulated and 7 downregulated genes (Table S4). Primers for qPCR were designed with the program Primer3 (http://bioinfo.ut.ee/primer3-0.4.0/primer3) with default set-tings. All primer sequences are provided in Table S3. qRT-PCR was performed using a QUANTSTUDIO 6 flex qRT-PCR instrument and the light cycler fast start DNA Master SYBR Green I kit (Roche, Basel, Switzerland). Reactions were performed in triplicate, and contained 100 ng of cDNA, 0.5 μ L of each primer (10 μ M/μ L), and 10 μ L SYBR Green Master Mix in a final volume of 20 μ L. The amplification reactions were performed under the following conditions: 95 °C for 5 min, followed by 40 cycles of 95 °C for 15 s, 55 °C for 20 s, and 72 °C for 30 s. Melting curve analysis, performed by increasing the temperature from 55 to 95 °C (0.5 °C per 10 s), and gel elec-trophoresis of the final product confirmed the presence of single amplicons. Relative fold differences for each sample in each experiment were calculated using the ΔΔ Ct method and the amplification of 18 S rRNA was used as an internal control to normalize all data89. To corroborate the expression levels measured by RNA-Seq,the ratio of expression as measured by qRT-PCR was compared to the ratio of expression levels between samples using RNA-Seq.
Construction of co-expression network and network analyses.
To construct a co-expression net-work, we processed transcripts with FPKM count ≥10 and removed all the outliers, which yielded a total number of 468 DEGs. We implemented the R-based Weighted Gene Co-expression Network Analysis (WGCNA)67,68package to construct a co-expression network. The dendrogram was constructed using the cutreeDynamicTree algorithm68, with a threshold of minimum module size of 70 genes. A weighted correlation threshold of ≥0.85 was
set that resulted in the identification of two modules representing the entire network. Python-based NetworkX90
and Cytoscape v. 3.5.1 Plugins91 were utilized for network analyses including information centrality, degree and
cluster coefficients. The weighted co-expression network was visualized using “Group Attributes Layout”, a feature of Cytoscape v. 3.5.192. Box plot was used to display the distribution of nodes within each module for information
centrality, degree and cluster coefficients. Students t-test describes statistical significance.
Gene ontology and functional annotation of DEGs.
To determine the main biological functions and pathways of the DEGs, all DEGs were mapped to terms in the Kyoto Encyclopedia of Genes and Genomes (KEGG: www.kegg.jp/kegg/kegg1.html) databases93 using AgriGO and Kobas 3.0 tools respectively. Functionalanalysis of DEGs was done by searching the gene IDs of DEGs in the Swissprot and TrEMBL blast alignment hits available on Cottongen database (https://www.cottongen.org/). Furthermore, the GO term analysis of the identi-fied nodes and hub genes in WGCNA was performed to determine their possible roles in plant defense to CLCuD.
Data availability.
RNA-Seq data from this study have been deposited at the NCBI under the BioProject accession No. PRJNA380937 and BioSample Nos. SAMN06628122, SAMN06628123, SAMN06628124, SAMN06628125, SAMN06628126 and SAMN06628127.References
1. Lee, J. J., Woodward, A. W. & Chen, Z. J. Gene expression changes and early events in cotton fibre development. Annals of botany
100, 1391–1401 (2007).
2. Chen, Z. J. et al. Toward sequencing cotton (Gossypium) genomes. Plant physiology 145, 1303–1310 (2007).
3. Paterson, A. H. et al. Repeated polyploidization of Gossypium genomes and the evolution of spinnable cotton fibres. Nature 492, 423–427 (2012).
4. Maqbool, A. et al. Gossypium arboreum GHSP26 enhances drought tolerance in Gossypium hirsutum. Biotechnology progress 26, 21–25 (2010).
5. Robinson, A. F. Reniform in US Cotton: When, Where, Why, and Some Remedies 1. Annual review of phytopathology 45, 263–288 (2007).
6. Li, R. & Erpelding, J. E. Genetic diversity analysis of Gossypium arboreum germplasm accessions using genotyping-by-sequencing.
Genetica 144, 535–545 (2016).
7. Gong, Q. et al. Salicylic acid-related cotton (Gossypium arboreum) ribosomal protein GaRPL18 contributes to resistance to Verticillium dahliae. BMC plant biology 17, 59 (2017).
8. Razaq, M., Abbas, G., Farooq, M., Aslam, M. & Athar, H.-U.-R. Effect of Insecticidal Application on Aphid Population, Photosynthetic Parameters and Yield Components of Late Sown Varieties of Canola, Brassica napus L. Pakistan journal of zoology
46, 661–668 (2014).
9. Zubair, M., Zaidi, S. S., Shakir, S., Amin, I. & Mansoor, S. An insight into Cotton leaf curl Multan betasatellite, the most important component of cotton leaf curl disease complex. Viruses 9, 280 (2017).
10. Zaidi, S. S., Briddon, R. W. & Mansoor, S. Engineering dual Begomovirus-Bemisia tabaci resistance in plants. Trends in Plant
Science 22, 6–8 (2017).
11. Zaidi, S. S., Martin, D. P., Amin, I., Farooq, M. & Mansoor, S. Tomato leaf curl New Delhi virus: a widespread bipartite begomovirus in the territory of monopartite begomoviruses. Molecular Plant Pathology 18, 901–911 (2017).
12. Zaidi, S. S.-e.-A., Tashkandi, M., Mansoor, S. & Mahfouz, M. M. Engineering Plant Immunity: Using CRISPR/Cas9 to Generate Virus Resistance. Frontiers in plant science 7 (2016).
13. Zaidi, S. S. et al. Frequent occurrence of Tomato leaf curl New Delhi virus in cotton leaf curl disease affected cotton in Pakistan. Plos
one 11, e0155520 (2016).
14. Zubair, M. et al. Multiple begomoviruses found associated with cotton leaf curl disease in Pakistan in early 1990 are back in cultivated cotton. Scientific reports 7, 680 (2017).
15. Gatehouse, J. A. Plant resistance towards insect herbivores: a dynamic interaction. New phytologist 156, 145–169 (2002). 16. Park, W., Scheffler, B. E., Bauer, P. J. & Campbell, B. T. Genome-wide identification of differentially expressed genes under water
www.nature.com/scientificreports/
17. Wang, L. et al. RNA-seq analyses of multiple meristems of soybean: novel and alternative transcripts, evolutionary and functional implications. BMC Plant Biology 14, 169 (2014).
18. Heidel-Fischer, H. M., Musser, R. O. & Vogel, H. Plant transcriptomic responses to herbivory. Annual plant reviews 47, 155–196 (2014).
19. Thompson, G. A. & Goggin, F. L. Transcriptomics and functional genomics of plant defence induction by phloem-feeding insects.
Journal of experimental botany 57, 755–766 (2006).
20. Artico, S. et al. Transcriptome analysis of Gossypium hirsutum flower buds infested by cotton boll weevil (Anthonomus grandis) larvae. BMC genomics 15, 854 (2014).
21. Dubey, N. K. et al. Comparative transcriptome analysis of Gossypium hirsutum L. in response to sap sucking insects: aphid and whitefly. BMC genomics 14, 241 (2013).
22. Li, J. et al. Transcriptome analysis reveals a comprehensive insect resistance response mechanism in cotton to infestation by the phloem feeding insect Bemisia tabaci (whitefly). Plant biotechnology journal (2016).
23. Babu, M., Gagarinova, A. G., Brandle, J. E. & Wang, A. Association of the transcriptional response of soybean plants with soybean
mosaic virus systemic infection. Journal of general virology 89, 1069–1080 (2008).
24. Zhang, F. et al. Genetic regulation of salt stress tolerance revealed by RNA-Seq in cotton diploid wild species, Gossypium davidsonii.
Scientific reports 6, 20582, https://doi.org/10.1038/srep20582 (2016).
25. Du, P. et al. Viral infection induces expression of novel phased microRNAs from conserved cellular microRNA precursors. PLoS
pathogens 7, e1002176 (2011).
26. Lu, J. et al. Transcriptome analysis of Nicotiana tabacum infected by Cucumber mosaic virus during systemic symptom development. PLoS one 7, e43447 (2012).
27. Yang, C. et al. Spatial analysis of Arabidopsis thaliana gene expression in response to Turnip mosaic virus infection. Molecular
plant-microbe interactions 20, 358–370 (2007).
28. Yang, J., Zhang, F., Li, J., Chen, J.-P. & Zhang, H.-M. Integrative analysis of the microRNAome and transcriptome illuminates the response of susceptible rice plants to rice stripe virus. PLoS one 11, e0146946 (2016).
29. Zhang, Z. et al. De novo transcriptome sequencing in Frankliniella occidentalis to identify genes involved in plant virus transmission and insecticide resistance. Genomics 101, 296–305 (2013).
30. Akhtar, K. P. et al. First symptomatic evidence of infection of Gossypium arboreum with Cotton leaf curl Burewala virus through grafting. Internationa Journal of Agricultural Biology 15, 157–160 (2013).
31. Akhtar, K. et al. Evaluation of Gossypium species for resistance to cotton leaf curl Burewala virus. Annals of applied biology 157, 135–147 (2010).
32. Ullah, R. et al. An analysis of the resistance of Gossypium arboreum to cotton leaf curl disease by grafting. European journal of plant
pathology 139, 837–847 (2014).
33. Azhar, M. T., Amin, I., Bashir, A. & Mansoor, S. Characterization of resistance gene analogs from Gossypium arboreum and their evolutionary relationships with homologs from tetraploid cottons. Euphytica 178, 351–362 (2011).
34. Trapnell, C. et al. Differential gene and transcript expression analysis of RNA-seq experiments with TopHat and Cufflinks. Nature
protocols 7, 562–578 (2012).
35. Artico, S., Nardeli, S. M., Brilhante, O., Grossi-de-Sa, M. F. & Alves-Ferreira, M. Identification and evaluation of new reference genes in Gossypium hirsutum for accurate normalization of real-time quantitative RT-PCR data. BMC plant biology 10, 49 (2010). 36. Henry, E., Yadeta, K. A. & Coaker, G. Recognition of bacterial plant pathogens: local, systemic and transgenerational immunity.
New phytologist 199, 908–915 (2013).
37. Zhang, C. et al. Overexpression of a novel peanut NBS‐LRR gene AhRRS5 enhances disease resistance to Ralstonia solanacearum in tobacco. Plant biotechnology journal (2016).
38. Lim, H.-S. et al. The coat protein of Alternanthera mosaic virus is the elicitor of a temperature-sensitive systemic necrosis in
Nicotiana benthamiana, and interacts with a host boron transporter protein. Virology 452, 264–278 (2014).
39. Chandran, D. Co‐option of developmentally regulated plant SWEET transporters for pathogen nutrition and abiotic stress tolerance. IUBMB life 67, 461–471 (2015).
40. Antony, G. et al. Rice xa13 recessive resistance to bacterial blight is defeated by induction of the disease susceptibility gene Os-11N3. The plant cell 22, 3864–3876 (2010).
41. Wang, Y. & Wu, W.-H. Plant sensing and signaling in response to K + -deficiency. Molecular plant 3, 280–287 (2010).
42. Zhou, L. et al. Overexpression of GmAKT2 potassium channel enhances resistance to soybean mosaic virus. BMC plant biology 14, 154 (2014).
43. Zou, J. et al. Expression profiling soybean response to Pseudomonas syringae reveals new defense-related genes and rapid HR-specific downregulation of photosynthesis. Molecular plant-microbe interactions 18, 1161–1174 (2005).
44. Kim, M. J., Kim, H. R. & Paek, K.-H. Arabidopsis tonoplast proteins TIP1 and TIP2 interact with the cucumber mosaic virus 1a replication protein. Journal of general virology 87, 3425–3431 (2006).
45. Katiyar, A. et al. Genome-wide classification and expression analysis of MYB transcription factor families in rice and Arabidopsis.
BMC genomics 13, 544 (2012).
46. Wang, J. et al. Genome-wide analysis of bHLH transcription factor and involvement in the infection by yellow leaf curl virus in tomato (Solanum lycopersicum). BMC genomics 16, 39 (2015).
47. Huang, P.-Y., Catinot, J. & Zimmerli, L. Ethylene response factors in Arabidopsis immunity. Journal of experimental botany, erv518 (2015).
48. Thomma, B. P., Nürnberger, T. & Joosten, M. H. Of PAMPs and effectors: the blurred PTI-ETI dichotomy. The plant cell 23, 4–15 (2011).
49. Chen, J.-Y. et al. Genome-wide analysis of the gene families of resistance gene analogues in cotton and their response to Verticillium wilt. BMC plant biology 15, 148 (2015).
50. Rowland, O. et al. Functional analysis of Avr9/Cf-9 rapidly elicited genes identifies a protein kinase, ACIK1, that is essential for full Cf-9–dependent disease resistance in tomato. The Plant cell 17, 295–310 (2005).
51. Song, W.-Y., Wang, G.-L., Chen, L.-L. & Kim, H.-S. A receptor kinase-like protein encoded by the rice disease resistance gene, Xa21. Science 270, 1804 (1995).
52. Kørner, C. J., Du, X., Vollmer, M. E. & Pajerowska-Mukhtar, K. M. Endoplasmic reticulum stress signaling in plant immunity—at the crossroad of life and death. International journal of molecular sciences 16, 26582–26598 (2015).
53. Chen, M.-H., Tian, G.-W., Gafni, Y. & Citovsky, V. Effects of calreticulin on viral cell-to-cell movement. Plant physiology 138, 1866–1876 (2005).
54. Stange, C. Plant-virus interactions during the infective process. Cien. Inv. Agr. (in English) 33 (1): 1–18. Ciencia e investigacion
agraria 33, 1–18 (2006).
55. Liu, J. Z. & Whitham, S. A. Overexpression of a soybean nuclear localized type–III DnaJ domain‐containing HSP40 reveals its roles in cell death and disease resistance. The plant journal 74, 110–121 (2013).
56. Taguwa, S. et al. Defining Hsp70 subnetworks in dengue virus replication reveals key vulnerability in flavivirus infection. Cell 163, 1108–1123 (2015).
57. Gorovits, R. & Czosnek, H. The involvement of heat shock proteins in the establishment of Tomato yellow leaf curl virus infection.
58. Citovsky, V., Zaltsman, A., Kozlovsky, S. V., Gafni, Y. & Krichevsky, A. In Seminars in cell & developmental biology. 1048–1054 (Elsevier).
59. Mandadi, K. K. & Scholthof, K.-B. G. Plant immune responses against viruses: how does a virus cause disease? The plant cell 25, 1489–1505 (2013).
60. Hua, Z. & Vierstra, R. D. The cullin-RING ubiquitin-protein ligases. Annual review of plant biology 62, 299–334 (2011). 61. Sánchez-Durán, M. A. et al. Interaction between geminivirus replication protein and the SUMO-conjugating enzyme is required
for viral infection. Journal of virology 85, 9789–9800 (2011).
62. Castillo, A. et al. Identification of Plant Genes Involved in TYLCV Replication. Tomato Yellow Leaf Curl Virus Disease, 207–221 (2007).
63. Lozano-Durán, R. et al. Geminiviruses subvert ubiquitination by altering CSN-mediated derubylation of SCF E3 ligase complexes and inhibit jasmonate signaling in Arabidopsis thaliana. The Plant Cell Online 23, 1014–1032 (2011).
64. Eini, O. et al. Interaction with a host ubiquitin-conjugating enzyme is required for the pathogenicity of a geminiviral DNA β satellite. Molecular plant-microbe interactions 22, 737–746 (2009).
65. Garbutt, C. C., Bangalore, P. V., Kannar, P. & Mukhtar, M. Getting to the edge: protein dynamical networks as a new frontier in plant–microbe interactions. Frontiers in plant science 5 (2014).
66. Tully, J. P. et al. Expression-based network biology identifies immune-related functional modules involved in plant defense. BMC
genomics 15, 421 (2014).
67. Langfelder, P. & Horvath, S. WGCNA: an R package for weighted correlation network analysis. BMC bioinformatics 9, 559 (2008). 68. Zhang, B. & Horvath, S. A general framework for weighted gene co-expression network analysis. Statistical applications in genetics
and molecular biology 4 (2005).
69. Langfelder, P. & Horvath, S. Eigengene networks for studying the relationships between co-expression modules. BMC systems
biology 1, 54 (2007).
70. Seebacher, J. & Gavin, A.-C. SnapShot: Protein-protein interaction networks. Cell 144, 1000–1000. e1001 (2011).
71. Wang, J., Chen, G., Li, M. & Pan, Y. Integration of breast cancer gene signatures based on graph centrality. BMC systems biology 5, S10 (2011).
72. Nour-Eldin, H. H. et al. NRT/PTR transporters are essential for translocation of glucosinolate defence compounds to seeds. Nature
488, 531–534 (2012).
73. Sade, D. et al. Involvement of the hexose transporter gene LeHT1 and of sugars in resistance of tomato to tomato yellow leaf curl virus. Molecular plant 6, 1707–1710 (2013).
74. Delprato, M. L., Krapp, A. R. & Carrillo, N. Green Light to Plant Responses to Pathogens: The Role of Chloroplast Light‐Dependent Signaling in Biotic Stress. Photochemistry and photobiology 91, 1004–1011 (2015).
75. Liu, X. et al. Reactive oxygen species are involved in plant defense against a gall midge. Plant physiology 152, 985–999 (2010). 76. Bolton, M. D. Primary metabolism and plant defense—fuel for the fire. Molecular plant-microbe Interactions 22, 487–497 (2009). 77. Rojas, C. M., Senthil-Kumar, M., Tzin, V. & Mysore, K. Regulation of primary plant metabolism during plant-pathogen interactions
and its contribution to plant defense. Frontiers in plant science 5, 17 (2014).
78. Trouvelot, S. et al. Carbohydrates in plant immunity and plant protection: roles and potential application as foliar sprays. Frontiers
in plant science 5 (2014).
79. Wu, J. & Baldwin, I. T. New insights into plant responses to the attack from insect herbivores. Annual review of genetics 44, 1–24 (2010).
80. Howe, G. A. & Jander, G. Plant immunity to insect herbivores. Annu. Rev. Plant Biol. 59, 41–66 (2008).
81. Zaidi, S. S., Tashkandi, M. & Mahfouz, M. M. Engineering molecular immunity against plant viruses. Progress in Molecular Biology
and Translation Science 149, 167–186 (2017).
82. Zaidi, S. S., Mansoor, S., Ali, Z., Tashkandi, M. & Mahfouz, M. M. Engineering plants for geminivirus resistance with CRISPR/Cas9 system. Trends in Plant Science 21, 279–281 (2016).
83. Ali, Z., Ali, S., Tashkandi, M., Zaidi, S. S. & Mahfouz, M. M. CRISPR/Cas9-mediated immunity to geminiviruses: Differential interference and evasion. Scientific reports 6, 26912 (2016).
84. Zhong, S. et al. High-throughput illumina strand-specific RNA sequencing library preparation. Cold spring harbor protocols 2011, pdb. prot5652 (2011).
85. Bolger, A. M., Lohse, M. & Usadel, B. Trimmomatic: a flexible trimmer for Illumina sequence data. Bioinformatics, btu170 (2014). 86. Andrews, S. FastQC: a quality control tool for high throughput sequence data. Available online at: http://www.bioinformatics.
babraham.ac.uk/projects/fastqc (2010).
87. Li, F. et al. Genome sequence of the cultivated cotton Gossypium arboreum. Nature genetics 46, 567–572 (2014).
88. Pertea, M., Kim, D., Pertea, G. M., Leek, J. T. & Salzberg, S. L. Transcript-level expression analysis of RNA-seq experiments with HISAT, StringTie and Ballgown. Nature protocols 11, 1650–1667 (2016).
89. Zhang, X. et al. mRNA-seq analysis of the Gossypium arboreum transcriptome reveals tissue selective signaling in response to water stress during seedling stage. PLoS one 8, e54762 (2013).
90. Hagberg, A., Swart, P. J. & Schult, D. A. Exploring network structure, dynamics, and function using NetworkX. (Los Alamos National Laboratory (LANL), 2008).
91. Saito, R. et al. A travel guide to Cytoscape plugins. Nature methods 9, 1069–1076 (2012).
92. Demchak, B. et al. Cytoscape: the network visualization tool for GenomeSpace workflows. F1000Research 3 (2014).
93. Kanehisa, M., Furumichi, M., Tanabe, M., Sato, Y. & Morishima, K. KEGG: new perspectives on genomes, pathways, diseases and drugs. Nucleic acids research. 45, D353–D361 (2017).
94. Marino, G. & Funk, C. Matrix metalloproteinases in plants: a brief overview. Physiologia plantarum 145, 196–202 (2012). 95. Lacerda, A., Vasconcelos, É. A. R., Pelegrini, P. B. & Grossi-de-Sa, M. F. Antifungal defensins and their role in plant defense.
Frontiers in microbiology 5, 116 (2014).
96. Thomma, B. P., Cammue, B. P. & Thevissen, K. Plant defensins. Planta 216, 193–202 (2002).
97. Spoel, S. H. & Dong, X. How do plants achieve immunity? Defence without specialized immune cells. Nature reviews immunology
12, 89–100 (2012).
98. Igarashi, D., Tsuda, K. & Katagiri, F. The peptide growth factor, phytosulfokine, attenuates pattern‐triggered immunity. The plant
journal 71, 194–204 (2012).
99. Loivamäki, M. et al. A role for PSK signaling in wounding and microbial interactions in Arabidopsis. Physiologia plantarum 139, 348–357 (2010).
100. Wang, J. et al. Allosteric receptor activation by the plant peptide hormone phytosulfokine. Nature 525, 265–268 (2015). 101. Park, C.-J. & Seo, Y.-S. Heat shock proteins: a review of the molecular chaperones for plant immunity. The plant pathology journal
31, 323 (2015).
102. Verchot, J. Cellular chaperones and folding enzymes are vital contributors to membrane bound replication and movement complexes during plant RNA virus infection. Frontiers in plant science 3, 275 (2012).
103. Hofius, D. et al. Capsid protein-mediated recruitment of host DnaJ-like proteins is required for Potato virus Y infection in tobacco plants. Journal of virology 81, 11870–11880 (2007).
104. Rawat, R. et al. REVEILLE1, a Myb-like transcription factor, integrates the circadian clock and auxin pathways. Proceedings of the