GEOCHEMICAL CHARACTERIZATION AND DIRECT DA TING OF ROCK ART USING RADIOCARBON AND OPTICALLY STIMULATED LUMINESCENCE: THE
CASE STUDY OF SOUTHERN AFRICA AND THE CANADIAN SHIELD
THÈSE
PRÉSENTÉE
COMME EXIGENCE PARTIELLE
DU DOCTORAT EN SCIENCES DE LA TERRE ET DE L'ATMOSPHERE
PAR
BONNEAU ADELPHINE
UNIVERSITÉ DU QUÉBEC À MONTRÉAL Service des bibliothèques
Avertissement
La diffusion de cette thèse se fait dans le respect des droits de son auteur, qui a signé le formulaire Autorisation de reproduire et de diffuser un travail de recherche de cycles supérieurs (SDU-522 - Rév.0?-2011 ). Cette autorisation stipule que «conformément
à
l'article 11 du Règlement no 8 des études de cycles supérieurs, [l'auteur] concèdeà
l'Université du Québecà
Montréal une licence non exclusive d'utilisation et de publication de la totalité ou d'une partie importante de [son] travail de recherche pour des fins pédagogiques et non commerciales. Plus précisément, [l'auteur] autorise l'Université du Québecà
Montréalà
reproduire, diffuser, prêter, distribuer ou vendre des copies de [son] travail de rechercheà
des fins non commerciales sur quelque support que ce soit, y compris l'Internet. Cette licence et cette autorisation n'entraînent pas une renonciation de [la] part [de l'auteur]à
[ses] droits moraux nià
[ses] droits de propriété intellectuelle. Sauf entente contraire, [l'auteur] conserve la liberté de diffuser et de commercialiser ou non ce travail dont [il] possède un exemplaire.»CARACTERI ATION GEOCI-IIMIQUE ET DATATION DIRECT DE L'ART RUPESTRE EN UTILISANT LE RADIOCARBONE ET LA LUMINESCENCE STIMULÉE OPTIQUEMENT: APPLICATION À DES SITES D'AFRIQUE AUTRALE ET
DU BOUCLIER CANADIEN
THÉ SE PRÉSENTÉE
COMME EXIGENCE PARTIELLE
DU DOCTORAT EN SCIENCES DE LA TERRE ET DE L'ATMOSPHÈRE
PAR
ADELPI-IINE BONNEAU
Je tiens tout d'abord à remercier mes trois directeurs de thèse, les professeurs Michel Lamothe, Daniel Arsenault et Thomas Higham. Leurs conseils, leur expertise et leurs encouragements au cours de ces quatre années ont été déterminants pour la réalisation de ce doctorat.
Le projet de caractérisation et de datation de l'art rupestre en Afrique australe a été initié en 2010 par le professeur David Pearce. Depuis mon master en archéométrie, jusqu'à 1 'aboutissement de cette thèse de doctorat, nous avons collaboré à la sélection des sites, à la collecte des échantillons, à l'interprétation des résultats et à leur diffusion (articles, conférences, posters). Je tiens à lui exprimer toute ma gratitude pour son inestimable aide, ses conseils et son soutien dans la réalisation de ce doctorat.
Un autre acteur important de ce doctorat füt le professeur Peter Mitchell. li m'a permis d'accéder aux sites rupestres au Lesotho et m'a fait profiter de ces connaissances approfondies de 1 'archéologie de 1 'Afrique australe. Je le remercie chaleureusement pour ses conseils durant la rédaction des divers articles et de cette thèse de doctorat.
Mes recherches étaient basées dans le laboratoire de luminescence Lux, de l'Université du Québec à Montréal. Je tiens à remercier les membres de ce laboratoire, Magali Barré, Laurence Forget Brisson, François Hardy, et Sébastien Huot, pour m'avoir accueillie, fait découvrir la luminescence, dispensée de nombreux conseils et aidée à réaliser les analyses OSL lors de ma grossesse et des derniers mois de mon doctorat.
Mon deuxième laboratoire de recherche était le Research Laboratory for Archaeology and the History of Art, à l'Université d'Oxford, au Royaume-Uni. Je suis très reconnaissante à toute l'équipe de l'unité de datation par le radiocarbone pour m'avoir accueillie, encadrée, et conseillée. Mike Dee est particulièrement remercié pour ses encouragements, ses recommandations, et pour nos discussions dans la langue de Molière dans les pubs d'Oxford.
iv
Je tiens également à remercier Peter Ditchfield pour son aide et sa disponibilité lors de mes passages au laboratoire.
Au sein de ce laboratoire, Fiona Brock et Richard Staff ont tenu une place à part. lis m'ont formée et encadrée lors de mes visites au laboratoire. Leurs recommandations, leur expérience et leurs connaissances ont été des atouts importants dans la réalisation de la partie radiocarbone de mon doctorat. Je tiens également à les remercier pour les discussions «jeunes parents » autour d'un thé.
Au cours de mon doctorat, j'ai utilisé des instruments dans d'autres laboratoires que mes laboratoires d'attache. Le laboratoire de caractérisation des matériaux de 1 'Université de Montréal et le laboratoire de microanalyse de l'Université Laval sont remerciés pour m'avoir permis d'utiliser leurs spectromètres Raman et FTTR et leur MEB-EDS. Je tiens particulièrement à remercier Nicolas Cottenye et André Ferla nd qui m'ont formée à l'utilisation de leurs instruments. Enfin, je remercie Michel Préda pour son aide lors des essais d'analyses de mes échantillons avec la diffraction de rayons X, qui n'ont malheureusement pas été couronnés de succès.
L'étude du site du Lac Wapizagonke s'est déroulée en collaboration avec le laboratoire de sciences de la conservation de Parcs Canada. Je tiens à exprimer toute ma gratitude à Kenza Dufourmentelle pour m'avoir permis d'utiliser tous les instruments et ressources de son laboratoire pour la réalisation de ce projet. Je suis également extrêmement reconnaissante à Joy Moyle pour m'avoir formée et encadrée lors de cette collaboration.
Je remercie chaleureusement Laura Malien, Charles Arthur, et Rachel King qui, lors de la collection d'échantillons au Lesotho et en Afrique du Sud, m'ont apporté leur aide, leurs connaissances des lieux, des sites et des populations locales, ainsi qu'un soutien logistique essentiel à la bonne réalisation de ces travaux sur le terrain. Je tiens également à remercier les guides et équipes d'archéologues locaux qui nous ont permis d'accéder aux sites rupestres au Lesotho et au Botswana.
J'aimerais adresser un remerciement tout particulier à Luiseach Nic Eoin. Nous avons collaboré ensemble à l'analyse des peintures et des résidus de matières colorantes retrouvées
sur des meules, ce qui a permis de reconstituer les préparations nécessaires à la réalisation des peintures. Cette étape a été déterminante dans la reproduction de peintures pour les tests OSL. Par ailleurs, Luiseach a eu la gentillesse de corriger ma thèse du point de vue de la langue anglaise, et je l'en remercie infiniment.
Au cours de ce doctorat, j'ai reçu 1 'aide de Laura Didier, étudiante en Mas ter en archéométrie de l'université de Bordeaux. Elle est venue à l'Université du Québec à Montréal pour réaliser son stage de fin de master (6 mois), pour lequel elle a été encadrée par le professeur Michel Lamothe et moi-même. Ces travaux sur les peintures blanches de la vallée du Phuthiatsana au Lesotho ont été intégrés à ma thèse de doctorat. Je tiens à la remercier pour son excellent travail d'analyses et de recherche.
Les analyses U/Th présentées dans ce doctorat ont été réalisées par Bassam Ghaleb. Je tiens à lui exprimer toute ma gratitude pour ces analyses, pour son aide, ses conseils avisés, ses trucs et astuces pour préparer les échantillons, et pour le chocolat toujours disponible dans son bureau.
Je tiens à adresser un remerciement tout particulier à Raynald Lapointe et Michelle Laithier. Raynald m'a formé sur les MEB du département, m'a apporté de nombreux conseils et idées pour la préparation de mes échantillons et la réalisation de mes analyses. Michelle a réalisé la plupart des cartes de ce doctorat et a passé de nombreuses heures à m'apprendre à réaliser les figures qui ponctuent ce manuscrit. En plus de leur précieuse aide, ils ont été pour moi comme des parents tout au long de ce doctorat.
Les organismes et institutions suivants sont remerciés pour avoir subventionné mon projet de doctorat: Fond de Recherche du Québec-Société et Culture, Géotop, Fondation de I'UQAM, Conseil de Recherches en Sciences Humaines, Institut Français d'Afrique du Sud, Association France-Canada, United Kingdom 's Na tura! Environment Research Council, South A frican National Research Foundation.
Le South African Heritage Resources Agency, l'Eastern Cape Provincial Heritage Resources Authority, le National Museum and Monuments du Botswana, le Department of Culture (Protection and Preservation Commission) du Lesotho et Parcs Canada sont remercés pour
VI
avoir délivré les permis archéologiques. Je suis également reconnaissante aux propriétaires et communautés locales de m'avoir donné accés à leurs propriétés où se trouvaient les sites étudiés.
Je souhaite remercier les étudiants présents et passés du département des Sciences de la Terre et de l'atmosphère de l'UQAM, Pauline, Samuel, Clyde, Pierre-Marc, Guillaume, Jérémy, Stéphane, Noémie, Agnès, James, et Geneviève, pour les discussions, les goüters, les fou -rires et autres moments qui ont ponctué mes années de doctorat et qui ne figureront dans aucun rapport officiel.
Enfin, je voudrais remercier ma famille et mes amis pour m'avoir soutenue pendant tout mon parcours universitaire, jusqu'à l'achèvement de cette thèse de doctorat. Leur soutien a été sans faille dans les bons moments comme dans les pires. Je finirai par remercier du fond du cœur mon conjoint Samuel et mon petit garçon, Philéas, né pendant ce doctorat, pour leur patience et le réconfort qu'ils m'ont appo1té tout au long de ce projet.
REMERCIEMENTS ... III TABLE DES MATIÈRES ... IX
LISTE DES FIGURES ... XV LISTE DES TABLEAUX ... XXVII LISTE DES ACRONYMES ... XXIX ABSTRACT ... XXXI RESUMÉ ... XXXIII
INTRODUCTION ... 1
CHAPTER ! ... 7
DA TING ROCK ART: OBJECTIVES AND CHALLENGES IN SOUTHERN AFRICA AND THE CANADIAN SHIELD ... 7
1.1 Direct or indirect dating of rock art: a terminological problem? ... 7
1.2 San rock art ... 9
1.2.1 Characteristics and history ofresearch ... 9
1.2.2 CuiTent research and questions ... 12 1.2.3 Sites selected ... 16 1.3 Rock art in the Canadian Shield ... 34
1.3 .1 Characteristics and history of research ... 34
1.3.2 Current research and questions ... 39
1.3.3 Sites selected ... 41 1.4 Discussion: southern African and Canadian rock arts dating: similarities and differences ... 47
CHAPTER 11 ... 48
METHODOLOGY AND DA TING TECHNIQUES APPLIED ... 49
x
2.1.1 How to date rock art? Review of techniques applied around the world ........... 49 2.1.2 1 n southern A fr ica ......... 0 .... 0 ......................... 0 ....................... 0 .... 54 2.1.3 ln the Canadian Shield .................................................... 57 2.2 Da ting techniques applied: description and working hypothesis ..................... 59 2.2.1 Radiocarbon dating ... 0 ....................................................... 60 2.2.2 Optically stimulated luminescence da ting ... 66 2.3 Characterizing paintings before dating: a necessary step ... 76
2.3.1 Previous studies on rock art pigments: archaeology, ethnography and chemical characterization ... o ... o 76 2.40 1 General characterization methodology ... 84 2.4.2 Information about the schedule ofthis project ... 85 2.4.3 Sample collection and preparations ... 86 2.4.4 Microscopy ... o ... 90 2.4.5 Scanning electron microscopy coupled with Energy-dispersive X-ray
Spectrometry (SEM-EDS) ... 91 2.4.6 Raman spectroscopy ... 0 ... 92
2.4.7 FTIR spectroscopy ... o ... o···oo ... · ... 94 2.5 Conclusion on the general methodology ... 95 CHAPTER lll ... o ... o ... o ... o ... o ... 97 THE ARTISTS' PALETTE: HOW PAINTS WERE MADE ... 97 3.1 Macleardistrict, South Africa ... IOI 3.1.1 Rock and surface preparation ... 101 3.1.2 Black paints ... 102 3.1.3 Whitepaints ... JI5 3.1.4 Red paints ... 121 3ol.5 Weathering products and alterations ... 128 3.1.6 General discussion and conclusion ... J 30
3.2 The Phuthiatsana Valley, Lesotho ... 133 3 .2.1 Rock and surface preparation ... 133 3.2.2 Black paints ... 134 3.2.3 White paints ... 145 3 .2.4 Red pai nts ... 157 3.2.5 Weathering products and alterations ... 163 3.2.6 White soils ... 167 3.2.7 Red soils ... 173 3.2.8 Discussion on paints in the Phuthiatsana Valley, Lesotho ... 178 3.3 The Thune Valley, Botswana ... 182 3.3.1 Rock and surface preparation ... 182 3.3.2 Black paints ... 183 3.3.3 Weathering products and alterations ... 189 3.3.4 Discussion about paints in Botswana ... 193 3.3.5 General discussion about paints in southern Africa ... 195 3.4 Discussion about the characterization protocol ... 198 CHAPTER 1 V ... 201 RADIOCARBON DA TING ON ROCK ART ... 201 4.1 lnterpreting characterization results ... 201
4.1.1 Type of pigment ... 20 1 4.1.2 Identification of radiocarbon contaminants ... 203 4.1.3 Selecting the best sample for radiocarbon dating: the characterization protocol
step by step and discussion ... 204 4.2 Chemical pre-treatment ... 210 4.2.1 1 nvestigations on calcium oxalates ... 21 1 4.2.2 Experiments on artiticial mixtures ... 212 4.2.3 Experiments on real samples and results ... 214
Xli
4.3 Results and discussion ... 215
4.3.1 Rock art sample selection mode! ... 215 4.3.2 Dates obtained ... 218 4.3.3 Dates in context: implications for San rock art sites ... 256
4.3.4 Discussion on the methodology and radiocarbon dates ... 258
CHAPTER V ... 261 OPTICALLY STIMULATED LUMINESCENCE DATING ON ROCK ART: A FEASABILJTY TUDY ... 261
5.1 Preliminary investigation ... 261
5.1.1 Geology of the sites ... 261 5.1.2 Suitability of quartz and K-feldspars for OSL/1 RSL analyses ... 262
5.2 Luminescence transects inside of the rock faces ... 284
5.2.1 Quartz ... 284
5.2.2 K-feldspars ... 286
5.3 Reproduction of rock paintings for tests ... 290
5.3.1 Paintings preparation and reproduction ... 290
5.3.2 Luminescence transects with paintings ... 292
5.4 Fading correction ... 295
5.5 Dosimetry and dose rates ... 295
5.5.1 Rocks ... 296
5.5.2 Cosmic rays ... 298
5.5.3 Pigment ... 299
5.5.4 Final dose rate calculations ... 301 5.6 Discussion and fw1her work ... 303
CHAPITRE VI ... 306
PIGMENT CHARACTERIZATION AS AN ALTERNATIVE TO INTERPRETE ROCK ART SITES WHEN DA TING METHODS FAIL: THE CA E OF THE MIKINAK SITE, LAKE WAPIZAGONKE, QUEBEC, CANADA ... 307
A bstract ... 3 08
6.1 Introduction ... 308
6.2 Description of the site ... 309
6.3 Methodology ... 3 1 1 6.3.1 Dating methods ... 3 1 1 6.3.2 Characterization protocol ... 313
6.4 Results ... 314 6.4.1 Paintings ... 314 6.4.2 Rock supports and non-anthropic deposits ... 320
6.4.3 Radiocarbon dating ... 324
6.4.4 OSL dating ... 325
6.5 Discussion ... 325
6.5.1 Paintings and their environment.. ... 325
6.5.2 Interpretation of the site ... 328
CONCLUSION ... 337
APPENDIX A ... 345
INSTRUMENT PRINCIPLES ... 342
APPENDJX B ... 349
ROCK SUPPORTCHARACTERIZATION: SOUTH AFRICA, LESOTHO AND BOTSWANA ... 349
APPENDIX C ... 358
TRANS FER FROM LEXSYG TO RIS0: TESTS AND NEW SETTINGS ... 359
APPENDIX D ... 367
BA YESIAN MODELLING DETAILS AND SETTINGS ... 367
APPENDIX E ... 370
SUPPLEMENTARY ONLJNE JNFORMATJON FOR "PIGMENT CHARACTERIZATJON AS AN AL TERNATJVE TO INTERPRET ROCK ART SITES WHEN DA TING METHODS FAIL: THE CASE OF THE MIKINAK SITE, LAKE WAPIZAGONKE, QUEBEC, CANADA" APPENDIX F ... 377
XIV
A NOTE ON THE SAN NAME ORTHOGRAPHY ... 377 APPENDIX G ... 379 GENERAL MAP ... 379 APPENDIX H ... 38 1 ANALYSIS CATALOG ... 381 BIBLIOGRAPHY ... 382
Figure 1.1 Locations of some San groups of languages during the colonial period (modified from Lewis-Williams, 2003) ... 10
Figure 1.2 Stratigraphie correlations of Clarens Formation in the Main Karoo Basin (South Africa and Lesotho) and the Tuli Basin (Botswana) ... 20
Figure 1.3
Figure 1.4 2004)
Location of sites of the Maclear district.. ... 23
Black-and-white drawing of the primary panel at Storm Shelter (from Blundell, 24
Figure 1.5 Photo of the primary panel at Storm Shelter (© D.G. Pearce) ... 24
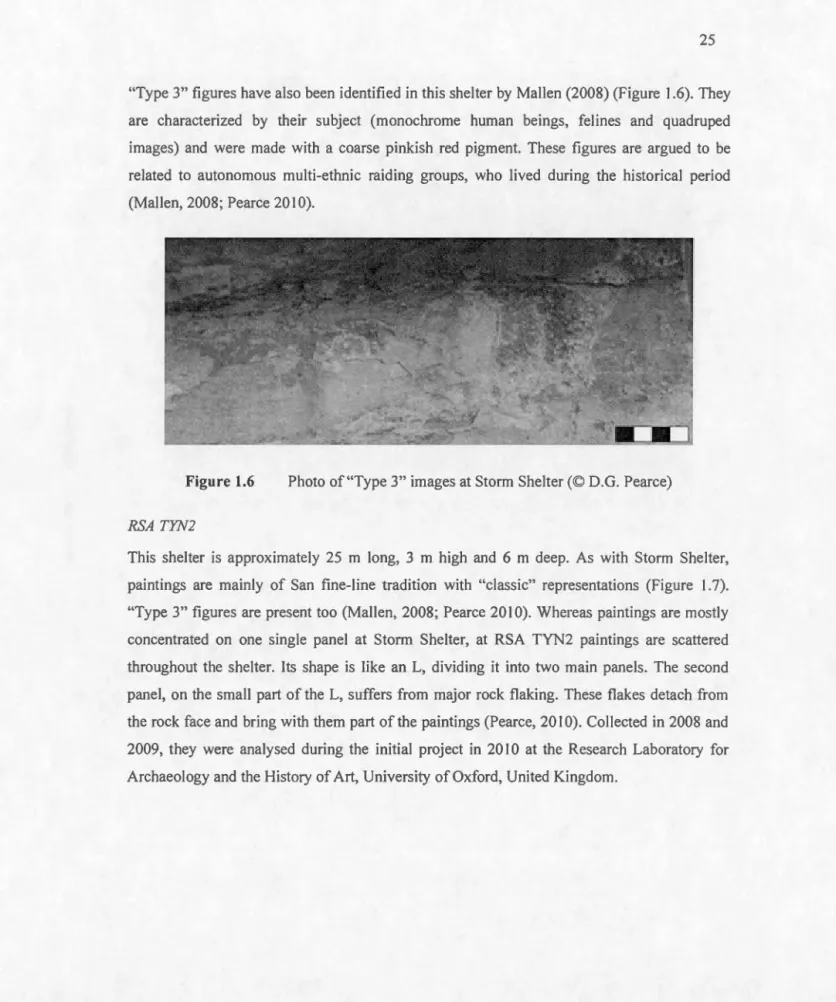
Figure 1.6 Photo of"Type 3" images at Storm Shelter (© D.G. Pearce) ... 25
Figure 1.7 Photo ofTYN2 shelter (©A. Bonneau) ... 26
Figure 1.8 Location of sites in the Metolong Dam area (sites are noted without the "ARAL" prefixes) ... 28
Figure 1.9 San fine-line tradition rock a11 at ARAL 258 (© D.G. Pearce) ... 29
Figure 1.10 Basotho tradition rock art at ARAL 254 (© D.G. Pearce) ... 29
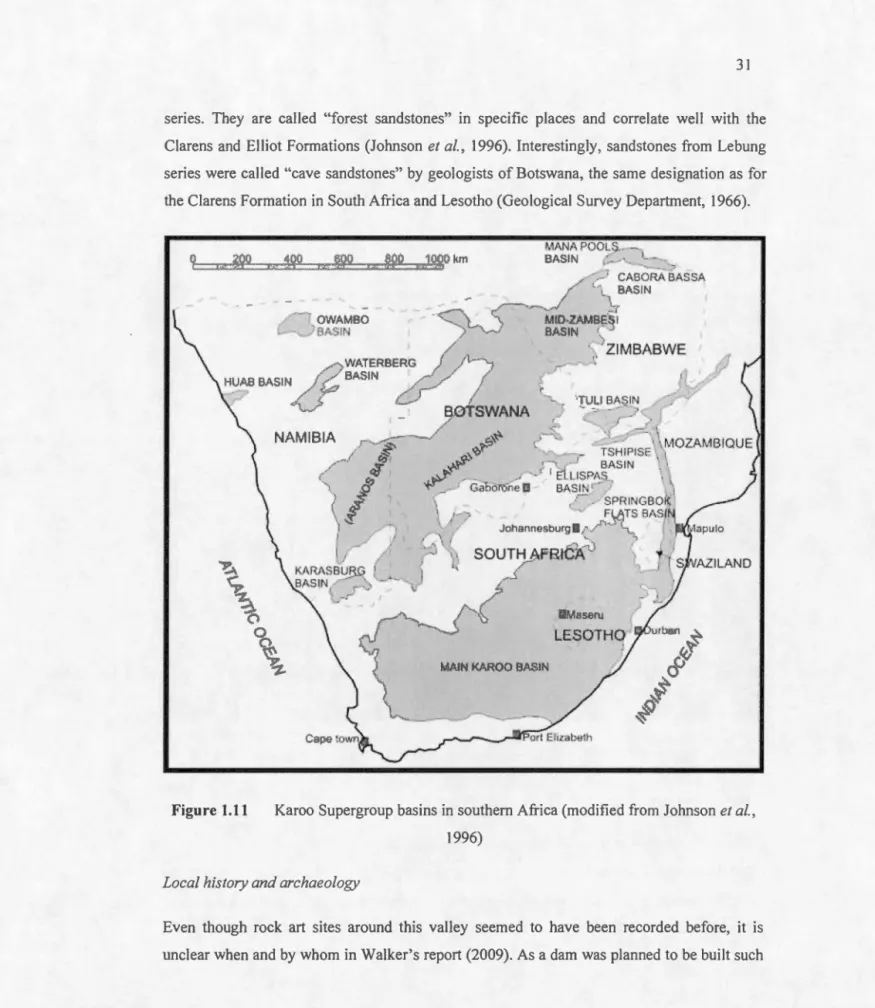
Figure 1.11 Karoo Supergroup basins in southern Africa (modified from Johnson et al.,
1996) 31
Figure 1.12 The Thune Dam (photo provided by local archaeologists) ... 32
Figure 1.13 Location of the Thune Dam a rea sites ... 33
XVI
Figure 1.15 Location of the Cliff Lake sites ... 42
Figure 1.16 Paintings at site 262 (© A.Bonneau) ... 43
Figure 1.17 Location of the Lake Wapizagonke ... 45
Figure 1.18 Rock art paintings at Lake Wapizagonke ... 46
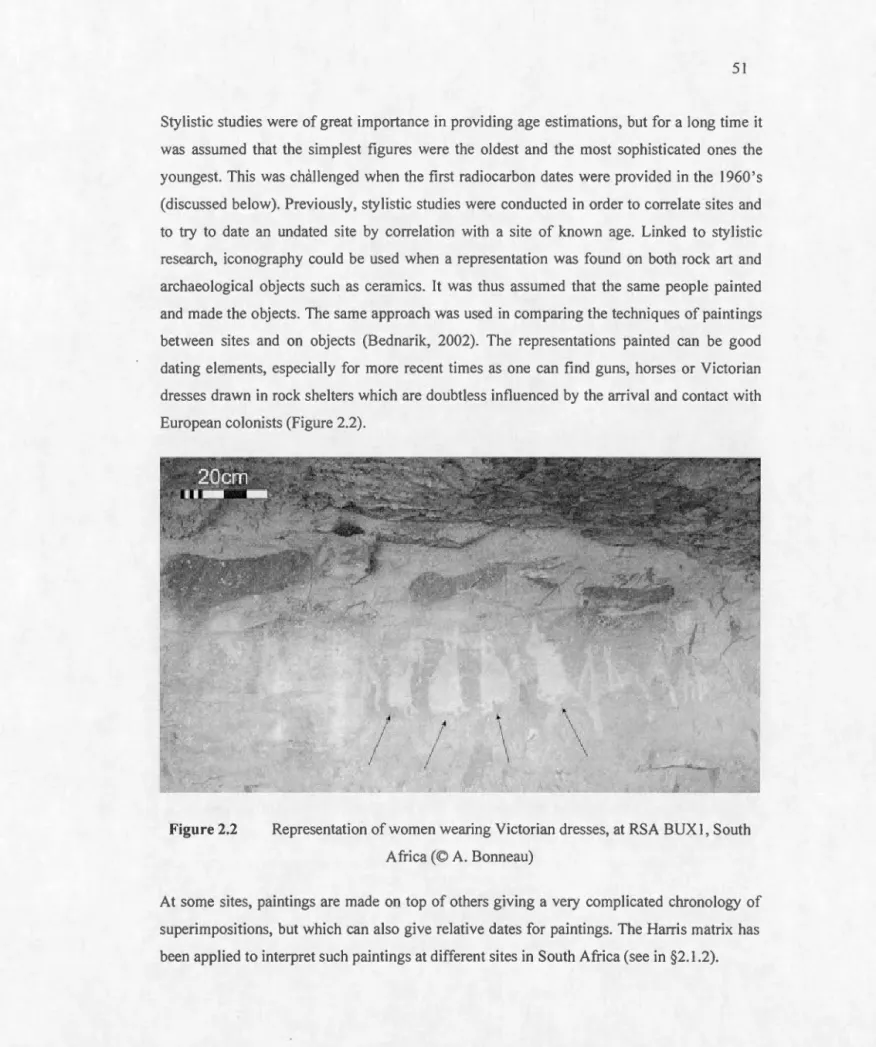
Figure 2.1 Graffiti in the Maclear district, South A frica (©A. Bonneau) ... 50 Figure 2.2 Representation of women wearing Yictorian dresses, at RSA BUX 1, South Africa (©A. Bonneau) ... 51 Figure 2.3 The effective dating ranges of some dating techniques, modified from Walker (2005) 59 Figure 2.4 The decay curve of radiocarbon (Equation details: R is 14C/12 C ratio in the sample, A is the original 14C/12C ratio of the 1 i ving organism and T is the amou nt of ti me th at has passed since the death ofthe organism) ... 61 Figure 2.5 Schema of a "very sm ali graphite" reactor rig ... 63
Figure 2.6 Schematic diagram of an AMS, modified from Walker (2005) ... 65
Figure 2.7 Illustration ofthe luminescence process, modified from Duller (2008) ... 67
Figure 2.8 Evolution of the luminescence signal in a sam pie, modified from Aitken ( 1998) 67 Figure 2.9 Working hypothesis ... 68
Figure 2.10 Scheme of the mounting for rock cores preparation (the sizes of the rock core and vice were deliberately amplified) ... 70
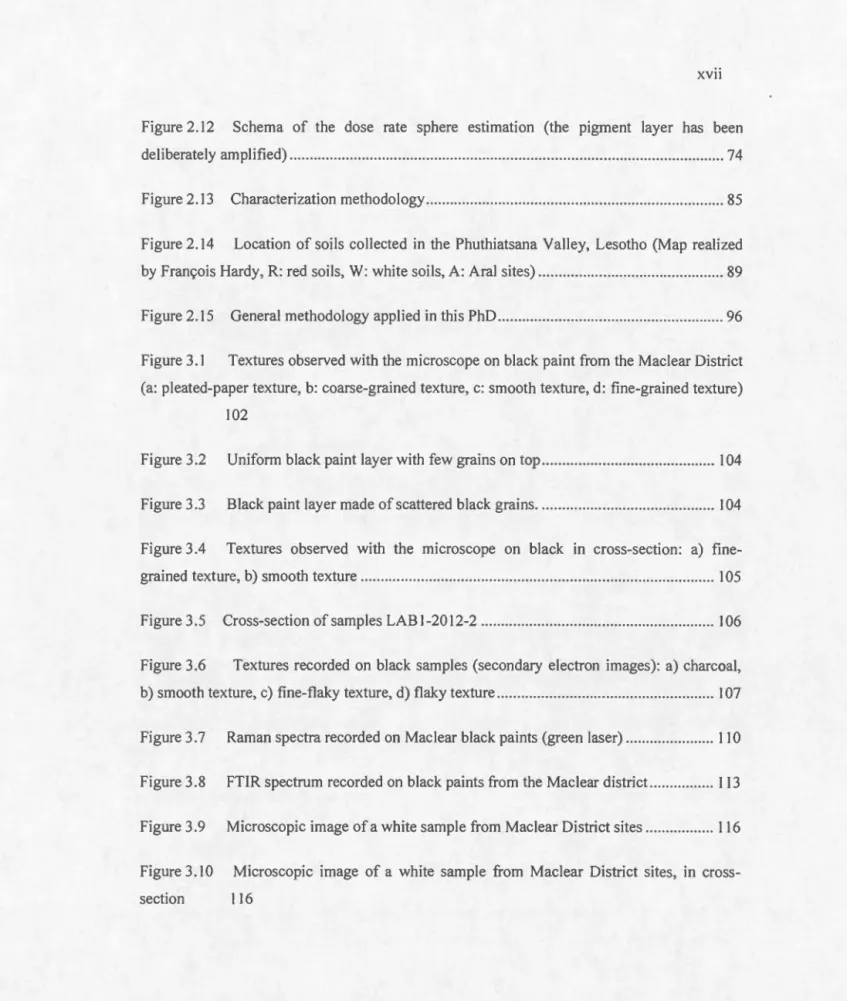
Figure 2.12 Schema of the dose rate sphere estimation (the pigment layer has been del iberately am pl ified) ... 74
Figure 2.13 Characterization methodology ... 85
Figure 2.14 Location of soils collected in the Phuthiatsana Valley, Lesotho (Map realized by François Hardy, R: red soils, W: white soils, A: Aral sites) ... 89
Figure 2.15 General methodology applied in this PhD ... 96
Figure 3.1 Textures observed with the microscope on black paint from the Maclear District (a: pleated-paper texture, b: coarse-grained texture, c: smooth texture, d: fine-grained texture)
102
Figure 3.2 Unifonn black paint layer with few grains on top ... 104
Figure 3.3 Black paint layer made of scattered black grains ... 1 04
Figure 3.4 Textures observed with the microscope on black in cross-section: a) fin e-grained texture, b) smooth texture ... 105
Figure 3.5 Cross-section of sam pies LAB 1-2012-2 ... 106
Figure 3.6 Textures recorded on black samples (secondary electron images): a) charcoal, b) smooth texture, c) fine-tlaky texture, d) tlaky texture ... 107
Figure 3.7 Raman spectra recorded on Maclear black paints (green laser) ... 1 10
Figure 3.8 FTIR spectrum recorded on black paints from the Maclear district. ... 113
Figure 3.9 M icroscopic image of a white sample from Maclear District sites ... 1 16
Figure 3.10 Microscopie image of a white samp1e from Maclear District sites, in cr oss-section 116
XVIII
Figure 3.11 Textures and EDS spectra recorded on white samples from Maclear District sites (Au, Pd, and C peaks are from coating) ... 117
Figure 3.12 Elemental maps recorded on sample LAS 1-2012-9 in cross-section ... 118
Figure 3.13 Raman spectra recorded on white paints from Maclear District.. ... 1 19
Figure 3.14 FTI R spectra recorded on white paints from Maclear District sites ... 120
Figure 3.15 Microscopie images of a red sample from Maclear District sites ... l21
Figure 3.16 Microscopie images of a red sample from Maclear District sites, in cross -section 122
Figure 3.17 SEM images of the texture of red sam pies from the Maclear District (secondary electrons): a) MEL6P2, b) MEL9P3 ... 123
Figure 3.18 MEL9P3 Figure 3.19 Figure 3.20 Figure 3.21 Figure 3.22
Elemental maps recorded on red sample from Maclear sites: a) MEL6P2, b) 124
Raman spectrum recorded on M EL6P2 ... 125
Raman spectrum recorded on M EL9P3 ... 126
FTIR spectrum recorded on a red sample from Maclear sites ... 127
Elemental maps recorded on cross-section, revealing weathering crusts layers 129
Figure 3.23 Raman spectra of weathering products recorded on paintings from Maclear District sites 129
Figure 3.24 Gypsum fou nd at the surface of Clarens Formation sandstone in Lesotho ... 132
Figure 3.25 Textures observed on cross-sections on samples from the Phuthiatsana Valley: left) fïne-grained texture, right) coarse-grained texture ... 135
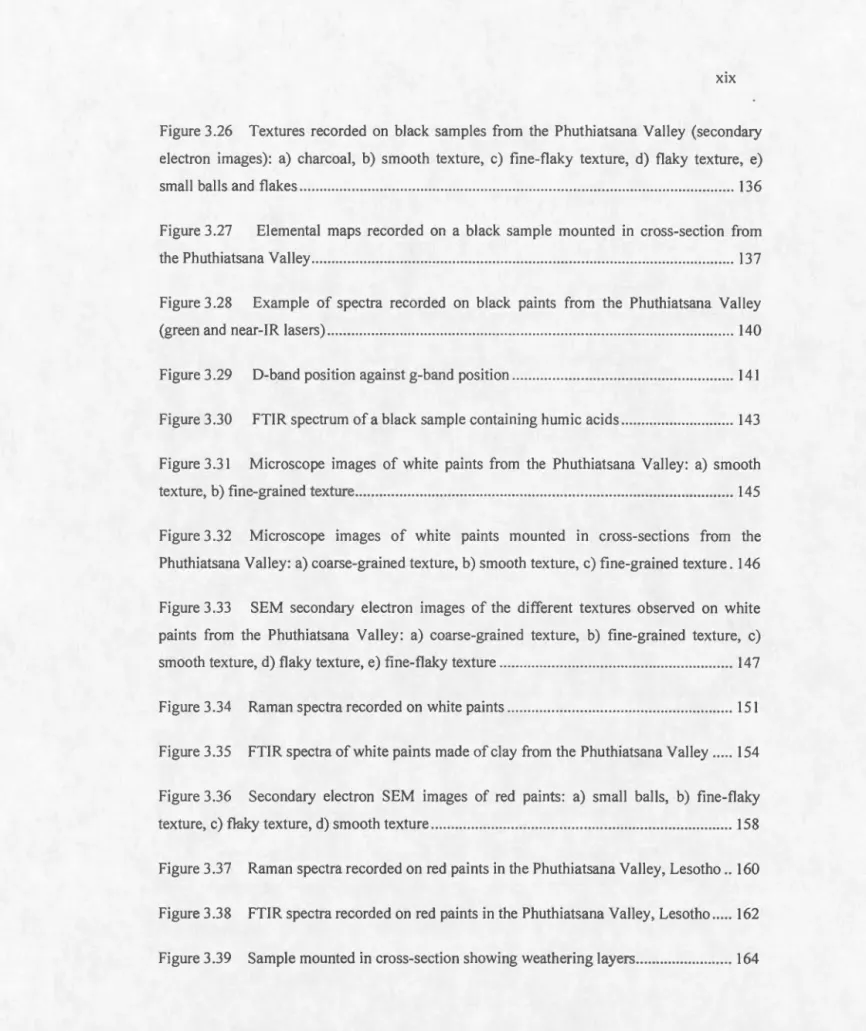
Figure 3.26 Textures recorded on black samples from the Phuthiatsana Valley (secondary electron images): a) charcoal, b) smooth texture, c) fïne-flaky texture, d) flaky texture, e) small balls and flakes ... 136
Figure 3.27 Elemental maps recorded on a black sam pie mounted in cross-section from the Phuthiatsana Valley ... 137
Figure 3.28 Example of spectra recordecl on black paints from the Phuthiatsana Valley (green and near-IR lasers) ... 140
Figure 3.29 D-band position against g-band position ... 141
Figure 3.30 FTIR spectrum of a black sample containing humic acids ... 143
Figure 3.31 Microscope images of white paints from the Phuthiatsana Valley: a) smooth texture, b) fïne-grained texture ... 145
Figure 3.32 Microscope images of white paints mounted in cross-sections from the Phuthiatsana Valley: a) coarse-grained texture, b) smooth texture, c) fïne-grained texture. 146
Figure 3.33 SEM secondary electron images of the different textures observed on white paints from the Phuthiatsana Valley: a) coarse-grainecl texture, b) fïne-grained texture, c) smooth texture, d) flaky texture, e) fïne-flaky texture ... 147
Figure 3.34 Raman spectra recorded on white paints ... 151
Figure 3.35 FTIR spectra of white paints made of clay from the Phuthiatsana Valley ... 154
Figure 3.36 Secondary electron SEM images of red paints: a) small balls, b) fïne-flaky texture, c) flaky texture, d) smooth texture ... 158
Figure 3.37 Raman spectra recorded on red paints in the Phuthiatsana Valley, Lesotho .. 160
Figure 3.38 FTIR spectra recorded on red paints in the Phuthiatsana Valley, Lesotho ... 162
xx
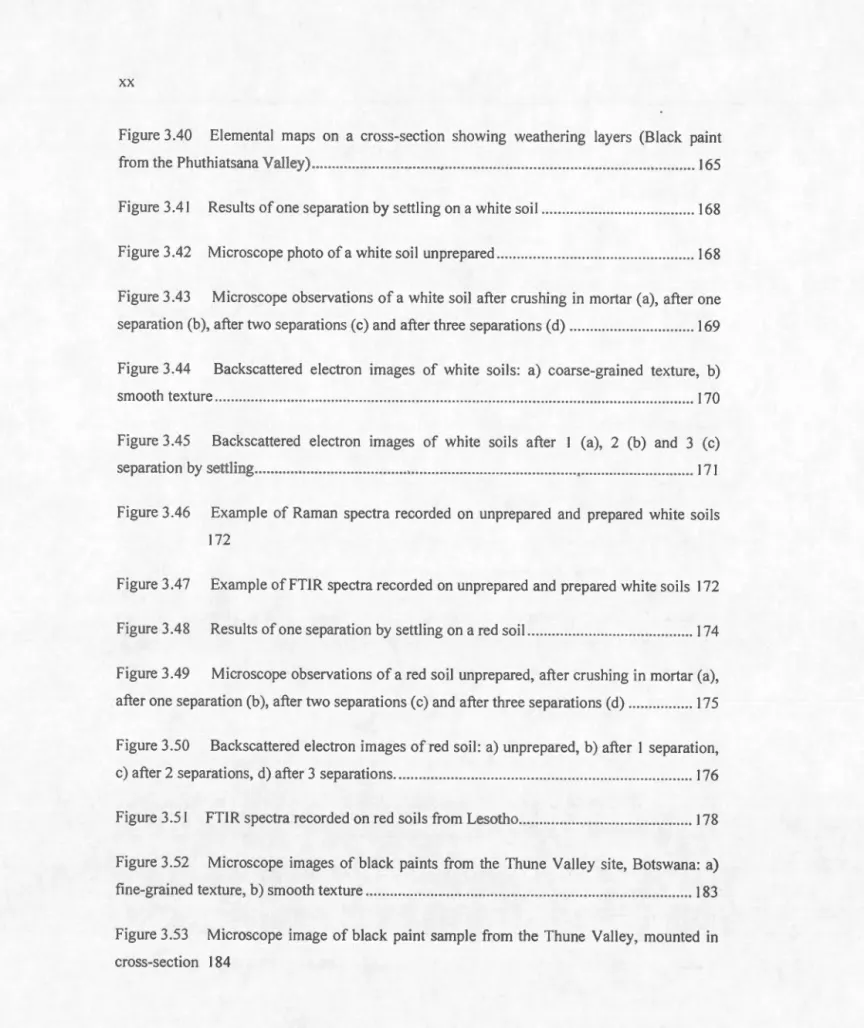
Figure 3.40 Elemental maps on a cross-section showing weathering layers (Black paint from the Phuthiatsana Valley) ... 165
Figure 3.41 Results of one separation by settling on a white soi! ... 168
Figure 3.42 Microscope photo of a white soi! unprepared ... l68
Figure 3.43 Microscope observations of a white soi! after crushi ng in mortar (a), after one separation (b), after two separations (c) and after three separations (d) ... 169
Figure 3.44 Backscattered electron images of white soils: a) coarse-grained texture, b) smooth texture ... 170
Figure 3.45 Backscattered electron images of white soils after 1 (a), 2 (b) and 3 (c) separation by settling ... 171
Figure 3.46 Example of Raman spectra recorded on unprepared and prepared white soils 172
Figure 3.47 Example of FTIR spectra recorded on unprepared and prepared white soils 172
Figure 3.48 Results of one separation by settling on a red soi! ... J 74
Figure 3.49 Microscope observations of a red soi! unprepared, after crushing in mortar (a), after one separation (b ), after two separations ( c) and after three separations ( d) ... 175
Figure 3.50 Backscattered electron images of red soi!: a) unprepared, b) after 1 separation, c) after 2 separations, d) after 3 separations ... 176
Figure 3.51 FTIR spectra recorded on red soils from Lesotho ... 178
Figure 3.52 Microscope images of black paints from the Thune Valley site, Botswana: a) fïne-grained texture, b) smooth texture ... 183
Figure 3.53 Microscope image of black paint sample from the Thune Valley, mounted in cross-section 184
Figure 3.54 Textures recorded on black samples from the Thune Valley (secondary electron images): a) smooth texture, b) sm ali balls, c) fi ne-fla ky texture, d) fla ky texture .. 185
Figure 3.55 Elemental map on a black paint from the Thune Valley, mounted in cross-section 186
Figure 3.56 Raman spectra recorded on black paints from the Thune Valley sites, Botswana 187
Figure 3.57 FTIR spectra recorded on black paints from the Thune Valley sites, Botswana 189
Figure 3.58 Microscope observations of weathering products 1n black samples from the Thune Valley sites, Botswana: a) unprepared, b) cross-section ... 190
Figure 3.59 Elemental maps on a black paint from the Thune Valley sites, mounted in cross-section 1 91
Figure 3.60 Schematic cross-section of paintings analysed in South Africa, Lesotho and Botswana 197
Figure 4.1 a) D-band Raman peaks plotted against G-band Raman peaks for distinction between soot, charcoal and carbon-blacks (samples from Lesotho; the final identification of the paint was obtained by SEM observations); (b) Principal component analysis of the same samples obtained from D-band position, G-Band position, Area ratio, and lntensity ratio (analysis carried out with JMP) ... 206
Figure 4.2 Five different morphologies for carbon-based samples recorded in this thesis (Secondary electron SEM observation) ... 208
Figure 4.3 Weight of calcium oxalates dissolved against ti me in three different conditions (plots include uncertainties) ... 212
xxii
Figure 4.5 Sam pie selection and pre-treatment protocol. ... 216
Figure 4.6 Pa inti ngs bef ore and a ft er collection for radiocarbon dating ... 217
Figure 4. 7 Figures dated at site TD2, Botswana ... 221
Figure 4.8 Bayesian modelling for dates obtained at TD2 ... 222
Figure 4.9 Figures dated at site TD 12, Botswana ... 223
Figure 4.10 Bayesian modelling of dates obtained at TD 12 ... 224
Figure 4.1 1 Figures dated at site TD21, Botswana ... 225
Figure 4.12 Bayesian modelling of dates obtained in the Thune Valley (three contiguous phases) 227
Figure 4.13 Bayesian modelling of date obtained in the Thune Valley (four contiguous phases) 228
Figure 4.14 Bayesian modelling of dates obtained in the Thune Valley (five contiguous phases) 229
Figure 4.15 Figure dated at site ARAL 171, Lesotho ... 233
Figure 4.16 Figure dated at site ARAL 172 ... 234
Figure 4.17 Figures dated at site ARAL 175, Lesotho ... 235
Figure 4.18 Bayesian modelling of dates obtained at ARAL 175 ... 236
Figure 4.19 Figure dated at site ARAL 249, Lesotho ... 237
Figure 4.20 Figures dated at site ARAL 252, Lesotho ... 238
Figure 4.22 Figures dated at site RSA FRE4, South Africa ... 244
Figure 4.23 Figures dated at site RSA LAB 1, South Africa ... 246
Figure 4.24 Cross-section of LAB l-C2 (sam pie retaken in 20 12), light microscope image. 247
Figure 4.25 Figure dated at site RSA LAB7, South Africa ... 249
Figure 4.26 Figures dated at site RSA PRH 1, South Africa ... 250
Figure 4.27 Figures and painted flakes dated at site RSA TYN2, South Africa ... 252
Figure 4.28 Bayesian modelling of dates obtained at RSA TYN2 ... 253
Figure 4.29 Bayesian modelling of dates obtained at RSA TYN2, second possibility ... 254
Figure 5.1 Example of OSL signal recorded for Cliff Lake quartz ... 265
Figure 5.2 Decay ofOSL signal in quartz to daylight exposure ... 268
Figure 5.3 Thermal transfer recorded on Lesotho and South African quartz sam pies ... 269
Figure 5.4 Dose recovery ratios (20 Gy) for Lesotho and South African rocks ... 272
Figure 5.5 Equivalent doses obtained for a range of preheat temperatures for Lesotho and South African rocks ... 272
Figure 5.6 Dose recovery ratios (2 Gy) for Lesotho and South African rocks ... 273
Figure 5.7 Equivalent doses obtained for a range of preheat temperatures for Lesotho and South African rocks ... 274
Figure 5.8 Decay of IRSL signal in K-feldspars to daylight exposure (symbols include en·ors) 276
XXIV
Figure 5.10 Thermal transfer for Lesotho and South A fr ica K-feldspars with the modified sequence 278
Figure 5.11 Thermal transfer estimation using SARA: Right = South African rock; Left = Lesotho rock (symbols include errors) ... 279
Figure 5.12 Dose recovery ratios obtained with sequence type 1 ... 281
Figure 5.13 Dose recovery ratios with thermal transfer subtracted (Sequence type 1) ... 282
Figure 5.14 Dose recovery ratios obtained with sequence type 2 ... 282
Figure 5.15 Dose recovery ratios with thermal transfer subtracted (Sequence type 2) ... 283
Figure 5.16 lRSL profile in the rock from RSA LABl (logarithmic scale, symbols include errors, no thermal transfer subtracted) ... 286
Figure 5.17 Ln-Tn profiles of transects ta ken from rock face close to paintings from sites Aral 172 and Aral 175 (the red 1 ine represents the thermal trans fer leve! observed for the
rock) 288
Figure 5.18 Equivalent dose transects of cores taken from rock face close to paintings from sites Aral 172 and Aral 175 (thermal transfer subtracted) ... 289
Figure 5.19 Photo of the painted rock from RSA MEL8 ... 291
Figure 5.20 Ln/Tn transects of cores with painted surfaces (RSA MEL8, Test dose: 1 Gy, symbols include en·ors) ... 292
Figure 5.21 Equivalent doses transects of cores with painted surfaces (RSA MEL8). Pro fi les were reconstructed by dot 1 ines; symbols include errors ... 293
Figure 5.22 Ln-Tn transect of core n° 1 from the painted part of rock from Aral 172 ... 294
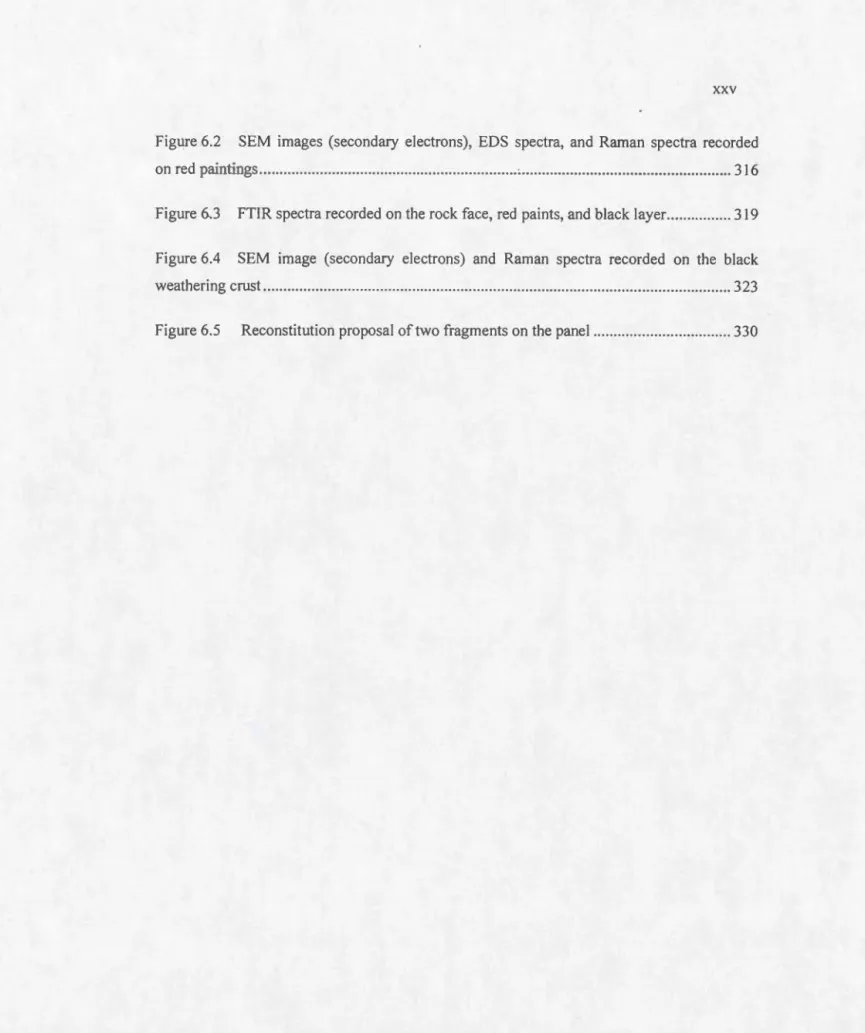
Figure 6.2 SEM images (secondary electrons), EDS spectra, and Raman spectra recorded on red paintings ... 316
Figure 6.3 FTIR spectra recorded on the rock face, red paints, and black layer. ... 319
Figure 6.4 SEM image (secondary electrons) and Raman spectra recorded on the black weathering crust ... 323
Figure 6.5 Reconstitution proposai oftwo fragments on the panel ... 330
-Table 1.1 Abridged geological succession of the Cape and Karoo Supergroups (modified from Maud, 2008) ... 19
Table 0.1 List of paint sam pies collected and studied in this thesis ... 87
Table 3.1 FTJR spectroscopy peaks and their interpretations ... 99
Table 3.2 Raman spectroscopy peaks and the ir interpretations ... 1 00
Table 4.1 Radiocarbon ages obtained in the Thune Valley, Botswana ... 219
Table 4.2 Radiocarbon ages obtained on sites in the Phuthiatsana Valley, Lesotho ... 231
Table 4.3 Radiocarbon ages obtained on sites in the Maclear district, South Africa ... 241
Table 5.1 Minerais and their grain size selected for each area studied ... 262
Table 5.2 Sequence used for quartz sensitivity ... 264
Table 5.3 Sequence applied for bleaching tests on quartz ... 267
Table 5.4 Thermal transfer sequence for quartz ... 269
Table 5.5 Dose recovery sequences for quartz ... 271
Table 5.6 Sequence applied for bleaching tests on K-feldspars ... 275
Table 5.7 Thermal transfer sequence on K-feldspars ... 276
Table 5.8 Modified thermal transfer sequence on K-feldspars ... 278
Table 5.9 Sequences applied for dose recoveries on K-feldspars ... 280
xxviii
Table 5.11 Example of a modified SAR sequence for Ris0 (test doses and regenerative doses vary depending on the depth in the core) ... 287
Table 5.12 Gamma spectrometry results and dose rate calculations for rocks ... 297
Table 5.13 Cosmic dose rates for sites studied ... 299
Table 5.14 Gamma spectrometry results and dose rate calculations for Lesotho soils .. 300
Table 5.15 Pigment ARAL 172-2012-10 dose rate calculation ... .300
Table 5.16 Final dose rates (CL= Cliff Lake, LW= Lake Wapizagonke) ... .302
AMS: Accelerator Mass Spectrometry
A TR: Attenuated Total Reflection
14
C: Radiocarbon
CF-JRMS: Continuous-Fiow Isotope Ratio Mass Spectrometry
EA-IRMS: Elemental Analysis Isotope Ratio Mass Spectrometry
FTIR spectroscopy: Fourier Transform lnfraRed spectroscopy
GC: Gas Chromatography
HCI: Hydrochloric acid
HF: Hydrofluoric acid
JCP-MS: lnductively Coupled Plasma Mass Spectrometry
!RSL: InfraRed Stimulated Luminescence
K-feldspars: Potassium feldspars
LA-I CP-MS: Laser Ablation lnductively Coupled Plasma Mass Spectrometry
LH-SDFs: Large Headed- Significantly Differentiated Figures
MC-ICP-MS: Multi-Collector lnductively Coupled Plasma Mass Spectrometry
NaOH: Sodium hydroxide
xxx
OSL: Optically Stimulated Luminescence PIGE: Particle-lnduced Gamma-ray Emission
PIXE: Pa11icle-lnduced X-ray Emission
RLAHA: Research Laboratory for Archaeology and the History of Art
RARI: Rock A11 Research lnstitute
SEM-EDS: Scanning Electron Microscopy Energy Dispersive X-ray Spectrometry
SPT: Sodium Polytungstate U-series: Uranium series
XRD: X-Ray Diffraction XRF: X-Ray Fluorescence
Rock art exists ail around the word. lt is thought to be one of the most ancient expressions of the human mind. The artist, who created these paintings, opens a window into its world and gives the viewer a unique insight into its motivation and inspiration. Over the last 20 years or so, developments in the application of chem ical, physical and geological methods have made it possible to recover the recipes used by ancient painters as weil as to determine the age of the art itself. The interpretation of ancient rock art from around the world has been considerably aided by the acquisition of such data. However, there is stiJl much to do. Palaeol ithic rock art in Europe and Austral ia were the main beneficiaries of these developments. ln other parts of the world, such as southern Africa and Canada, few dates have been obtained, and little in the way ofpaint characterisation studies exists.
This Ph.D. project explores direct dating of rock art from sites in southern Africa and in the Canadian Shield, using radiocarbon and optically stimulated luminescence. lt introduces a new preliminary detailed characterisation of the sam pie to be dated, which makes it possible to select the samples which are the most likely to be successfully dated. Moreover, it reduces the necessary size of the sample. Using complementary instrumentation and methods, the characterisation results bring relative dating information if linked with superpositioning information, and where no superpositioning exists, or information is not available, they can give elues as to the composition and history of a panel or a site.
Characterisation reveals the type of carbon-based paint used, which can then be radiocarbon dated, for example, charcoal, soot, or carbon-blacks. This information is essential for understanding the age obtained. At the same time, this characterisation records the presence and estimates the proportions of radiocarbon contaminants in the samples, such as calcium oxalates, calcium carbonates and humic acids. A chemical pre-treatment can then be adapted to dissolve ail the contaminants detected, checked with Fourier-Transform Infra-Red (FTIR) analysis. Using these methods, 46 dates were obtained on rock art sites from southern A frica. These include the first ever dates from rock art in Lesotho and in Botswana and constitute the largest da ting project on rock mt ever undertaken in this pa1t of the world.
Optically stimulated luminescence (OSL) cannat give a definitive date for rock a1t, but the experiments carried out for this project proved that this technique may be applied under specifie conditions: where the rock supp01t is suitable for OSL dating, given a thick paint layer and sufficient exposure of the rock face to daylight.
ln the Canadian Shield, none of the dating methods was applicable. However, the precise characterisation conducted on the paints reveals different paint recipes in the same site giving new elues to reconstruct some parts ofthe "chaîne opératoire" of the site.
xxxii
Characterisation of paint and dates obtained in this project make it possible to start developing a dialogue between the archaeological record of hunter-gatherer activity preserved in paint and that preserved in occupational deposits.
Keywords: San Rock Art, Canadian Shield rock art, pain! characterization, Radiocarbon dating, OSL dating.
L'art rupestre est présent dans le monde entier. Il est 1 'une des plus anciennes manifestations artistiques de l'être humain. L'artiste qui a créé ces peintures ouvre une fenêtre sur son monde et plonge son spectateur dans un aperçu sans égale de sa motivation et de son inspiration. Au cours des 20 dernières années, l'utilisation de méthodes empruntées aux sciences chimiques, physiques, et géologiques a permis de redécouvrir les recettes des artistes ainsi que de déterminer l'âge de cet art. L'interprétation de l'art rupestre de par le monde s'est considérablement enrichie grâce à l'acquisition de telles informations. Néanmoins, il y a encore beaucoup à faire. L'a tt pariétal paléolithique européen ou 1 'ait rupestre d'Australie ont été les principaux bénéficiaires de ces développements. Dans d'autres parties du monde, comme en Afrique australe et au Canada, très peu de dates ont été obtenues et peu a été fait concernant la caractérisation des peintures rupestres.
Cette thèse de doctorat explore la datation directe de 1 'art rupestre présent sur des sites en Afrique australe et dans le Bouclier Canadien, en utilisant le radiocarbone et la luminescence stimulée optiquement (OSL). Elle introduit une nouvelle étape de caractérisation préliminaire et détaillée de l'échantillon, permettant de sélectionner ceux qui seront le plus à-même d'être datés par le radiocarbone, tout en réduisant la quantité d'échantillon nécessaire à cette datation. En utilisant des méthodes et instruments complémentaires, la caractérisation couplée à des données sur la superposition des figures, apporte tout d'abord des informations de datation relative, et quand celles-ci n'existent pas ou ne sont pas disponibles, elle donne des indices quant à la composition et à l'histoire d'un panneau ou d'un site.
La caractérisation révèle entre autre le type de pigment à base de carbone utilisé, pouvant être daté par le radiocarbone comme par exemple, le charbon, la suie ou le noir de carbone. Cette information est essentielle à la compréhension de 1 'âge obtenu. Dans le même temps, cette caractérisation détermine la présence et estime les proportions des pollutions pouvant compromettre la datation par le radiocarbone comme les oxalates de carbone, les carbonates de calcium ou les acides humiques. Le prétraitement chimique est par la suite adapté pour dissoudre toutes les pollutions détectées, dissolution vérifiée par des analyses en spectroscopie infrarouge à transformée de Fourier (FTJR). A partir de ces protocoles, 46 dates ont été obtenues sur des sites rupestres d'Afrique australe. Elles comportent les premières dates obtenues sur des sites au Lesotho et au Botswana et constituent le plus grand projet de datation de 1 'art rupestre jamais entrepris dans cette partie du monde.
La luminescence stimulée optiquement n'a pas permis de donner un âge fini pour l'art rupestre mais les expérimentations réalisées durant cette thèse ont montré que cette méthode pourrait être appliquée dans des conditions spécifiques : roche avec des minéraux sensibles à
XXXIV
la luminescence, recouverte d'une épaisse couche de peinture, et ayant été suffisamment exposée à la lumière du soleil.
Dans le Bouclier Canadien, aucune méthode de datation n'a pu être appliquée. Cependant, une caractérisation détaillée des peintures a montré que différentes recettes de peinture ont été utilisées sur un même site apportant de nouvelles informations pour reconstituer la chaîne opératoire de ces sites.
La caractérisation des peintures et les âges obtenus dans cette thèse permettent de commencer à développer un dialogue entre l'activité des peuples ayant réalisés ces peintures sur les sites rupestres et dans les dépôts archéologiques.
Mots clés : Art rupestre San, Art rupestre du Bouclier Canadien, caractérisation de peintures, datation par le radiocarbone, datation par OSL.
Rock art is thought to be one of the most ancient expressions of the hu man mi nd. It gives the viewer a unique insight into the motivation and inspiration of the artist who painted it, and opens a window into their world. The interpretation of ancient rock art from a round the world has been aided considerably over the last 20 years orso by developments in the application of chemical, physical and geological methods. These developments have made it possible to recover the recipes used by ancient painters as weil asto determine the age of the art itself. This being said, there is stiJl much to do. Although Palaeolithic rock art in Europe and Australia has been extensively recorded and studied, in other parts of the world, such as southern Africa and Canada, few dates have been obtained, and little in the way of paint characterisation studies exists. However, this type of information is vital if archaeologists are to interpret these sites in proper context. This thesis asks the following questions: Is it possible to apply similar dating and characterisation methods to rock art sites in southern A fr ica and Canada? Do they need to be specifically adapted? What improvements are required in order to extract further information from these sites and to improve the reliability of dating and characterisation studies?
This Ph.D. project uses a well-known dating method, radiocarbon dating, and an unconventional one in the field of rock art study, optically stimulated luminescence (OSL). These techniques are mobilised to directly date rock art sites in southern Africa and the Canadian Shield. However, to apply these methods, specifie compounds need to be present in the samples, namely carbon in the case of radiocarbon and quartz and feldspars in the case of OSL. But their presence is not enough to geta reliable date, their link with the event to date and to the paintings should be weil understood. To assess this question, a preliminary geochemical characterization of the· paint, its environment and its alterations is introduced. This preliminary step makes it possible to choose the appropriate sample to be dated and to adapt the dating method accordingly. Moreover, it proves to be efficient at providing some details how rock art was made at a site, namely, its chaine opératoire.
2
This project is the continuation of an initial project carried out in 2010 at the Research
Laboratory for Archaeology and the History of Att (RLAHA) at the University of Oxford,
United Kingdom, in collaboration with the Rock Art Research lnstitute (RARI), at the University of the Witwatersrand, Johannesburg, South Africa. ln this initial project,
undertaken as part of my ma ter's degree final internship, detached painted flakes were
characterized and dated. Results were published in Radiocarbon and Journal of Archaeological Science (Bonneau et al., 201 1, 20 12), and formed the basis of this subsequent
PhD project. The aim of this thesis is to improve the previously established protocols to produce reliable results on a range of various site environments, hence the selections of sites in southern Africa and in the Canadian Shield.
The form of the thesis is as follows: firstly, a presentation of the sites, the ir geology and the ir archaeological contexts is given in chapter 1. Chapter Il is dedicated to the different methods and instrumentations chosen and applied. Chapter Il 1 deals with characterisation of the paintings, their environment and alteration, which is the first step prior to choosing a sample and a dating method. Chapters IV and V detail respectively radiocarbon and OSL methods with tests to adjust them to each sample. Chapter VI shows not only that dating methods can inform understanding of the processes that go into the creation of a rock painting, but that characterisation of the paints is an essential tool too. This chapter is in the form of an article submitted to the journal Archaeometly and in press. Two other articles were extracted of this work, submitted to Antiquily (Title: Direct dating reveals earliest evidence for parietal rock att in southern Africa) and Radiocarbon (Title: Successfully dating rock art in southern A frica using improved sampling methods and new characterization and pretreatment protocols), and are in press.
L'art rupestre est considéré comme l'une des expressions les plus anciennes de l'esprit humain. JI donne au spectateur un aperçu unique sur la motivation et l'inspiration de l'altiste qui l'a peint, et ouvre une fenêtre sur son monde. L'interprétation de 1 'art rupestre de par le monde s'est considérablement enrichie au cours des 20 dernières années grâce à l'utilisation de méthodes empruntées aux sciences chimiques, physiques, et géologiques. Celles-ci ont permis de redécouvrir les recettes des a1tistes ainsi que de déterminer 1 'âge de cet art. Néanmoins, il y a encore beaucoup à faire. Si l'ait pariétal paléolithique européen ou l'ait rupestre d'Australie ont été largement référencés et étudiés, dans d'autres parties du monde, comme en Afrique australe et au Canada, très peu de dates ont été obtenues et peu d'études ont été réalisées concernant la caractérisation des peintures rupestres. Cependant, ces informations sont essentielles pour permettre aux archéologues d'interpréter les sites rupestres dans un contexte approprié. Cette thèse de doctorat pose les questions suivantes: Est-il possible d'appliquer des méthodes de datation et de caractérisation similaires à celles utilisées en Europe ou en Australie, à des sites rupestres en Afrique australe et au Canada? Ont-elles besoin d'être adaptées aux spécificités rencontrées sur ces sites? Quelles améliorations sont nécessaires afin d'extraire plus d'informations à partir de ces sites et d'améliorer la fiabilité de la datation et de la caractérisation de ces sites?
Ce projet de doctorat utilise une méthode de datation bien connue, la datation par le radiocarbone, et une moins conventionnelle dans le domaine de l'étude de l'art rupestre, la luminescence stimulée optiquement (OSL). Ces techniques sont utilisées pour dater directement les sites d'ait rupestre en Afrique australe et dans le Bouclier Canadien. Néanmoins, pour appliquer ces méthodes, il est nécessaire que les échantillons (ici les peintures ou la roche support) soient composés d'éléments spécifiques que sont le carbone pour la datation par le radiocarbone et les quartz et les feldspaths pour 1 'OSL. Mais leur présence n'est pas suffisante, il faut encore comprendre leur relation avec l'événement à dater (c'est-à-dire la date de la peinture) et avec la peinture elle-même. Pour répondre à ces
4
interrogations, une étape préliminaire de caractérisation géochimique de la peinture, de son environnement et de ses altérations a été introduite. Cette étape préliminaire permet de choisir l'échantillon le plus approprié pour être daté et d'adapter la méthode de datation en conséquence. En outre, cette étape de caractérisation se révèle être efficace pour fournir des détails sur la réalisation d'un site rupestre, à savoir, sa chaîne opératoire.
Ce projet se trouve dans la continuité d'une étude pré! iminaire réalisée en 2010 au Research Laboratory for Archaeology and the History of Art (RLAHA), Université d'Oxford, Royaume-Uni, en collaboration avec le Rock Art Research lnstitute (RARI), Université du Witwatersrand, Johannesburg, Afrique du Sud. Au cours de cette étude, entreprise dans le cadre de mon stage de fin d'études de master, des fragments de roche peints, détachés de la roche, ont été caractérisés et datés. Les résultats ont été publiés dans Radiocarbon et Journal of Archaeological Science (Bonneau et al., 201 1, 20 12). Ils forment la base de ce projet de thèse. Le but de cette thèse est d'améliorer les protocoles précédemment établis pour produire des résultats fiables, sur une large variété de sites avec des environnements différents, d'où la sélection de sites en Afrique australe et dans le Bouclier Canadien.
Cette thèse de doctorat s'organise de la façon suivante. Tout d'abord, une présentation des sites, de leur géologie et de leurs contextes archéologiques est faite dans le chapitre 1. Le chapitre II est consacré aux différentes méthodes et instrumentations choisies et utilisées. Le chapitre Ill traite de la caractérisation des peintures, de leur environnement et de leurs altérations. C'est ici l'étape préliminaire avant de choisir un échantillon et une méthode de datation. Les chapitres IV et V détaillent respectivement les tests réalisés pour la datation par le radiocarbone et pour la datation par OSL. Ces expérimentations ont permis d'ajuster chaque méthode à chaque échantillon. Le chapitre VI montre que, non seulement, les méthodes de datation peuvent apporter de l'information permettant la compréhension des processus qui entrent dans la création d'une peinture rupestre; mais également que la caractérisation des peintures est un outil essentiel à cette compréhension. Ce chapitre est sous la forme d'un article a été soumis à la revue Archaeomel!y et qui est actuellement sous presse. Deux autres articles ont été extraits de ce travail et soumis à la revue Antiquity (Titre : Direct dating reveals earliest evidence for parietal rock art in southern Africa) et à la revue Radiocarbon (Titre: Successfully dating rock art in southern Africa using improved
sampling methods and new characterization and pretreatment protocols). 1 ls sont actuellement sous presse.
DA TING ROCK ART: OBJECTIVES AND CHALLENGES IN SOUTHERN AFRICA AND THE CANADIAN SHIELD
Dating has always been one of the most common questions about rock ait. However, this question reveals severa! objectives and challenges depending on places and sites. In this chapter, differences between direct and indirect dating are explained, and objectives and challenges are detailed for the specifie areas studied, southern Africa and the Canadian Shield, with rock ait and specifie conditions pertaining to each presented.
1.1 Direct or indirect da ting of rock art: a terminological problem?
The aim of this PhD project is to direct! y date rock art. However, the definition of direct and indirect dating is different depending on the authors in question. A quick review of definitions in the literature is needed in order to be able to give the definition of direct dating which will be used for the purposes of this PhD.
In this paragraph, foc us is given on absolute da ting even if relative da ting has its own place in comprehension of rock art too, and will be used in the interpretation to complement the absolute dates obtained.
Bednarik ( 1996) gave two prerequisites to directly date rock art : "first, the physical relationship of the art and the dating criterion must be direct and indisputable; and second, the propositions concerning the chronological relationship of the rock art and the dating cri teri on should be falsifiable and testable" (Bednarik 1996: 1 ). If a date is obtained without these prerequisites, it is considered indirect. Using this definition, dates obtained on calcite or calcium oxalates crusts surrounding paintings are considered to be direct dating whereas the author argues that the use of the pigment itself cannot be a direct date as, in the case of charcoal, nobody can know how old the wood used was, if the pieces of wood were of the same age (coming from different trees), and ifit may have been contaminated later.
8
On the other hand, Pettitt and Pike (2007: 28) made a distinction between "direct dating", "indirect stratigraphie dating", "indirect associative dating" and "indirect architectural dating". ln this case, direct dating is the "dating of a sample of pigment[ ... ] that forms the art", whereas indirect stratigraphie dating is the "dating of the formation of a material [ ... ] that stratigraphically overlies an artistic panel". Indirect associative and architectural dating are respectively defined as the association of the cave art with datable material (artefacts found in the same cave), and as the "dating of the formation of a stratigraphie layer that apparent! y blacks access to a decorated cham ber". There is here a radical difference with Bednarik 's definition.
8oth points of views are arguable. However, they do not really take into account the question most interesting to archaeologists: when did the artists made these paintings? To talk about direct dating is to discuss the instance of painting. A direct date should reflect this moment in order to a void any misunderstanding. A good way to fi nd it is to use the paint itself or part of the paint. However, one needs to know when these parts were collected, from which vegetable/mineral species they derived, and if the dating technique used will reflect the date of collection, the date of death, or the date of use of the material. Finally, contamination due to exposure (whether to rain, sun, natural degradation, or just !ife at the site) should be taken into account. With this information, the date satisfies the two prerequisites of Bednarik and the definition of Pettitt and Pike. Radiocarbon and OSL dating were selected for this project. Reasons why the dates obtained with these techniques can be considered as direct dates are detailed in Chapter Il.
Obtaining direct dates of rock art is of great importance, but each world region is subject to its own challenges, problems and archaeological objectives. They are now detailed for the two studied regions: southern Africa and the Canadian Shield.
1 .2 San rock art
Jn southern A fr ica, rock art was produced by many different populations: San hunte r-gatherers (also called "Bushmen), Khoekhoe pastoralists and severa! different agropastoralist (farmer) groups, including the South Sotho. San rock art is the most common and will be detai led he re. Most of the sites selected for the project are of San rock art tradition but a few sites of Sotho tradition were also analysed (see § 1.2.3.2 for justifications).
1.2.1 Characteristics and history of research
San peoples have lived in southern Africa for many thousands of years, as indicated by genetic studies and the evidence of physical anthropology (Lewis-Williams and Pearce, 2004). Although today they are almost entirely confined to the Kalahari Desert, they were previously much more widely distributed. They survived in the Maloti-Drakensberg Mountains of Lesotho and South Africa until the end of the nineteenth century (Yinnicombe 1976). Note th at 'San' (a Khoekhoe term) is not a term they used to re fer to themselves: indeed, we know of no such term, but it is commonly agreed that the groups in question were linked by common languages (called "click languages"', see Figure 1.1) and beliefs but each group was independent from each other (Lewis-Williams, 2003).
1
10 ATLANTIC OCEAN Figure 1.l NAMIB lA SOUTH AFRICA BOTSWANA Glwi INDIAN OCEAN !Ko San group of language
9
1290
r=-!90
,
690
.
84lO
1 10qo km Locations of sorne San groups of languages during the colonial period(modified from Lewis-Williams, 2003)
There are stiJl San populations in South Africa, Namibia and Botswana, mostly confined in the Kalahari Desert. Using ethnographie data and historical records, it is possible to achieve sorne understanding of the spirituality and myths of the San. Their main divinity is known as 1/Kaggen. He is sometimes called the Mantis, but this is only one of his avatars. He can be a human, an eland (the South African antelope), or other kind of animais. He lives with his wife and children in the spirit world. ln San cosmology, the world is divided in three parts: the underground, the Earth (where people live) and the sky, with each part connected to the others. Thus spirits living in the sky or in the underground can interact with people and occasionally cause trouble (Lewis-Williams and Pearce, 2004). To "talk" to spirits, San made
rituals which were sometimes depicted m rock-shelters (details about San rock art interpretation are in § 1.2.2).
San hunter-gatherers created a large number of paintings throughout southern Africa which are characterized by the use of fine !ines, brush paintings, and detailed representational imagery (Lewis- Wi Il iams and Pearce, 2004). For centuries, the ir paintings were mysteries for which only the San themselves had keys.
When the first Europeans settlers arrived in South Africa, they considered the San to be savages, who were at best, pagans and at worst, the servants of the Devi! (Lewis-Williams, 2003). Only a few people in the !8th and !9th centuries gave any attention to the San people, but their works are still invaluable sources for archaeologists trying to interpret San rock art. These chroniclers were Joseph Millerd Orpen, Wilhelm Bleek and his daughter-in-law Lucy Lloyd, George William Stow, and two French missionaries François Daumas and Thomas Arbousset. Despite their occidental vision of San habits, they recorded myths, religious behaviours, and interpretations of rock paintings from key individuals such as Qing, 1/Kabbo, Dia!kwain and /Han#asso (Lewis-Williams, 2003). Sadly, little was recorded at this time about the painting techniques used.
ln 1930, Marion How, the wife of the magistrate of Qacha's Neck, administrative district in Lesotho, invited Mapote, an old man, to paint elands with the same technique as used by San people. Mapote was not San himself, being rather MoPhuthi (as a son of the BaPhuthi chieftain, Moorosi), but had San half-brothers. He learned how to paint with them when he ~as young. He started by looking for a rock with little relief but sufficiently porous to absorb paints, choosing eventually a smooth sandstone. For the pigments, he asked for qhang qhang, a brilliant hematite coming from the basaltic part of Drakensberg. He asked then for fresh eland's blood. Hematite must, according to him, be heated at full moon by a woman, and then prepared with fresh eland's blood. The blood must be fresh in order to be able to penetrate the rock sufficiently. Ma pote pre pa red three different pigments: a red with hematite and fresh ox's blood (as he did not have any eland's blood at his disposai), a white with clay and Asclepia gibba plant sap, and a black made with charcoal and water. With these colours, he painted elands on two stones and "during a few homs, the knowledge of San people revived"
12
(Lewis-Williams, 1995). One ofthese painted stones is currently conserved at the University of the Witwatersrand's Origins Center, in Johannesburg, South Africa.
Then in the 1 980s, an old lady known under the pseudonym of"M" was interviewed in South Africa's Eastern Cape Province. Her father had been a San shaman and had produced many paintings which she showed and explained to her interlocutors. Her sister was also a famous shaman but had died a few years before. She confirmed Mapote's explanations in particular on the need for blood for the red but she added that the fat of eland was used as a binder to manufacture the red pigment too (Lewis-Williams, 1995). This last explanation can be linked to a San myth where 1/Kaggen, the creator of life for the San, asked his wife to mix eland blood and fat and from this mixture he created new elands (Lewis-Williams, 2003).
These two testimonies are the most detailed we have from witnesses to the last living artists. This raises an issue about the artists. Who were they? Historical records do not give any real answer to this question which is linked to the interpretation of the paintings, and which is one of the curTent points of research.
1.2.2 CurTent research and questions
1.2.2.1 Interpretation of the art
In interpreting San rock art, there are two prevailing models or schools ofthought:
The "Shamanistic" modd : developed by Lewis-Williams in the 1980's using ethnographie records from extant Kalahari San, this was a real breakthrough in the interpretation of rock art in southern Africa and subsequently around the world. This mode! sees rock art as the representation of the "journey" of a shaman in the spirit world. Indeed to heal people, to make the rain to fall at a certain place or to visit relatives who lived far away, shamans used dance, singing and clapping to enter trance states. In these aitered states of consciousness, they were able to go through the 'veil' of rock and to travel in the three worlds (detailed in §1.2.1). Once their mi sion was complete, they came "back to life" and rock paintings are
2
seen as a way to explain what they saw (Lewis-Williams, 2003; Lewis-Williams
and Pearce, 2004). At the same time, paintings are seen as "full of power" and may
have been used by shamans to help them to enter !rance by touching or looking at
them (Lewis-Williams and Pearce, 2004). As the reference to shamanism is 1 inked
to altered states of consciousness, Lewis-Williams worked with neuroscientists to
describe what people see during trance. The results show that ali the people see the
same ki nd of images at the different steps of the !rance. Then their interpretation
and explanation of them depend on their beliefs (Lewis-Williams and Pearce,
2004).
The "multiple/mythological" model3: Against the "shamanistic" interpretation, authors such as Salomon, Pager and Le Quellec developed another mode! using
multiple keys to interpret rock art. Representations can be seen as rituals, myth or
record of historical actuality. Regarding ri tuais, they argue that the paintings do not
ali represent shamanic healing rituals but that some should be interpreted as
representing female initiation, for example. Moreover, they argue that a part of
social representation must be taken into account as humans are sometimes
intentionality depicted as female/male, old or young or with particularities such as
the female figures with exaggeratedly fat bodies (Salomon, 2006).
These two models have been intensely debated by their two main proponents: David Lewis
-Williams for the "shamanic" mode! and Anne Salomon for the "multiple/mythological"
mode!. Lewis-Williams asserts his mode! using the 19'11 Century Bleek and Lloyd archive of
!Xam testimonies where the word !gi:xa is translated as "Sorcerors", which Lewis Williams
interprets as shamans. lndeed, !gi means "magic power" and xa means "full of'. Thus the !gi:xa is a person "full of magic power". However, Salomon argue that the !gi:ten (plurial of !gi:xa) are not living people but spirits which can interfere in the living people's world. On
the other hand, Salomon mentioned: "one of the foremost ethnographers [Katz] of the
Kalahari San trance dance has stated thal even the Jul'hoan people have "no shamanistic
3
Term used by Anne Salomon in Afrique & histoire, N°6(2), 2006, and Jean-Loïc Le Quellec in Rock Art Studies: News of the World !, 2008.