High ApoD protein level in the round ligament fat depot of severely obese women is associated with an improved inflammatory profile
Frederik Desmarais1, Karl-F. Bergeron1, Michel Lacaille2, Isabelle Lemieux3, Jean Bergeron4, Simon Biron3,5, Eric Rassart1, Denis R. Joanisse2,3, Pascale Mauriege2,3, Catherine Mounier1* 1BioMed Research Center, Department of Biological Sciences, University of Quebec in Montreal, Montreal, Canada
2Department of Kinesiology, Faculty of Medicine, Laval University, Quebec City, Canada 3Research Center of the Quebec University Heart and Lung Institute, Quebec City, Canada 4Endocrinology and Nephrology Axis, Research Center of the University Hospital, Quebec City, Canada
5Department of Surgery, Faculty of Medicine, Laval University, Quebec City, Canada
Running head
ApoD in the round ligament fat
*Correspondence to
Catherine Mounier, Department of Biological Sciences, University of Quebec in Montreal, Montreal, PQ, Canada H2X 1Y4, 1-514-987-3000 extension 8912, [email protected]
Acknowledgments
The Laval University Merck-Frosst/CIHR Research Chair in Obesity supported the severely obese cohort. Many thanks are also expressed to Drs V. Drapeau and F. Therrien for their very helpful assistance in plasma and adipose tissue bank management. The cooperation of subjects who participated to this study was also greatly appreciated.
Abstract Purpose
Apolipoprotein D (ApoD) is a lipocalin participating in lipid transport. It binds to a variety of ligands, with a higher affinity for arachidonic acid, and is thought to have a diverse array of functions. We investigated a potential role for ApoD in insulin sensitivity, inflammation and thrombosis – processes related to lipid metabolism – in severely obese women.
Methods 1 2 3 4 6 7 8 9 10 11 12 13 14 15 16 17 18 19 20 21 22 23 24 25 26 27 28 29 30 31 32 33
We measured ApoD expression in a cohort of 44 severely obese women including dysmetabolic and non-dysmetabolic patients. Physical and metabolic characteristics of these women were determined from anthropometric measurements and blood samples. ApoD was quantified at the mRNA and protein levels in samples from three intra-abdominal adipose tissues (AT): omental, mesenteric and round ligament (RL).
Results
ApoD protein levels were highly variable between AT of the same individual. High ApoD protein levels, particularly in the RL depot, were linked to lower plasma insulin levels (-40%, p=0.015) and insulin resistance (-47%, p=0.022), and increased insulin sensitivity (+10%, p=0.008). Lower circulating pro-inflammatory PAI-1 (-39%, p=0.001) and TNF-α (-19%, p=0.030) levels were also correlated to high ApoD protein in the RL AT.
Conclusions
ApoD variability between AT was consistent with different accumulation efficiencies and/or metabolic functions according to the anatomic location of fat depots. Most statistically significant correlations implicated ApoD protein levels, in agreement with protein accumulation in target tissues. These correlations associated higher ApoD levels in fat depots with improved metabolic health in severely obese women.
Keywords
Apolipoprotein D, obesity, adipose tissue, round ligament, insulin, plasminogen activator inhibitor-1, tumor necrosis factor-α, interleukin-6
34 35 36 37 38 39 40 41 42 43 44 45 46 47 48 49 50 51 52 53 54 55 56 57
Introduction
Obesity, defined as an excessive accumulation of body fat, is a condition steadily increasing in prevalence in developed and developing countries. There are now approximately 2.1 billion people that are overweight or obese worldwide [1]. In Western countries, a common clinical definition of obesity is a body mass index (BMI) above 30 kg/m2. Obesity is further separated in 3 classes: class I with a BMI ≥ 30.0 kg/m2, class II with a BMI ≥ 35.0 kg/m2 and class III with a BMI ≥ 40.0 kg/m2 [2]. The global obesity crisis is of importance as obesity is a major risk factor for health complications including cardiovascular disease, metabolic syndrome, type 2 diabetes and chronic inflammation [2].
Inflammation has been found to be both a consequence of and a contributing factor to fat accumulation [3, 4]. The expansion of adipose tissues (AT) results in their invasion by polarized M1 macrophages which secrete pro-inflammatory cytokines such as interleukin-6 (IL-6) and tumor necrosis factor-α (TNF-α) [5]. Adipocytes also contribute to IL-6 secretion [6]. Fat accumulation and pro-inflammatory cytokine secretion increase together during the development of obesity, resulting in particularly high plasma cytokine levels in class III obese individuals [7]. Chronic inflammation, in turn, impairs insulin signaling and sensitivity [3, 4] and promotes AT expansion [8]. However, some obese individuals maintain almost normal insulinemia and insulin sensitivity. These patients – often referred to as non-dysmetabolic – tend to show lower levels of circulating cytokines compared to their dysmetabolic counterparts [7]. While AT expansion is strongly correlated with an aggravation of the metabolic profile, some fat depots are less deleterious than others [9]. Some AT, like the brown fat, are even considered beneficial [10]. The presence of round ligament (RL) fat in obese individuals has been considered relatively protective as it produces less pro-inflammatory factors than mesenteric (ME) and omental (OM) fat depots [11].
Apolipoproteins are a class of proteins that bind and transport lipids through the circulatory and lymphatic systems. ApoD is a glycosylated 19-to-32 kDa protein member of the lipocalin superfamily that possesses a pocket able to bind to a large array of small hydrophobic ligands. Among these ligands are arachidonic acid (ARA), bilirubin and a large number of steroids [12]. While ApoD is mostly expressed in the nervous system, reproductive glands, adrenal glands, kidney, lung, spleen, pancreas and placenta [12], it is also expressed in AT [12, 13]. Most of the research on ApoD has focused on its neuroprotective and anti-inflammatory functions in neurodegenerative diseases [14-21]. However, considering its high plasma level (about 12mg/100ml) [22], ApoD is expected to play some functions related to lipid metabolism outside of the nervous system. In fact, there is a direct link between ApoD deficiency and insulin resistance (IR) in mice. ApoD knockout mice show higher plasma insulin and triacylglycerol (TAG) levels, and lower epididymal lipoprotein lipase (LPL) levels [23], while transient hepatic ApoD overexpression increases serum LPL activity and reduces circulating TAG [24]. Moreover, long-term neuronal overexpression of ApoD induces non-inflammatory hepatic 58 59 60 61 62 63 64 65 66 67 68 69 70 71 72 73 74 75 76 77 78 79 80 81 82 83 84 85 86 87 88 89 90 91 92 93 94 95 96
steatosis and IR in one-year-old transgenic mice [25, 26]. Links between ApoD and insulin signaling/lipid metabolism can also be found in humans: a significant association exists between ApoD polymorphism and diabetes, obesity as well as hyperinsulinemia [27, 28]. ApoD adrenal gland expression is strongly downregulated in Cushing syndrome due to macronodular adrenal hyperplasia [29]. To date there have been no reports of humans with a complete deficiency in plasma ApoD.
In light of these facts, we postulated that ApoD plays a role in AT metabolism and control of inflammation. As such, we searched for a potential link between the metabolic profile of severely obese individuals and ApoD expression in different intra-abdominal fat depots obtained during bariatric surgery. 97 98 99 100 101 102 103 104 105 106 107 108 109
Materials and Methods
Patient selection
This study included forty-four Caucasian premenopausal severely obese women with a mean BMI of 53.6 kg/m2, who were candidates for biliopancreatic diversion with duodenal switch surgery at the Quebec Heart and Lung University Institute Hospital [30]. Subjects with hepatotoxic medication, history of hepatitis, prior weight-loss surgery, smoking and/or consuming more than 100g of alcohol per week were excluded. Thirteen women were diabetic according to the Diagnosis and Classification of Diabetes Mellitus WHO guidelines. Although diabetic subjects were treated pharmacologically for their condition, none were treated with glitazones. The appropriate ethics committee approved the experimental design (Laval University Ethics Committee approval CERUL # 2004-108), and all participants provided their written informed consent.
Anthropometric measurements and blood sampling
Patients were weighed in a light gown on an electronic Toledo scale adapted for body weight greater than 136 kg, and BMI was calculated as the ratio of weight (kg) to height squared (m2). Body fat distribution was assessed using waist circumference measured in a standard position at the widest circumference of the umbilical level. Blood sampling was performed in the morning after an overnight fast (12 hour minimum). Plasma cholesterol, HDL-cholesterol, low-density lipoprotein-cholesterol, TAG and fasting glucose concentrations were evaluated by routine methods in the clinical laboratories of the Heart and Lung University Institute Hospital in Quebec City. Plasma insulin concentrations were determined with a high-sensitivity ELISA (Millipore, EZHI-14K). IR based on the “Homeostasis Model Assessment” (HOMA) index was evaluated according to the following equation: insulin (µUI/mL) x glucose (mmol/L)/22.5 [31], whereas the “Quantitative Insulin Check Index” (QUICKI) which reflects insulin sensitivity was calculated as follows: 1/log [(fasting insulin) (μUI/mL) × (fasting glucose) (mg/dL)] [32].Plasma TNF-α and IL-6 concentrations were measured with a high-sensitivity ELISA (R&D Systems, DTA00C and D6050). The run-to-run coefficients of variation were less than 10% for IL-6 and TNF-α [33]. Finally, another blood sample was collected in plastic tubes containing trisodium citrate anticoagulant with great care in order to minimize platelet activation. Plasma plasminogen activator inhibitor-1 (PAI-1) antigen levels were measured with the Asserachrom PAI-1 ELISA kit (DiagnosticaStago, 00949US), and both intra- and inter-assay coefficients of variation were less than 5% [34].
Adipose tissue removal 110 111 112 113 114 115 116 117 118 119 120 121 122 123 124 125 126 127 128 129 130 131 132 133 134 135 136 137 138 139 140 141 142 143 144 145
AT samples were recovered during gastric bypass surgery following an overnight fast (at least 12 hours). General anesthesia was induced by a short-acting barbiturate and maintained by fentanyl and a mixture of oxygen and nitrous oxide. Patients did not receive drugs acting on the autonomic nervous system or modifying catecholamine levels [33]. All fat depots under consideration are drained by the portal vein or its collaterals, and classified as intra-abdominal [35], and more particularly as intraperitoneal fat [36]. After surgical excision, AT samples of approximately 200 mg were obtained from the OM and ME depots [37, 38], as well as from the RL fat surrounding the liver. From these samples, 100 mg were used for quantification of the ApoD mRNA levels in AT.
Immunoblotting
To prepare total protein extracts, 100 mg of AT samples where homogenized in lysis buffer (50mM Tris-HCl pH 7.4, 250mM sucrose, 1% v/v Triton X-10, 100mM NaF, 10mM Na-pyrophosphate, 1mM EDTA, 1M DTT, 1mM Na-vanadate, 1mM PMSF). Samples were centrifuged at 23,000g for 20 min at 4oC and the lipid layer and cell debris were discarded. Total protein concentration was measured using the Bradford Assay (Sigma Aldrich) [39]. For each sample, 10 µg total proteins were loaded and separated on a 10% SDS-polyacrylamide gel. The proteins were then transferred to PVDF membranes, blocked with 10% w/v skim milk (powder) in Tris-buffered saline (pH 7.4) supplemented with 0.1% v/v Tween and incubated with anti-human-ApoD mouse monoclonal antibody (clone 2B9; 1:1000) [40]. The primary antibody was then detected using anti mouse IgG conjugated to horseradish peroxidase (Cell Signalling, 7076S; 1:1000) and visualized by chemiluminescence (Chemiluminescent HRP Substrate; Millipore). Amido Black staining was used as loading control [41]. Bands were quantified by densitometry using the Gel Analyzer function of Image J software.
Statistical analyses
Raw values for all measurements are included as supplementary material (Table S1). For cohort division according to ApoD protein levels, the median value was used as the cut-off point between low and high groups for each fat depot. For cohort division according to BMI, one group included values between 40 and 49.9 kg/m, and the other group included values of 50 kg/m, and above. Results are presented as mean ± standard deviation (SD) in tables and as mean ± standard error of the mean (SEM) in figures. Associations between variables of interest were quantified by linear regression analysis using Pearson's product moment correlation coefficients. Statistical significance was considered reached if P<0.05.
146 147 148 149 150 151 152 153 154 155 156 157 158 159 160 161 162 163 164 165 166 167 168 169 170 171 172 173 174 175 176 177 178 179 180
Results
ApoD expression levels correlate with improved metabolic markers in severely obese women
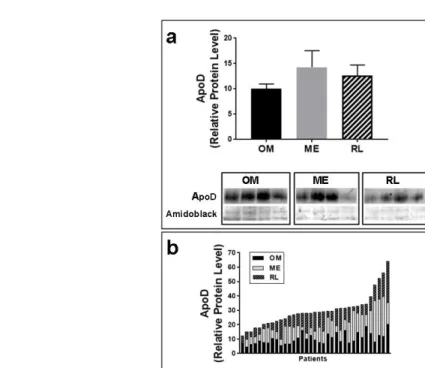
Physical and metabolic characteristics of 44 severely obese women (classes II and III) were determined from body measurements and blood samples (Table 1). Although the "classical" dysmetabolic profile associated with obesity (i.e., hyperlipidemia and hyperglycemia) was observed, half of the women presented at least some metabolically healthy values such as high HDL-cholesterol, low circulating TAG and/or low insulin levels [42]. Samples from OM, ME and RL AT were collected from these women during intra-abdominal surgery [11] and the levels of ApoD mRNA and protein expression were measured. Mean ApoD protein levels were similar in all AT sampled (Fig.1A). However, we observed notable regional variations in ApoD expression levels within the same individual. ApoD levels in any one AT did not correlate with ApoD levels in other fat depots (Fig.1B).
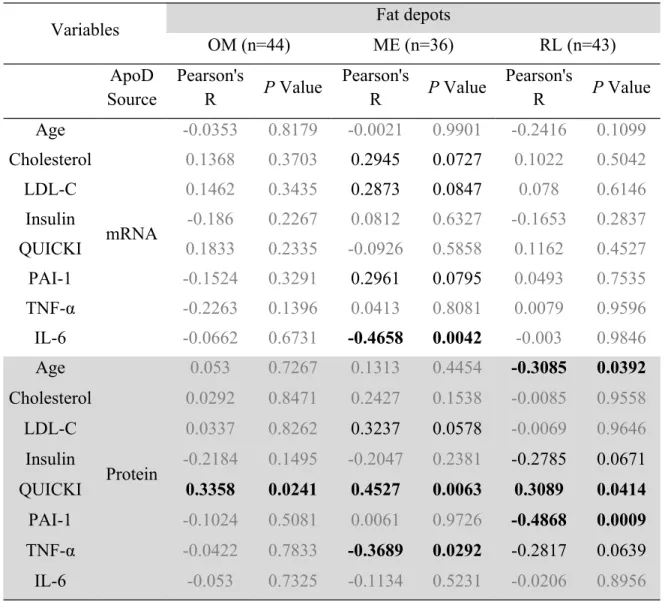
Because different AT are thought to have various effects on metabolism [9, 10], we examined potential associations between ApoD levels and the various biomarkers that were evaluated in these women. ApoD mRNA and protein levels correlated significantly with several biomarkers (Table 2). More correlations were observed with ApoD protein levels than with mRNA levels, probably because ApoD is a circulating protein that can accumulate in target tissues [12]. Interestingly, the QUICKI insulin sensitivity index was positively associated with ApoD protein levels in all fat depots examined. In the ME fat, ApoD mRNA levels correlated negatively with circulating IL-6 while ApoD protein levels correlated negatively with circulating pro-inflammatory TNF-α. In the RL AT, ApoD protein levels were negatively associated with patient age and circulating pro-thrombotic PAI-1. Though not statistically significant, there was a trend towards a negative association between ApoD protein and fasting insulin levels in the RL fat depot. Together, these observations suggest a possible beneficial role for ApoD insulin signaling and inflammation.
ApoD protein levels in the round ligament fat are associated with improved insulin sensitivity and inflammation
We further explored the potential link between ApoD protein level assessed at the AT level and metabolic health by dividing the samples from severely obese women in two subgroups based on the ApoD protein level for each fat depot (around the median value; Fig.S1). Since ApoD protein levels vary considerably between AT of the same individual, this division process resulted in different women being (sub)grouped together when different AT are considered.
In the RL AT, higher levels of ApoD protein were associated with lower BMI and waist circumference (Fig.2A) as well as improved insulin metabolism: lower fasting insulin levels and 182 183 184 185 186 187 188 189 190 191 192 193 194 195 196 197 198 199 200 201 202 203 204 205 206 207 208 209 210 211 212 213 214 215 216 217 218
HOMA-IR index, and higher QUICKI (Fig.2B). Interestingly, the QUICKI index was positively associated with ApoD levels in the OM fat and, while not statistically significant, an analogous trend was observed in the ME depot (P=0.0591). Circulating PAI-1 and TNF-α were negatively associated with ApoD protein levels in the RL AT (Fig.2C). A trend toward low TNF-α was also associated with high ApoD levels in the ME fat (P = 0.0605). Plasma IL-6 levels were not linked to ApoD protein levels, irrespective of the AT examined.
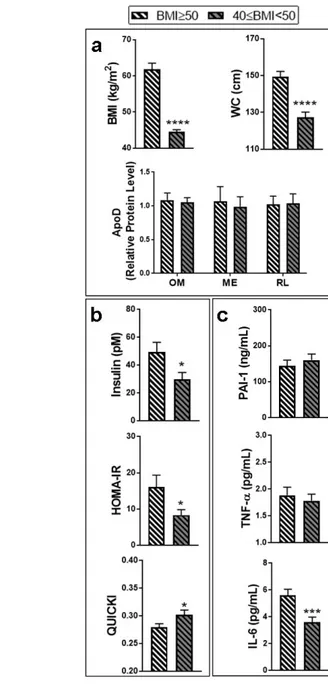
In an effort to test the specificity and robustness of the links we uncovered between AT ApoD protein levels and metabolic markers, the samples from severely obese women were differently divided, this time according to BMI (BMI ≥ 50 kg/m2 and 50 > BMI ≥ 40 kg/m2; Fig.3). As expected, this procedure resulted in two groups showing a significant difference in BMI and waist circumference (Fig.3A). No differences in ApoD protein levels were found between these groups, irrespective of the AT considered. Division of the cohort according to BMI showed better insulin metabolism in less obese women: lower fasting insulin levels and HOMA-IR index, and higher QUICKI (Fig.3B). While it was not associated with circulating PAI-1 or TNF-α levels, lower BMI was also linked to decreased IL-6 levels (Fig.3C). Similar results were obtained with a cohort division based on waist circumference (data not shown). Taken together, our observations suggest that the link between high ApoD levels and lower inflammatory markers (PAI-1 and TNF-α circulating levels) in severely obese women is specific to the accumulation of ApoD protein in particular AT depots such as the RL fat, and not merely a consequence of lower BMI.
219 220 221 222 223 224 225 226 227 228 229 230 231 232 233 234 235 236 237 238 239 240 241
Conclusion
In this study, we demonstrated that the ApoD level in specific fat depots is associated with several metabolic factors. As ApoD is a circulating protein that can accumulate in specific tissues including liver and AT [12], correlations with ApoD protein levels are probably more relevant to the patient's metabolic profile than ApoD mRNA levels. The source of human tissue (gastric bypass surgery patients) limited our study to mesenteric, omental and round ligament fat depots from severely obese women. AT samples collected for this study were heterogeneous, containing adipocytes but also stromal cells, including pre-adipocytes, macrophages and lymphocytes. This heterogeneity may influence gene expression and protein level measurement (including ApoD and other relevant markers), depending on the proportion of each cell type, and should be kept in mind during interpretation of our results. Despite this caveat, interesting relationships were found in our analyses associating higher ApoD levels with improved metabolic health as inferred from lower levels of harmful biomarkers. Insulin sensitivity (as measured by QUICKI) was particularly correlated with ApoD protein levels in all fat depots examined. While thrombosis and inflammation markers correlated for the most part with ApoD protein levels in the RL fat.
ApoD protein levels were highly variable between AT of the same individual, suggesting different accumulation efficiencies and/or metabolic functions according to the anatomic location of fat depots. The mechanism of ApoD protein internalization by adipocytes could be critical in understanding this variability. The intriguing link we uncovered between ApoD protein level and age, suggesting that younger severely obese women may have more ApoD in their RL fat, could be explained by differences in ApoD internalization. The ApoD receptor Basigin (CD147) was recently identified in neurons [43]. This receptor is expressed in most if not all tissues, including AT [44], and may therefore play a major role in ApoD internalization by fat. As such, the variability of ApoD accumulation in one AT compared to another might be due to its own Basigin levels. This, however, remains to be validated. On the other hand, the single correlation observed between ApoD mRNA level and IL-6 in the ME fat deposit (Table 2) is indicative of a regulation mechanism at the transcriptional level. In fact, IL-6 has been shown to reduce the expression of ApoD in 293T cells [45]. However, it is not clear why evidence of this potential transcriptional regulation was only found in ME fat. This might constitute further evidence of functional differences between AT [46-48].
A better resolution of ApoD’s link with key metabolic health factors was observed after we divided the cohort into high versus low ApoD protein levels. This division revealed that higher levels of protein ApoD in the RL fat were linked to lower BMI and waist circumference, to improved insulin metabolism (as measured by three criteria: fasting insulin, HOMA-IR and QUICKI) and to reduced systemic inflammation. Since a reduction of adiposity and abdominal fat accumulation (i.e., reduced BMI) has an impact on insulin sensitivity and chronic inflammation [2], we examined the impact of BMI and waist circumference on those metabolic 242 243 244 245 246 247 248 249 250 251 252 253 254 255 256 257 258 259 260 261 262 263 264 265 266 267 268 269 270 271 272 273 274 275 276 277 278 279 280
parameters in our cohort. Interestingly, when the cohort was divided according to BMI, the association with inflammation markers PAI-1 and TNF-α was lost. This argues for a critical link between ApoD protein levels and inflammation profile, specifically in the RL fat. Of note, IL-6 secretion was significantly different between BMI subgroups, a biomarker that was not linked to ApoD levels in our previous division. This would suggest that the links we observe between ApoD protein and inflammation are independent of BMI in severely obese women.
Pioneering work on the physiological role of the RL AT has shown that it possesses distinct metabolic properties [49, 50]. Our analysis suggests a specific role for ApoD in the RL fat that appears different than for the other AT examined. In agreement, previous studies have shown different physiological roles for different AT depots [46-48]. However, it is unlikely that the RL AT on its own can significantly impact whole-body state/function given its surmised small size. Its mass has never been clearly determined in either normal or obese individuals but, because of its anatomical location between the falciform and the round ligaments, its size is assumed to be restricted. Nonetheless, the RL AT could serve as an indicator that similar changes are occurring to other adipose depots or other tissue types throughout the body, and together they could have a significant physiological impact.
One possible mechanism of action for ApoD in fat depots is through its well-known role in the modulation of inflammation. Indeed, ApoD possesses inflammation repression functions [51, 52]; it is therefore possible that ApoD can contribute to the reduction of TNF-α secretion observed in the high RL AT ApoD group. One mechanism for this ApoD property could be through ARA transport. ARA is the source of all eicosanoid production and an increase in the ARA supplied to AT’s leukocytes is likely to increase eicosanoid production, of which prostaglandin E2 (PGE2) is a prime example. While low doses of PGE2 have a pro-inflammatory effect on leukocytes, higher doses of PGE2 actually inhibits leukocyte TNF-α secretion by increasing intracellular cAMP levels [53, 54]. This hypothesis has strong implications for insulin sensitivity, as TNF-α has been shown to inhibit insulin signaling and expression through c-Jun N-terminal kinase activation, which results in inhibition of insulin receptor substrate-1, Akt/protein kinase B and insulin gene transcription [4]. Therefore, ApoD may indirectly promote insulin sensitivity through a reduction of TNF-α secretion. Also, the correlation we observed between ApoD in the RL fat and PAI-1 might be an indirect consequence of ApoD’s effect on TNF-α and insulin levels, as they in turn modulate PAI-1 [55]. In conclusion, our study is the first to suggest a role for the ApoD protein in AT. ApoD accumulation in the three AT examined in our study correlated with improved systemic metabolic factors, including insulin sensitivity and inflammation. However, only accumulation to the RL fat depot was simultaneously correlated to all of these factors in severely obese women. 281 282 283 284 285 286 287 288 289 290 291 292 293 294 295 296 297 298 299 300 301 302 303 304 305 306 307 308 309 310 311 312 313 314 315 316
Funding
For this specific study, PM received funding from the Quebec University Heart and Lung Institute (collaborators: DRJ and CM).
Conflict of interest
The authors declare that they have no conflict of interest.
Ethical Statement
The Laval University Ethics Committee approved the experimental design (CERUL # 2004-108).
Consent Statement
All participants provided their written informed consent. 318 319 320 321 322 323 324 325 326 327 328 329 330 331 332
References
1. Smith KB, Smith MS. Obesity Statistics. Prim Care. 2016;43(1):121-35, ix. doi: 10.1016/j.pop.2015.10.001. PubMed PMID: 26896205.
2. Jensen MD, Ryan DH, Apovian CM, Ard JD, Comuzzie AG, Donato KA, et al. 2013 AHA/ACC/TOS Guideline for the Management of Overweight and Obesity in Adults. Circulation. 2014;129(25 suppl 2):S102-S38. doi: 10.1161/01.cir.0000437739.71477.ee.
3. Hotamisligil GS. Inflammation, metaflammation and immunometabolic disorders. Nature. 2017;542(7640):177-85. doi: 10.1038/nature21363.
4. Agrawal N, Delanoue R, Mauri A, Basco D, Pasco M, Thorens B, et al. The Drosophila TNF Eiger Is an Adipokine that Acts on Insulin-Producing Cells to Mediate Nutrient Response. Cell Metab. 2016;23(4):675-84. doi: 10.1016/j.cmet.2016.03.003. PubMed PMID: 27076079. 5. Lumeng CN, Bodzin JL, Saltiel AR. Obesity induces a phenotypic switch in adipose tissue macrophage polarization. J Clin Invest. 2007;117(1):175-84. doi: 10.1172/JCI29881. PubMed PMID: 17200717; PubMed Central PMCID: PMC1716210.
6. Harkins JM, Moustaid-Moussa N, Chung YJ, Penner KM, Pestka JJ, North CM, et al. Expression of interleukin-6 is greater in preadipocytes than in adipocytes of 3T3-L1 cells and C57BL/6J and ob/ob mice. J Nutr. 2004;134(10):2673-7. PubMed PMID: 15465765.
7. Mauriege P, Joanisse DR, CasparBauguil S, Cartier A, Lemieux I, Bergeron J, et al. Gene expression of different adipose tissues of severely obese women with or without a dysmetabolic profile. J Physiol Biochem. 2015;71(4):719-32. doi: 10.1007/s13105-015-0436-6. PubMed PMID: 26452503.
8. Handoko K, Yang K, Strutt B, Khalil W, Killinger D. Insulin attenuates the stimulatory effects of tumor necrosis factor alpha on 11beta-hydroxysteroid dehydrogenase 1 in human adipose stromal cells. J Steroid Biochem Mol Biol. 2000;72(3-4):163-8. PubMed PMID: 10775808. 333 334 335 336 337 338 339 340 341 342 343 344 345 346 347 348 349 350 351 352 353 354 355 356 357
9. Berg AH, Scherer PE. Adipose tissue, inflammation, and cardiovascular disease. Circ Res. 2005;96(9):939-49. doi: 10.1161/01.RES.0000163635.62927.34. PubMed PMID: 15890981.
10. Ouellet V, Labbe SM, Blondin DP, Phoenix S, Guerin B, Haman F, et al. Brown adipose tissue oxidative metabolism contributes to energy expenditure during acute cold exposure in humans. J Clin Invest. 2012;122(2):545-52. doi: 10.1172/JCI60433. PubMed PMID: 22269323; PubMed Central PMCID: PMC3266793.
11. Mauriege P, Joanisse DR, Cartier A, Lemieux I, Bergeron J, Biron S, et al. Gene expression in a rarely studied intraabdominal adipose depot, the round ligament, in severely obese women: A pilot study. Adipocyte. 2016;5(1):27-34. doi: 10.1080/21623945.2015.1103404. PubMed PMID: 27144094; PubMed Central PMCID: PMC4836489.
12. Rassart E, Bedirian A, Do Carmo S, Guinard O, Sirois J, Terrisse L, et al. Apolipoprotein D. Biochimica et Biophysica Acta (BBA) - Protein Structure and Molecular Enzymology. 2000;1482(1-2):185-98. doi: 10.1016/s0167-4838(00)00162-x.
13. Zhang J, He Q, Liu QY, Guo W, Deng XM, Zhang WW, et al. Differential gene expression profile in pig adipose tissue treated with/without clenbuterol. BMC Genomics. 2007;8:433. doi: 10.1186/1471-2164-8-433. PubMed PMID: 18039366; PubMed Central PMCID: PMC2231380.
14. Terrisse L, Poirier J, Bertrand P, Merched A, Visvikis S, Siest G, et al. Increased levels of apolipoprotein D in cerebrospinal fluid and hippocampus of Alzheimer's patients. J Neurochem. 1998;71(4):1643-50. PubMed PMID: 9751198.
15. Navarro A, Del Valle E, Astudillo A, Gonzalez del Rey C, Tolivia J. Immunohistochemical study of distribution of apolipoproteins E and D in human cerebral beta amyloid deposits. Exp Neurol. 2003;184(2):697-704. doi: 10.1016/S0014-4886(03)00315-7. PubMed PMID: 14769361. 358 359 360 361 362 363 364 365 366 367 368 369 370 371 372 373 374 375 376 377 378 379 380 381 382 383
16. Kalman J, McConathy W, Araoz C, Kasa P, Lacko AG. Apolipoprotein D in the aging brain and in Alzheimer's dementia. Neurol Res. 2000;22(4):330-6. PubMed PMID: 10874678. 17. Thomas EA, Dean B, Pavey G, Sutcliffe JG. Increased CNS levels of apolipoprotein D in schizophrenic and bipolar subjects: implications for the pathophysiology of psychiatric disorders. Proc Natl Acad Sci U S A. 2001;98(7):4066-71. doi: 10.1073/pnas.071056198. PubMed PMID: 11274430; PubMed Central PMCID: PMC31180.
18. Sutcliffe JG, Thomas EA. The neurobiology of apolipoproteins in psychiatric disorders. Mol Neurobiol. 2002;26(2-3):369-88. PubMed PMID: 12428765.
19. Thomas EA, Copolov DL, Sutcliffe JG. From pharmacotherapy to pathophysiology: emerging mechanisms of apolipoprotein D in psychiatric disorders. Curr Mol Med. 2003;3(5):408-18. PubMed PMID: 12942994.
20. Rickhag M, Deierborg T, Patel S, Ruscher K, Wieloch T. Apolipoprotein D is elevated in oligodendrocytes in the peri-infarct region after experimental stroke: influence of enriched environment. J Cereb Blood Flow Metab. 2008;28(3):551-62. doi: 10.1038/sj.jcbfm.9600552. PubMed PMID: 17851453.
21. Desai PP, Ikonomovic MD, Abrahamson EE, Hamilton RL, Isanski BA, Hope CE, et al. Apolipoprotein D is a component of compact but not diffuse amyloid-beta plaques in Alzheimer's disease temporal cortex. Neurobiol Dis. 2005;20(2):574-82. doi: 10.1016/j.nbd.2005.04.012. PubMed PMID: 15916898.
22. Camato R, Marcel YL, Milne RW, Lussier-Cacan S, Weech PK. Protein polymorphism of a human plasma apolipoprotein D antigenic epitope. J Lipid Res. 1989;30(6):865-75. PubMed PMID: 2477480.
23. Jimenez-Palomares M, Cozar-Castellano I, Ganfornina MD, Sanchez D, Perdomo G. Genetic deficiency of apolipoprotein D in the mouse is associated with nonfasting hypertriglyceridemia and hyperinsulinemia. Metabolism. 2011;60(12):1767-74. doi: 384 385 386 387 388 389 390 391 392 393 394 395 396 397 398 399 400 401 402 403 404 405 406 407 408
24. Perdomo G, Kim DH, Zhang T, Qu S, Thomas EA, Toledo FG, et al. A role of apolipoprotein D in triglyceride metabolism. J Lipid Res. 2010;51(6):1298-311. doi: 10.1194/jlr.M001206. PubMed PMID: 20124557; PubMed Central PMCID: PMC3035493. 25. Do Carmo S, Fournier D, Mounier C, Rassart E. Human apolipoprotein D overexpression in transgenic mice induces insulin resistance and alters lipid metabolism. Am J Physiol Endocrinol Metab. 2009;296(4):E802-11. doi: 10.1152/ajpendo.90725.2008. PubMed PMID: 19176353.
26. Labrie M, Lalonde S, Najyb O, Thiery M, Daneault C, Des Rosiers C, et al. Apolipoprotein D Transgenic Mice Develop Hepatic Steatosis through Activation of PPARgamma and Fatty Acid Uptake. PLoS One. 2015;10(6):e0130230. doi: 10.1371/journal.pone.0130230. PubMed PMID: 26083030; PubMed Central PMCID: PMC4470830.
27. Baker WA, Hitman GA, Hawrami K, McCarthy MI, Riikonen A, Tuomilehto-Wolf E, et al. Apolipoprotein D gene polymorphism: a new genetic marker for type 2 diabetic subjects in Nauru and south India. Diabet Med. 1994;11(10):947-52. PubMed PMID: 7895459.
28. Vijayaraghavan S, Hitman GA, Kopelman PG. Apolipoprotein-D polymorphism: a genetic marker for obesity and hyperinsulinemia. J Clin Endocrinol Metab. 1994;79(2):568-70. doi: 10.1210/jcem.79.2.7913935. PubMed PMID: 7913935.
29. Bourdeau I, Antonini SR, Lacroix A, Kirschner LS, Matyakhina L, Lorang D, et al. Gene array analysis of macronodular adrenal hyperplasia confirms clinical heterogeneity and identifies several candidate genes as molecular mediators. Oncogene. 2004;23(8):1575-85. doi: 10.1038/sj.onc.1207277. PubMed PMID: 14767469.
30. Marceau P, Hould FS, Simard S, Lebel S, Bourque RA, Potvin M, et al. Biliopancreatic diversion with duodenal switch. World J Surg. 1998;22(9):947-54. PubMed PMID: 9717420. 31. Matthews DR, Hosker JP, Rudenski AS, Naylor BA, Treacher DF, Turner RC. Homeostasis model assessment: insulin resistance and beta-cell function from fasting plasma 410 411 412 413 414 415 416 417 418 419 420 421 422 423 424 425 426 427 428 429 430 431 432 433 434 435
glucose and insulin concentrations in man. Diabetologia. 1985;28(7):412-9. PubMed PMID: 3899825.
32. Katz A, Nambi SS, Mather K, Baron AD, Follmann DA, Sullivan G, et al. Quantitative insulin sensitivity check index: a simple, accurate method for assessing insulin sensitivity in humans. J Clin Endocrinol Metab. 2000;85(7):2402-10. doi: 10.1210/jcem.85.7.6661. PubMed PMID: 10902785.
33. Caspar-Bauguil S, Fioroni A, Galinier A, Allenbach S, Pujol MC, Salvayre R, et al. Pro-inflammatory phospholipid arachidonic acid/eicosapentaenoic acid ratio of dysmetabolic severely obese women. Obes Surg. 2012;22(6):935-44. doi: 10.1007/s11695-012-0633-0. PubMed PMID: 22460550.
34. Bouchard L, Vohl MC, Lebel S, Hould FS, Marceau P, Bergeron J, et al. Contribution of genetic and metabolic syndrome to omental adipose tissue PAI-1 gene mRNA and plasma levels in obesity. Obes Surg. 2010;20(4):492-9. doi: 10.1007/s11695-010-0079-1. PubMed PMID: 20127289.
35. Netter FH. Mesenteric relations of intestines - Omental bursa: cross section - Stomach in situ - Visceral vasculature. Atlas of human anatomy. Summit, N.J.: CIBA-GEIGY Corp.; 1989. p. 254,6,8,97.
36. Fried SK RR. Biology of visceral adipose tissue. In: Inc MD, editor. Handbook of obesity: Etiology and Pathophysiology. 2nd ed. New York, Basel2004. p. 589-614.
37. Tchernof A, Despres JP. Pathophysiology of human visceral obesity: an update. Physiol Rev. 2013;93(1):359-404. doi: 10.1152/physrev.00033.2011. PubMed PMID: 23303913.
38. Lee MJ, Wu Y, Fried SK. Adipose tissue heterogeneity: implication of depot differences in adipose tissue for obesity complications. Mol Aspects Med. 2013;34(1):1-11. doi: 10.1016/j.mam.2012.10.001. PubMed PMID: 23068073; PubMed Central PMCID: PMC3549425. 436 437 438 439 440 441 442 443 444 445 446 447 448 449 450 451 452 453 454 455 456 457 458 459 460
39. Bradford MM. A rapid and sensitive method for the quantitation of microgram quantities of protein utilizing the principle of protein-dye binding. Anal Biochem. 1976;72:248-54. PubMed PMID: 942051.
40. Do Carmo S, Forest JC, Giguere Y, Masse A, Lafond J, Rassart E. Modulation of Apolipoprotein D levels in human pregnancy and association with gestational weight gain. Reprod Biol Endocrinol. 2009;7:92. doi: 10.1186/1477-7827-7-92. PubMed PMID: 19723339; PubMed Central PMCID: PMC3224896.
41. Aldridge GM, Podrebarac DM, Greenough WT, Weiler IJ. The use of total protein stains as loading controls: an alternative to high-abundance single-protein controls in semi-quantitative immunoblotting. J Neurosci Methods. 2008;172(2):250-4. doi: 10.1016/j.jneumeth.2008.05.003. PubMed PMID: 18571732; PubMed Central PMCID: PMC2567873.
42. Carpene C, Les F, Hasnaoui M, Biron S, Marceau P, Richard D, et al. Anatomical distribution of primary amine oxidase activity in four adipose depots and plasma of severely obese women with or without a dysmetabolic profile. J Physiol Biochem [Internet]. 2016 Oct 21. Available from: https://www.ncbi.nlm.nih.gov/pubmed/27766585.
43. Najyb O, Brissette L, Rassart E. Apolipoprotein D Internalization Is a Basigin-dependent Mechanism. J Biol Chem. 2015;290(26):16077-87. doi: 10.1074/jbc.M115.644302. PubMed PMID: 25918162; PubMed Central PMCID: PMC4481210.
44. Scherer PE, Bickel PE, Kotler M, Lodish HF. Cloning of cell-specific secreted and surface proteins by subtractive antibody screening. Nat Biotechnol. 1998;16(6):581-6. doi: 10.1038/nbt0698-581. PubMed PMID: 9624692.
45. Blais Y, Sugimoto K, Carrière M-C, Haagensen DE, Labrie F, Simard J. Interleukin-6 inhibits the potent stimulatory action of androgens, glucocorticoids and interleukin-1α on apolipoprotein D and GCDFP-15 expression in human breast cancer cells. International Journal of Cancer. 1995;62(6):732-7. doi: 10.1002/ijc.2910620614.
461 462 463 464 465 466 467 468 469 470 471 472 473 474 475 476 477 478 479 480 481 482 483 484 485
46. Wajchenberg BL. Subcutaneous and visceral adipose tissue: their relation to the metabolic syndrome. Endocr Rev. 2000;21(6):697-738. doi: 10.1210/edrv.21.6.0415. PubMed PMID: 11133069.
47. Bonora E. Relationship between regional fat distribution and insulin resistance. Int J Obes Relat Metab Disord. 2000;24 Suppl 2:S32-5. PubMed PMID: 10997605.
48. Bjorntorp P. [Metabolic difference between visceral fat and subcutaneous abdominal fat]. Diabetes Metab. 2000;26 Suppl 3:10-2. PubMed PMID: 10945144.
49. Mauriege P, Marette A, Atgie C, Bouchard C, Theriault G, Bukowiecki LK, et al. Regional variation in adipose tissue metabolism of severely obese premenopausal women. J Lipid Res. 1995;36(4):672-84. PubMed PMID: 7616115.
50. Marette A, Mauriege P, Marcotte B, Atgie C, Bouchard C, Theriault G, et al. Regional variation in adipose tissue insulin action and GLUT4 glucose transporter expression in severely obese premenopausal women. Diabetologia. 1997;40(5):590-8. PubMed PMID: 9165229.
51. Do Carmo S, Jacomy H, Talbot PJ, Rassart E. Neuroprotective effect of apolipoprotein D against human coronavirus OC43-induced encephalitis in mice. J Neurosci. 2008;28(41):10330-8. doi: 10.1523/JNEUROSCI.2644-02008;28(41):10330-8.2002008;28(41):10330-8. PubMed PMID: 18842892.
52. Ganfornina MD, Do Carmo S, Lora JM, Torres-Schumann S, Vogel M, Allhorn M, et al. Apolipoprotein D is involved in the mechanisms regulating protection from oxidative stress. Aging Cell. 2008;7(4):506-15. doi: 10.1111/j.1474-9726.2008.00395.x. PubMed PMID: 18419796; PubMed Central PMCID: PMC2574913.
53. Moore JN, Cook JA, Morris DD, Halushka PV, Wise WC. Endotoxin-induced procoagulant activity, eicosanoid synthesis, and tumor necrosis factor production by rat peritoneal macrophages: effect of endotoxin tolerance and glucan. Circ Shock. 1990;31(3):281-95. PubMed PMID: 2113440. 486 487 488 489 490 491 492 493 494 495 496 497 498 499 500 501 502 503 504 505 506 507 508 509
thioglycollate-elicited macrophages. J Lipid Mediat Cell Signal. 1994;10(3):283-94. PubMed PMID: 7812678.
55. Cesari M, Pahor M, Incalzi RA. Plasminogen activator inhibitor-1 (PAI-1): a key factor linking fibrinolysis and age-related subclinical and clinical conditions. Cardiovasc Ther. 2010;28(5):e72-91. doi: 10.1111/j.1755-5922.2010.00171.x. PubMed PMID: 20626406; PubMed Central PMCID: PMC2958211.
512 513 514 515 516 517 518 519
Tables
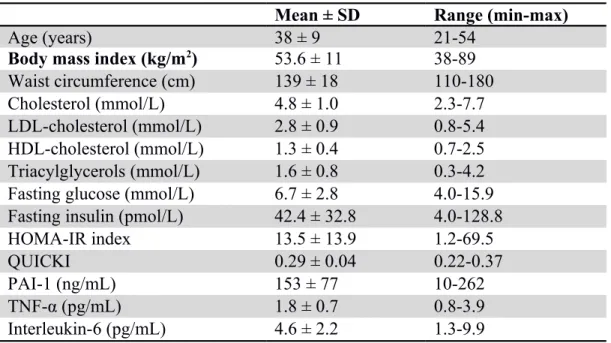
Table 1. Physical and metabolic characteristics of severely obese women Mean ± SD Range (min-max)
Age (years) 38 ± 9 21-54
Body mass index (kg/m2) 53.6 ± 11 38-89
Waist circumference (cm) 139 ± 18 110-180
Cholesterol (mmol/L) 4.8 ± 1.0 2.3-7.7
LDL-cholesterol (mmol/L) 2.8 ± 0.9 0.8-5.4
HDL-cholesterol (mmol/L) 1.3 ± 0.4 0.7-2.5
Triacylglycerols (mmol/L) 1.6 ± 0.8 0.3-4.2
Fasting glucose (mmol/L) 6.7 ± 2.8 4.0-15.9
Fasting insulin (pmol/L) 42.4 ± 32.8 4.0-128.8
HOMA-IR index 13.5 ± 13.9 1.2-69.5
QUICKI 0.29 ± 0.04 0.22-0.37
PAI-1 (ng/mL) 153 ± 77 10-262
TNF-α (pg/mL) 1.8 ± 0.7 0.8-3.9
Interleukin-6 (pg/mL) 4.6 ± 2.2 1.3-9.9
LDL, low-density lipoprotein; HDL, high-density lipoprotein; HOMA, homeostasis model assessment; IR: insulin resistance; QUICKI, quantitative insulin sensitivity check index; PAI-1, Plasminogen activator inhibitor-1; TNF-α, Tumor necrosis factor-α; SD, standard deviation 520 521 522 523 524 525 526 527 528 529
Table 2. Correlation coefficients between ApoD levels (mRNA and protein) in various fat depots and patient metabolic characteristics
Variables Fat depots
OM (n=44) ME (n=36) RL (n=43) ApoD Source Pearson's R P Value Pearson's R P Value Pearson's R P Value Age mRNA -0.0353 0.8179 -0.0021 0.9901 -0.2416 0.1099 Cholesterol 0.1368 0.3703 0.2945 0.0727 0.1022 0.5042 LDL-C 0.1462 0.3435 0.2873 0.0847 0.078 0.6146 Insulin -0.186 0.2267 0.0812 0.6327 -0.1653 0.2837 QUICKI 0.1833 0.2335 -0.0926 0.5858 0.1162 0.4527 PAI-1 -0.1524 0.3291 0.2961 0.0795 0.0493 0.7535 TNF-α -0.2263 0.1396 0.0413 0.8081 0.0079 0.9596 IL-6 -0.0662 0.6731 -0.4658 0.0042 -0.003 0.9846 Age Protein 0.053 0.7267 0.1313 0.4454 -0.3085 0.0392 Cholesterol 0.0292 0.8471 0.2427 0.1538 -0.0085 0.9558 LDL-C 0.0337 0.8262 0.3237 0.0578 -0.0069 0.9646 Insulin -0.2184 0.1495 -0.2047 0.2381 -0.2785 0.0671 QUICKI 0.3358 0.0241 0.4527 0.0063 0.3089 0.0414 PAI-1 -0.1024 0.5081 0.0061 0.9726 -0.4868 0.0009 TNF-α -0.0422 0.7833 -0.3689 0.0292 -0.2817 0.0639 IL-6 -0.053 0.7325 -0.1134 0.5231 -0.0206 0.8956
LDL-C, low-density lipoprotein-cholesterol; Insulin, fasting plasma insulin; QUICKI, quantitative insulin sensitivity check index; PAI-1, plasminogen activator inhibitor-1; TNF-α, tumor necrosis factor-α; IL-6, interleukin-6.
Values in grey are not statistically significant, nor show any trend towards statistical significance. Values in bold are statistically significant (P < 0.05).
530 531 532 533 534 535 536 537 538 539 540
Figures
Figure 1. ApoD protein levels in different adipose tissues, between and amongst patients (a) ApoD protein expression was quantified by Western blot and normalized to Amido Black in each AT (n=8): omental (OM), mesenteric (ME) and round ligament (RL). Histograms show mean value ± SEM. A Kruskal-Wallis’s multiple comparison test showed no statistically significant difference in ApoD protein levels between AT. The unequivalence of variability was established using Barlett’s test. An example of a typical Western blot comparing 4 different samples of each AT is provided. (b) The stacked histogram shows the relative the distribution of ApoD protein levels in the three AT of each patient (n=35).
541 542 543 544 545 546 547 548 549 550 551 552
Figure 2. Metabolic profiles according to ApoD protein level of each fat depot
The cohort of severely obese women was divided into two groups, corresponding to high versus low ApoD protein levels, around the median value in each AT: omental (OM, n=44), mesenteric (ME, n=36) and round ligament (RL, n=43). We considered (a) anthropometric characteristics: body mass index (BMI) and waist circumference (WC); (b) insulin-related factors: fasting insulin level, homeostasis model assessment-insulin resistance index (HOMA-IR) and quantitative insulin sensitivity check index (QUICKI); as well as (c) inflammatory markers: plasminogen activator inhibitor-1 (PAI-1), tumor necrosis factor-α (TNF-α) and interleukin-6 (IL-6). Histograms show mean value ± SEM. A Student’s t test was used to show statistically significant difference; * P<0.05, ** P<0.01. 553 554 555 556 557 558 559 560 561 562 563 564
Figure 3. Metabolic profiles according to body mass index
The cohort of severely obese women (n=44) was divided into two groups according to body mass index (BMI). One group included women with a BMI between 40 and 50 kg/m2, and the other group included women with a BMI superior to 50 kg/m2 (super-obesity). We considered (a) BMI, waist circumference (WC), and ApoD protein levels in each AT: omental (OM), mesenteric (ME) and round ligament (RL); (b) insulin-related factors: fasting insulin level, homeostasis model assessment-insulin resistance index (HOMA-IR) and quantitative insulin sensitivity check index (QUICKI); as well as (c) inflammatory markers: plasminogen activator 565 566 567 568 569 570 571 572 573
Supplementary Material
Supplementary Table S1. Body and metabolic characteristics measured in 44 severely obese women, including ApoD expression in omental, mesenteric and round ligament adipose tissue
Supplementary Figure S1. Division of the cohort into high versus low ApoD protein expression in various fat depots
The cohort of severely obese women was divided into two groups, corresponding to high versus low ApoD protein levels, around the median value in each AT: omental (OM, n=44), mesenteric (ME, n=36) and round ligament (RL, n=43). Scatter plots show the distribution of relative ApoD protein levels in patient samples after division in each fat depot. A Mann-Whitney non-parametric test was used to compare groups with unequal standard deviation and show statistically significant difference; **** P<0.0001.
577 578 579 580 581 582 583 584 585 586 587 588 589 590 591 592