PALÉOCÉANOGRAPHIE DU NORD-EST DU DÉTROIT DE FRAM DEPUIS LE DERNIER MAXIMUM GLACIAIRE
MÉMOIRE PRÉSENTÉ
COMME EXIGENCE PARTIELLE
DE LA MAÎTRISE EN SCIENCES DE LA TERRE
PAR
JADEFALARDEAU
Avertissement
La diffusion de ce mémoire se fait dans le respect des droits de son auteur, qui a signé le formulaire Autorisation de reproduire et de diffuser un travail de recherche de cycles supérieurs (SDU-522 - Rév.01-2006). Cette autorisation stipule que «conformément à l'article 11 du Règlement no 8 des études de cycles supérieurs, [l'auteur] concède à l'Université du Québec à Montréal une licence non exclusive d'utilisation et de publication de la totalité ou d'une partie importante de [son] travail de recherche pour des fins pédagogiques et non commerciales. Plus précisément, [l'auteur] autorise l'Université du Québec à Montréal à reproduire, diffuser, prêter, distribuer ou vendre des copies de [son] travail de recherche à des fins non commerciales sur quelque support que ce soit, y compris l'Internet. Cette licence et cette autorisation n'entraînent pas une renonciation de [la] part [de l'auteur] à [ses] droits moraux ni à [ses] droits de propriété intellectuelle. Sauf entente contraire, [l'auteur] conserve la liberté de diffuser et de commercialiser ou non ce travail dont [il] possède un exemplaire.»
REMERCIEMENTS
Je tiens à remercier d'abord ma directrice Anne de Vernal pour son écoute et sa grande compréhension. Je la remercie pour sa patience et pour sa générosité. Elle rn 'a toujours bien guidée en respectant mes idées. Je ne lui serai jamais assez reconnaissante pour toutes les belles opportunités qu'elle m'a offertes durant ces trois dernières années. J'ai vécu certainement les meilleurs moments de ma vie. Jamais je ne regretterai le jour où je suis passée à son bureau en septembre 2013 avec un futur des plus incertains. Je dois bien évidemment souligner l'aide essentiel de Maryse Henry au laboratoire. Je dois la remercier pour son soutien technique, mais aussi pour son soutien moral. Après avoir passé des mois entiers consécutifs au laboratoire, je la considérais un peu comme ma troisième mère. Grâce à sa merveilleuse disponibilité, elle m'a enseignée tout ce que je sais aujourd'hui sur les pratiques au laboratoire et l'identification des palynomorphes, en plus de m'avoir aidée à travers toutes les étapes de ma recherche. J'ai aussi une pensée pour Robert Spielhagen que j'ai eu la chance de rencontrer à bord du RV Polarstern. Je dois le remercier pour sa grande sagesse avec les sédiments du Détroit de Fram, ses conseils pour les chronologies de mes carottes, ainsi que pour ses trucs et astuces avec le box core.
Merci à celles au laboratoire qui me rendent heureuses et me donnent le goût de me lever le matin pour aller au bureau. Je pense notamment à la belle dame Estelle Allan pour toutes ses petites attentions qui me réchauffent le coeur et les nombreux repas partagés ensembles. Je pense à Claudie Giguère-Croteau pour les pauses-café au Fractal bien méritées et son grand encouragement. Je pense aussi à Alice Morard, pour sa joie de vivre, ses coucous quotidiens à mon bureau et ses conseils. Finalement, il y a aussi cette chère Camille Brice avec qui une grande amitié a commencé au laboratoire
entre 1 'acide fluorhydrique et les tamis 106 Jlm. Merci pour les chasses au trésor à mon anniversaire et tous ces innombrables fous rires. Je dois aussi la remercier d'avoir épargné ma tendinite pendant 1 semaine.
Merci à mon amie, et aussi colocataire, qui tente à chaque matin de me sortir du lit pour que j'aille travailler, la grandiose Dominique Trudel-Grégoire, sans qui la vie au quotidien serait tellement plus plate. Merci pour tous ces beaux moments de complicité à aimer, mais aussi haïr la vie ensemble. Merci à Anthony Boulais mon technicien informatique personnel, mais surtout mon merveilleux ami. Finalement, un dernier merci à mes parents et ma sœur, qui ne savent certainement pas encore ce qu'est un dinokyste, mais qui ont certainement su être présents et réconfortants pour moi pendant la création du mémoire.
Ce mémoire de recherche porte sur l'étude de trois carottes sédimentaires, c'est-à-dire les carottes PS2863-2BC, PS2863-1 et MSM5/5-712-2. Plusieurs enregistrements paléocéanographiques ont déjà été publiés sur la carotte MSM5/5-712-2 notamment basés sur les biomarqueurs (Müller et al., 2012; Müller et Stein, 2014) et les assemblages de foraminifères planctoniques, incluant l'analyse des isotopes stables sur les tests des foraminifères (Aagaard-S~rensen et al., 2014a-b; Werner et al., 2013, 2011; Zamelczyk et al., 2014). Le modèle d'âge de la carotte MSM5/5-712-2 repose
principalement sur celui de Müller et Stein (2014). Le modèle d'âge de la carotte PS2863-l est original. Les âges 14C de cette dernière ont été transmis par M. Robert Spielhagen du centre Helmholtz pour la recherche océanique GEOMAR à l'exception d'un échantillon qui fut analysé au National Ocean Sciences Accelerator Mass
Spectrometry (NOSAMS). Les 315 centimètres de la partie supérieure de la carotte
MSM5/5-712-2 utilisés dans ce mémoire ont été analysés pour leur contenu palynologique par Sophie Bonnet et Maryse Henry. J'ai analysé la partie inférieure de la carotte (315-777 cm) et c'est la première fois que les résultats palynologiques de la carotte sont publiés. Dans cet article la carotte boîte PS2863-2BC est juxtaposée à la carotte par gravité PS2863-1 prélevée au même site et sont ainsi considérées comme une séquence composite (PS2863).
Le mémoire a été construit sous forme d'un article scientifique et a été soumis à la revue Quaternary Science Reviews le 12 mai 2017. Le cœur de l'article a donc été produit selon les directives de la revue et a été rédigé en anglais.
AVANT-PROPOS ... iv
LISTE DES FIGURES ... vii
LISTE DES TABLEAUX ... xi
LISTE DES ABRÉVIATIONS ... xii
LISTE DES SYMBOLES ... xv
RÉSUMÉ ... xvii
INTRODUCTION ... 1
CHAPITRE I P ALEOCEANOGRAPHY OF NORTHEASTERN FRAM STRAIT SIN CE THE LAST GLACIAL MAXIMUM: PAL YNOLOGICAL EVIDENCE OF LARGE AMPLITUDE CHANGES ... 3
ABSTRACT ... 4
1 .1 Introduction ... 5
1.2 Regional hydrography ... 7
1.3 Methods ... 9
1 .4 Chronology of the cores ... 11
1.5 Results ... 12
1.5 .1 Palynological assemblages ... 12
1.5 .2 Reconstructions of sea-surface conditions ... 16
1 .6 Discussion ... 18
1.6.1 The LGM paradox ... 18
1.6 .2 Transition from the LGM to the postglacial.. ... 21
1.6.3 The setting of full "interglacial" conditions ... 29
1.7 Conclusion ... 31
VI
1 0 9 References 0 0 0 0 0 0 0 0 0 0 0 0 0 0 0 0 0 0 0 0 0 0 0 0 0 0 0 0 0 0 0 0 0 0 0 0 0 0 0 0 0 0 0 0 0 0 0 0 0 0 0 0 0 0 0 0 0 0 0 0 0 0 0 0 0 0 0 0 0 0 0 0 0 0 0 0 0 0 0 0 0 0 0 0 0 0 0 0 0 0 0 0 0 0 0 0 0 0 0 0 0 0 0 0 0 0 34
CONCLUSION 0 0 00 0 00 0 000 0 000 0 0 0 0 0 000 0 0 0 0 0 0 0 0 0 0 0 0 0 0 0 0 0 0 0 0000 0 00 0 0 0 0 0 0 0 0 000 0 0 0 0 0 oo 0000 0 0 0 000 0 00 0 0 0 0 0 0 0 000 0 0 00 00 0 0 0 0 0 0 0 0 0 0 0 68 APPENDICE A
DÉNOMBREMENT ET CONCENTRA TI ONS DES PALYNOMORPHES 00 0 000 0 0 00 0 72
APPENDICEB
RÉSULTATS DES RECONSTITUTIONS 0 0 0 000 0 0 0 000 o o o ooo o o o oooooo o o o o ooo o o o o o o o ooo o o o oooooooooooo o o o l 0 1
Figure Page 1.1 Map of the main surface currents in Fram Strait and around Svalbard and
location of the study sites MSMS/5-712-2 and PS2863 (yellow stars).
Limits of minimum (September) and maximum (March) median sea-ice co ver extent from 1979 to 2016 are represented by blue and gray dotted lines, respectively, from the Sea lee Index (Fetterer et al., 2016). Red
arrows indicate the warmer Atlantic waters derived from the North Atlantic
Drift and were reproduced with respect to Walczowski et al. (2005). Blue
arrows indicate cold surface water currents. In the Svalbard close up, the
Arctic Coastal Front and the Polar Front are depicted, shawn by a dotted
and a uniform black line, respectively. The locatios of other cores discussed
in the text is indicated by black dots. Main features of the sea-floor such as
the Yermak Plateau (YP), the Storfjorden and the Mohn and Knipovich Ridges are also indicated on the map. EGC: East Greenland Current, WSC: West Spitsbergen Current, NwASC: Norwegian Atlantic Slope Current,
NwAC: Norwegian Atlantic Current, ESC: East Spitsbergen Current, SCC:
South Cape Current, RAC: Return Atlantic Current, SB: Svalbard Branch, YB: Yermak Bran ch ... 54
1.2 Age madel for cores MSMS/5-712-2, PS2863-1 and PS2837-5 (see Table
1.2 for data and text section 1.4). The red line corresponds to the weighted average. The darker gray areas show the most probable ages. The dates are indicated yellow and the correlated tie points are indicated in blue, with
organic carbon (cf. Müller and Stein, 2014), (2) correlations with the
western Svalbard magnetic susceptibility stack of Jessen et al. (2010) from
Müller and Stein (2014), (3) sedimentological correlation with core
PS2837-5 based on IRD (this study; see triangle and dotted lines), (4)
correlation of a fine-grained layer in core PS2863-1 with the rapidly
deposited layer in the western Svalbard (Jessen et al., 2010). The vertical
shaded zone corresponds to the interval of the rapidly deposited sediment
layer defined by Jessen et al. (2010) including its 95% probability. Since the rapid sedimentation rate interval is a well-documented regional event
(Jessen et al., 2010; Lucchi et al., 2015), we added hiatuses at the depths of
the first and last age of the event so the model would interpret the
accumulation rate of this interval separa tel y ... 56
1.3 Palynomorph concentrations at sites PS2863 and MSMS/5-712-2. Dinocyst fluxes are represented by a thick line ... 58
1.4 Percentages of dinocyst taxa at site MSMS/5-712-2. Zones described in the text are delimited by dotted lines. The age of the LGM is established
according to the MARGO working group (Kucera et al., 2005). The age of
the Heinrich event 1 (H 1), is determined according to Gibb et al. (20 14). Limits of the B~lling-Aller~d (BA) and the Younger Dryas (YD) intervals
are set according to Rasmussen et al. (2006); the divisions between Early,
Mid- and Late Holocene follow suggestions by Walker et al. (2012). On the calibrated age axis, the black bar indicates the interval of the rapidly deposited sediment layer described by Jessen et al. (2010), including its 95% probability while the gray bar represents the rapidly deposited
1.5 Percentages of dinocysts taxa at site PS2863. For explanations see Fig. 1.4 ... 60 1.6 Light micrographs and SEM photographs of the morphological variations
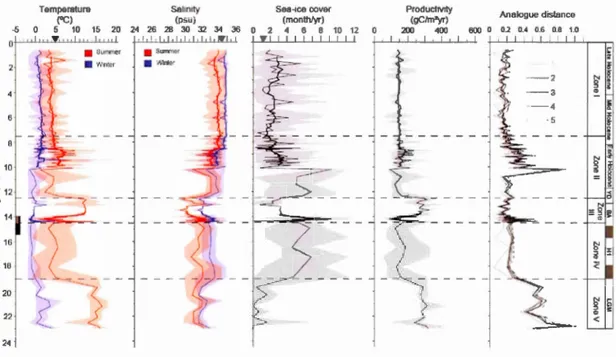
of Spiniferites ramosus and Nematosphaeropsis labyrinthus during the 14.5-11.5 ka interval in cores PS2863-1 and MSM5/5-712-2 ... 61 1.7 Reconstructions of sea-surface conditions at site MSM5/5-712-2 including
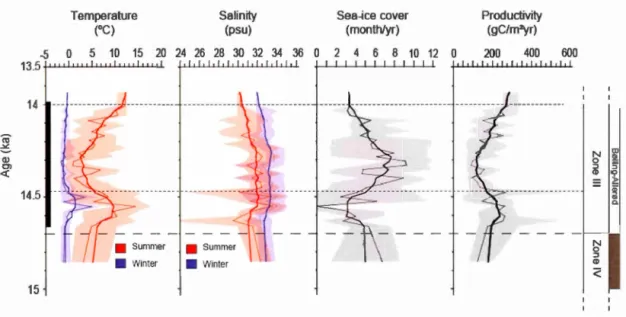
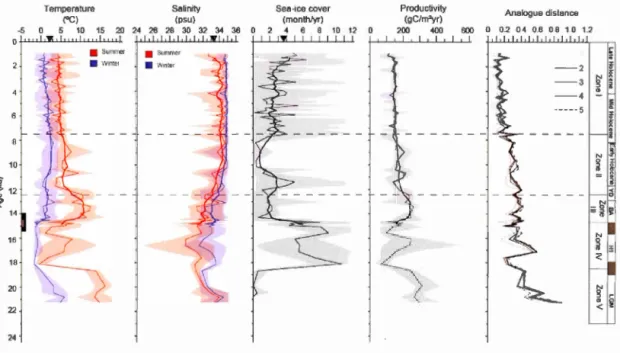
summer and winter SSTs in red and blue, respectively, summer and winter SSSs in red and blue, respectively, sea-ice co ver duration, and productivity. Mean values are represented by a thin line, the thick line shows a five-point running average. Maximum and minimum values are represented in brighter shading. At the right is the distance of the five closest analogues. The calculated threshold value for poor analogue is 1.2. Black triangles indicate modern values at the core site (SSTs and SSSs in summer) from the World Ocean Atlas 2001 (Conkright et al., 2002) and the average sea-ice cover extent from NSIDC data. Zones as described in the text are divided by horizontal black dotted lines. On the calibrated age axis, the black bar indicates the interval of the rapidly deposited sediment layer as defined by Jessen et al. (2010), including its 95% probability while the gray bar represents the rapidly deposited sediment layer at the site ... 64 1.8 Close-up of sea-surface conditions at site MSMS/5-712-2 during the
B(ijlling-Aller(ijd interstadial. The two finer dotted lines indicate the limits of a cooling event. For explanations see Fig. 1.7 and text section 1.6.2 ... 65 1.9 Reconstructions of the sea-surface conditions at site PS2863 including
summer and winter SSTs in red and blue, respectively, summer and winter SSSs in red and blue, respectively, sea-ice co ver duration, and producti vit y. For explanations see Fig. 1.7 ... 66
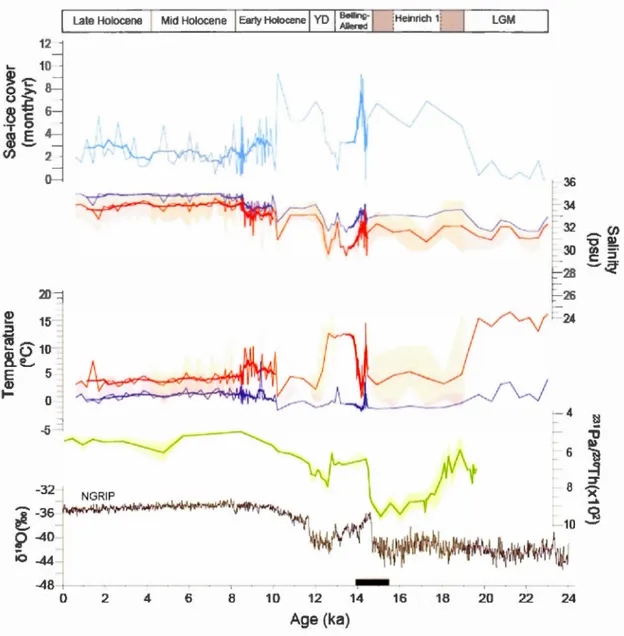
1.10 Sea-surface reconstructions at site MSM5/5-712-2 including sea-ice cover seasonal duration, SSTs in summer (red) and winter (blue), SSSs in summer (red) and winter (blue) in correlation with the 231Pa!230Th record
(green) as a proxy of AMOC strength (McManus et al., 2004), and
o
180data (gray) from the NGRIP ice core (Andersen et al., 2004b). On the calibrated age axis, the black bar indicates the interval of the rapidly deposited sediment layer defined by Jessen et al. (2010), including its 95%
x
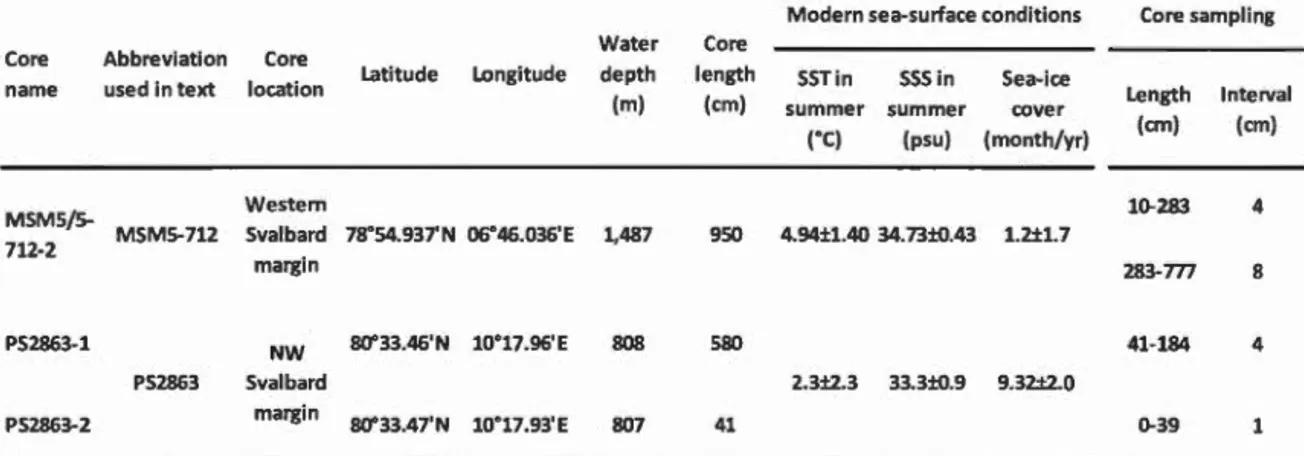
1.2 Infomation on cores ... 50
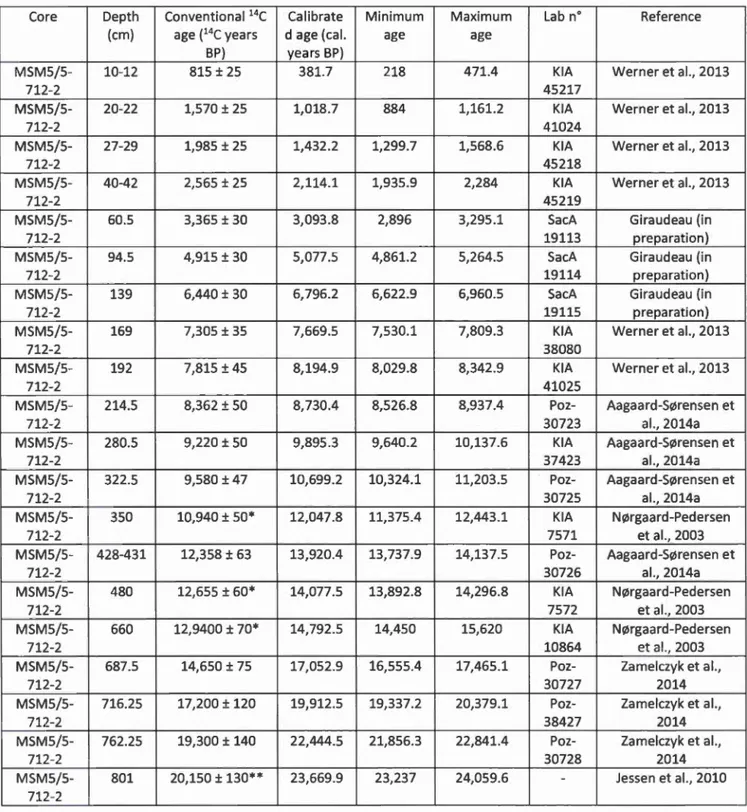
1.2 Radiocarbon chronology of cores MSMS/5-712-2, PS2863-1 and
AMOC AMS AW
BP
c
cal. yr cf. E e.g.Atlantic meridional overturning circulation
Circulation méridienne de retournement de 1' Atlantique
Accelerator mass spectrometry
Accélérateur par spectrométrie de masse
Atlantic Water Eau atlantique Before Present Avant l'actuel Carbone Calibrated year Année calibrée Confer Se reporter à Est Exempli gratia
Par exemple
EGC East Green/and Current
Courant est groenlandais
et al. Et alli Et autres Hl HCl HF i.a. LGM Heinrich event 1 Événement d'Heinrich 1 Acide chlorhydrique Acide fluorhydrique Inter alia Entre autres
Last Glacial Maximum Dernier maximum glaciaire
N Nord
NAD North Atlantic Drift
Dérive nord atlantique
0 Oxygène
Th
wsc
YD
Thorium
West Spitsbergen Current Courant ouest du Spitzberg
Y ounger Dryas Dryas Récent
% Pourcent
< Plus petit que
> Plus grand que
Environ ± Plus ou moins Delta 0 Degrés Degrés celsius !J.m Micron cm Centimètre km Kilomètre
kyr rn mg psu Sv TW yr Thousand years Millier d'années Mètre Milligramme
Pratical salinity unit Unité de salinité pratique
Sverdrup
Térawatt
Year Année
L'est du Détroit de Fram est le principal lieu de passage des eaux nord-atlantiques vers 1' océan Arctique. Le transport des eaux atlantiques s'accompagne de flux de chaleur qui ont une incidence immédiate sur la couverture de glace de mer et par conséquent
sur le bilan énergétique dans le domaine arctique. Les conditions des eaux de surface
des derniers 23 000 ans dans le nord-est du Détroit de Fram ont été reconstituées à
partir des résultats de l'analyse palynologique de sédiments marins aux sites MSMS/ 5-712-2 (78°54.94'N- 6°46.04'E) et PS2863 (80°33.46'N - l0°17.96'E). La technique des analogues modernes appliquée aux assemblages de dinokystes démontrent des variations de grande amplitude semblables aux deux sites en ce qui a trait à la température, la salinité, la couverture de glace de mer et la productivité des eaux de surface.
Le dernier maximum glaciaire se caractérise par un faible couvert de glace mer saisonnier ( < 2 mois/an) et des températures relativement élevées dans les eaux de surface en été Uusqu'à 16°C), soulignant une grande amplitude saisonnière. Une telle reconstitution des conditions de surface lors du dernier maximum glaciaire doit être néanmoins considérée avec précaution étant donné une situation de mauvais analogues, ainsi que de faibles concentrations de dinokytes. Les conditions relativement douces que l'on reconstitue pourraient correspondre à une advection occasionnelle des eaux nord-atlantiques dans un milieu généralement froid, occupé par un couvert de glace de mer quasi-péren et une productivité primaire presque nulle. Entre -19 000 et 14 700 ans calibrés (cal.) BP (Before Present), les températures des eaux de surface sont basses (± 4.5°C en été) et s'accompagnent d'une hausse de la concentration en palynomorphes remaniés indiquant une augmentation de l'érosion et de l'apport de matériel fluvioglaciaire aux deux sites. Cet intervalle est interrompu par une augmentation rapide de la température des eaux de surface atteignant 14
oc
entre 14 700 ans et 14 500 ans cal. BP. Elle est suivie par un événement froid marqué par une baisse des températures estivales d'environ 4°C et par une augmentation du couvert de glace de mer qui se prolonge jusque vers 14 100 ans cal. BP. Durant 1 'Allemd, des températures estivales relativement élevées (moyenne de 12,5°C) et des salinités faibles ( < 31 psu) caractérisaient les eaux de surface. De telles conditions pourraient correspondre à une advection prononcée des eaux nord-atlantiques et à la stratification de masses d'eau desurface moins denses. Peu après le début Dryas Récent, à 12 600 ans BP, une baisse de 10°C des températures des eaux de surface est notée, ainsi qu'une hausse de la salinité de 2 psu en été. Cette transition indiquerait une réduction de l'apport d'eaux de fonte, ainsi qu'une réorganisation majeure des courants de surface dans le Détroit de Fram
qui s'illustre entre autres par l'installation de fronts océaniques à l'ouest et au nord -ouest du Svalbard. La salinité continue d'augmenter jusqu'à 7 600 ans BP. Une transition est alors enregistrée dans les assemblages de dinokystes, dorénavant semblables à ceux de l'actuel dans l'ouest du Svalbard, marquant ainsi l'installation des conditions océaniques modernes. Durant 1 'Holocène moyen et tardif, un léger refroidissement est enregistré. Il est principalement défini par une baisse des températures des eaux de surface en hi ver de ~ 1 ,5°C.
MOTS-CLÉS: Détroit de Fram, dinokystes, dernier maximum glaciaire, déglaciation, Dryas Récent, Holocène
Les eaux nord-atlantiques, qui sont relativement chaudes et salines, circulent vers le nord et atteignent l'océan Arctique en suivant différentes trajectoires, notamment via le Détroit de Fram (Figure 1.1 ). Le Détroit de Fram est 1 'unique corridor profond entre 1' océan Arctique et 1 'océan Atlantique et constitue ainsi le lieu de passage de la plus importante source de chaleur de l'Océan l'Arctique (Maslowski et al., 2004). Des variations dans 1 'intensité de ces masses d'eau nord-atlantiques jouent conséquemment un rôle décisif quant aux limites du couvert de glace de mer et par la suite, sur l'albédo et le bilan énergétique dans le domaine arctique. Au début du 21 ième siècle, les eaux nord-atlantiques circulant dans le Détroit de Fram auraient atteint les températures les plus élevées des derniers 2000 ans (Spielhagen et al., 2011). En considérant la sensibilité de 1 'Arctique vis-à-vis les changements du climat, généralement désignée comme le phénomène d'amplification arctique, il est essentiel de bien circonscrire la relation entre l'advection de chaleur des eaux nord-atlantiques et les changements du climat. L'étude du passé permet de retracer les causes et effets des flux d'eaux atlantiques selon différents scénarios climatiques et dans des contextes environnementaux diversifiés.
Au cours des derniers 23 000 ans, des variations importantes ont déjà été enregistrées dans le Détroit de Fram à partir de traceurs micropaléontologiques des masses d'eau profondes et intermédiaires (Hald et al., 2007, 2001; Rasmussen et al., 2012, 2007; Sarnthein et al., 1995; Slubowska-Woldengen et al., 2008, 2007; Zamelczyk et al., 2014). Toutefois, seulement quelques études font état de reconstitutions des conditions dans les eaux de surface. Ces études portent principalement sur la couverture de glace de mer (Müller et Stein, 2014; Müller et al., 2012) ou des températures durant le dernier
maximum glaciaire (Rosell-Melé et Cornes, 1999) et 1 'Holocène (Risebrobakken et al.,
2011). L'information sur les conditions des eaux de surface reste donc limitée et incomplète dans l'est du Détroit de Fram, particulièrement en ce qui a trait aux changements de la salinité, qui ont pourtant un effet déterminant sur la circulation thermohaline.
Dans ce contexte, ce mémoire vise à reconstituer les conditions des eaux de surface dans 1 'est du Détroit de Fram depuis le dernier maximum glaciaire, afin d'être en mesure de mieux circonscrire 1 'influence des eaux nord-atlantiques à travers les différentes phases de la déglaciation et au cours de 1 'Holocène. Les reconstitutions des
conditions des eaux de surface sont basées sur la technique des analogues modernes
(Modern Analogue Technique; MAT; Guiot, 1990) utilisée avec les assemblages de kystes de dinoflagellés. Les dinoflagellés sont des protistes algaires autotrophes et/ou hétérotrophes dont certaines espèces forment un kyste ( dinokyste) lors de leur cycle de
reproduction sexuée. Ce kyste est le plus souvent composé de matière organique
réfractaire. La distribution des différents assemblages de dinokystes varie en fonction de paramètres du milieu ambiant tels que la température, la salinité et les nutriments. Les reconstitutions portent ainsi sur les températures (0
C) en été et en hiver, la salinité (psu) en été et en hiver, la couverture de glace de mer (mois/an) et la productivité primaire (gC/m2an). Les deux sites étudiés (MSMS/5-712-2, 78°54.94'N-6°46.04'E; PS2863, 80°33.46'N - l0°17.96'E) sont respectivement situés à l'ouest et au nord-ouest du Svalbard. Les sites se trouvent ainsi dans la trajectoire des eaux nord-atlantiques qui circulent à l'est du Détroit de Fram par le courant ouest du Spitzberg (West Spitsbergen Current; WSC) (Figure 1.1). Il s'agit donc d'endroits clés pour évaluer la variation de l'intensité de l'advection de chaleur via le courant WSC dans le temps et dans 1 'espace.
PALEOCEANOGRAPHY OF NORTHEASTERN FRAM STRAIT SINCE THE LAST GLACIAL MAXIMUM: PALYNOLOGICAL EVIDENCE OF LARGE
AMPLITUDE CHANGES
Jade Falardeau 1 *, Anne de Vernal', Robert F. Spielhagen 2
• 3
1. GEOTOP-UQAM CP 8888 Montréal, H3C 3P8, Canada
2. GEOMAR Helmholtz Centre for Ocean Research, 24148 Kiel, Germany
3. Academy of Sciences, Humanities and Literature, 55131 Mainz, German y
Sea-surface conditions in northeastern Fram Strait since the last glacial maximum (LGM) have been reconstructed from the analyses of dinocyst assemblages in cores MSM5/5-712-2 and PS2863/l-2. During the LGM, eastern Fram Strait was occasionally sea ice-free and characterized by large seasonal contrasts of SSTs from freezing in winter to relatively mild summer conditions (up to 16°C). However, such sea-surface reconstructions are equivocal because of the weak analogue situation and the low dinocyst concentrations. Between 19 and 14.7 ka, sea ice up to 9 months/yr, low summers SSTs (,..., 4.5°C), and abundant reworked palynomorphs suggest harsh conditions and intense glacial erosion, during an early stage of the deglaciation in western Svalbard. At 14.7-14.5 ka, an abrupt warming is recorded with summer SSTs reaching up to ,...,l4°C. During most of the B~lling-Aller~d, summer SSTs of about 12.5°C prevailed while SSSs < 31 psu indicate continuous freshwater inputs. At 12.6 ka, a change in sea-surface conditions marked by a 1
ooc
cooling in summer and SSSs increase of ,...,2 psu would correspond to the regional onset of the Younger Dryas. On a regional scale, the 12.6-12 ka interval is an important transition marked by decreased meltwater inputs and the establishment of coastal fronts along the western and northern Svalbard margins. Modern-like oceanic conditions with relatively high salinity (> 33 psu) and low seasonal temperature contrasts (1.3°C - 4.3°C from winter to summer) developed at about 7.6 ka. Since then, a slight cooling trend of about 1.5°C has been recorded especially in winter.KEYWORDS: Fram Strait, Last Glacial Maximum (LGM), Late and Post-Glacial, Holocene, temperature, salinity, sea ice, dinocysts
1.1 Introduction
The northernmost extension of the North Atlantic Drift (NAD) reaches the Arctic Ocean through the Fram Strait, which is the main gateway between the Atlantic and the Arctic oceans (Fahrbach et al., 2001; Maslowski et al., 2004; Schauer, 2004). Hence, the NAD acts as a major heat source in the Arctic Ocean and shapes the northern limit of the regional sea-ice margins, which in turn plays a determinant role for the energy budget. As the Atlantic Water (AW) flows northward in eastern Fram Strait, heat loss to the atmosphere accompanied with surface water cooling and increased density leads to convection, thus contributing to the formation of North Atlantic Deep Water (NADW) and to the strength of the Atlantic Meridional Overturning Circulation (AM OC). From this point of view, the oceanography of the Fram Strait is key not only for the elima te in the Arctic realm but also for the thermohaline circulation of the ocean.
In this context, the objective of the present study is to document changes in sea-surface conditions in the northeastern Fram Strait since the last glacial maximum (LGM; 23-19 ka; cf. Kucera et al., 2005) in order to assess on the role of northward heat flux through the NAD on the regional deglaciation and climate variations during the postglacial.
Many studies investigated the changes in A W inflows in western Svalbard during the LGM and the deglaciation. Most of them are based on planktic and/or benthic foraminifer assemblages and stable isotope analyses of foraminifer shells (cf. Hebbeln et al., 1994; Sarnthein et al., 1995, 2003; N(lirgaard-Pedersen et al., 2003; Hald et al., 2001, 2007; Slubowska-Woldengen et al., 2007, 2008; Rasmussen et al., 2007, 2012; Werner et al., 2011, 2013, 2016; Aagaard-S(Iirensen et al., 2014a-b, Chauhan et al., 2014; Zamelczyck et al., 2014; Bartels et al., 2017). Other studies are based on sedimentological data (Andersen et al., 1996; Forwick and Vorren, 2009; Jessen et al., 2010). However, whereas these studies document paleoceanographical conditions in sub-surface and bottom waters, there is stilllittle information on the surface waters at
regional scale. To date, the studies of past sea-surface conditions mostly document on
sea-ice cover based on IP25 (Müller et al., 2012 Müller and Stein, 2014, Bartels et al.,
20 17) and temperature estimated from alkenones during the LGM (Rosell-Me lé and
Cornes, 1999) and the Early Holocene (Risebrobakken et al., 2011). The data documenting the variation of sea-surface conditions including seasonal temperatures
and salinity in the western Svalbard area since the LGM in western Svalbard remain
rare.
Here, we present two new palynological data records covering the last 23,000 years focusing on dinoflagellate cyst populations, which permit to reconstruct
simultaneously severa! sea-surface parameters, including winter and summer
sea-surface temperatures (SSTs) and sea-surface salinities (SSSs), along with sea-ice cover
extent (month/yr) and productivity (gC/cm2/yr). Hence, our data may provide clue on
freshwater discharges and seasonal gradients of temperatures (Rochon et al., 1999; de Vernal et al., 2001,2005, 2013; Gry;sfjeld et al., 2009) which are key parameters in ice-ocean dynamics, especially during deglacial phases. The study sites MSM5/5-712-2
and PS2863 from the western and the northwestern continental slopes of Svalbard, res pee ti v ely (Fig. 1.1; Table 1.1), pro vide sui table stratigraphie framework for the interval of interest (cf. Werner et al., 2013; Aagaard-Sy;rensen et al., 2014a; Zamelczyk
et al., 2014). Moreover, previous work based on biomarkers and stable isotopes have
illustrated that site MSM5/5-712-2 is a good location to document, at least qualitatively, the changes of the A W inflows and its impact on the sea-ice co ver extent
(Werner et al., 2011, 2013; Müller et al., 2012; Müller and Stein, 2014; Spielhagen et
al., 2014; Zamelczyk et al., 2014). In addition to develop a more detailed portrait of the
surface water processes from the LGM to present, the study of these two sites aims at
contributing to a better understanding of the A W modifications along its pathway, from
the relatively confined channel of the eastern Fram Strait to the open Arctic Ocean
1.2 Regional hydrography
There are two main currents in Fram Strait (Fig. 1.1; Fahrbach et al., 2001; Schauer, 2004; Rudels et al., 2005; Schauer et al., 2008). In the west, the East Greenland Current (EGC) flows southward and transports cold and fresh waters from the Arctic Ocean, thus playing a major role in icebergs and sea-ice export to the North Atlantic. In the east, the West Spitsbergen Current (WSC) circulates northward along the west continental slope of Svalbard and carries relatively warm and saline Atlantic waters towards the Arctic Ocean. The WSC thus constitutes the northernmost branch of the NAD. It originates from two distinct branches in the Nordic Seas: the Norwegian Atlantic Slope Current (NwASC) and the Norwegian Atlantic Current (NwAC), further named the WSC western branch. Part of the NwASC turns east at the surface into the shallow Barents Sea (Rudels et al., 1999), where it is responsible for a significant flux and heat transport (5.07 Sv; 106 TW; Maslowski et al., 2004), while the rest continues north as the WSC core. Parts of the WSC western branch bifurcate to the west following topographical features to finally turn south with the EGC (Gascard et al., 1995). The WSC western branch and the NwASC converge into the WSC core around 78°N due to the bottom topography (Walczowski and Piechura, 2007).
Because of the complex bathymetry of the Fram Strait, the WSC core splits further on into three branches (Man ley, 1995). A western branch recirculates in Fram Strait as part of the Return Atlantic Current (RAC), without extending further than 80-81 °N (Rudels et al., 2000). A central branch called the Yermak Branch (YB) flows north and reaches the Arctic Ocean along the western and northern shelf of the Yermak Plateau (YP). The third branch is the Svalbard Branch (SB) that flows east following the northern Svalbard shelf and continues by circulating south of the Yermak Plateau at
depth reaching 600 m.
Arctic waters circulate southward through the East Spitsbergen Current (ESC) and follow the east Svalbard coast in the Barents Sea (Loeng, 1991). The ESC is renamed
as the South Cape Current (SCC) after passing the Storfjorden, in south Svalbard, and follows the western coast of Svalbard carrying freshwater from glaciers melt and ri vers run off in summer (Skogseth et al., 2005). Storfjorden is an area of deep water formation as dense waters formed from brine rejection flow along the slope into the deeper Fram Strait (Rudels et al., 2005).
The WSC transports about 11.6 Sv at 78°50'N corresponding to 70.6 TW of heat (Walczowski et al., 2005). Previous studies from moored instruments obtained similar values with mean annual transport of 9 ± 2 to 10 ± 1 Sv (Schauer, 2004) and a monthly mean average over two years of9.5 ± 1.4 Sv (Fahrbach et al., 2001).
The regional sea-ice caver extent is mainly controlled by the advection of warrn AW. Site MSMS/5-712 is located under the path of the WSC on the western continental slope of Svalbard and it is therefore largely influenced by the A W. Site PS2863 is located 200 km north of MSMS/5-712 downstream of the WSC. It is located close to the distal influence of the A W and close to the limit of mean sea-ice extent in summer, which corresponds to the Polar Front.
At site PS2863, the mean sea-surface temperature and salinity in summer are 2.3 ±
2.3°C and 33.3 ± 0.9 psu, respectively (1900-2001 data from the World Ocean Atlas 2001; Conkright et al., 2002; Table 1.1). The sea-ice caver is highly variable at the coring site since it is located at the vicinity of the sea-ice margin. Hence, the sea-ice caver with concentration> 50% varied between 0 and 11 months/yr from 1954 to 2003, with an average of 3.7 ± 3.2 months/yr (data provided by the National Snow and lee Data Center -NSIDC- in Boulder). At site MSMS/5-712, the mean-sea surface temperature and salinity in summer are 4.9 ± 1.40
oc
and 34.73 ± 0.43 psu, respectively (Conkright et al., 2002; Table 1.1). From 1954 to 2003, sea-ice caver with concentration > 50% varied between 0 and 6 months/yr with an average of 1.2 ± 1 .7 month/yr (data from NSIDC, 2003).1.3 Methods
Gravity core PS2863-1 (80°33 .46'N, 10°17 .96'E; water depth 808 rn) was collected in 1997 during RV Polarstem expedition ARK-XIII/2 (Stein and Fahl, 1997). The core is
580 cm long. The uppermost 183 cm were subsampled at 4 cm intervals for
palynological analyses. Box core PS2863-2 from the same location is 41 cm long. It
was subsampled at 1 cm intervals (Table 1.1). Here we used a composite sequence referred to as PS2863 by combining the box core data for better time resolution in the upper part of the record and gravity core data below 39 cm.
Sediment core MSM5/5-712-2 (78°54.94'N, 6°46.04'E; water depth 1487 rn) was retrieved from RV Maria S. Merian in 2007 (Budéus, 2007). The kastenlot core has a
totallength of950 cm. Palynological results from this core (hereafter MSM5-712) are
presented at 4 cm intervals for the uppermost 283 cm and at 8 cm intervals down to 777 cm (Table 1.1).
Samples were prepared for palynological analyses in the rnicropaleontology laboratory
of GEOTOP according to standard procedures (de Vernal et al., 2010). Briefly,
approximately 5 cc of sediment were wet sieved at 10 and 106 Jlffi after addition of one
Lycopodium clavatum capsule with a known number of spores for further palynomorph
concentration calculations (Matthews, 1969). Dinocyst and other palynomorph
concentrations were calculated as follows:
Np = (Ne x np )/ne
Where Np is the total number of dinocysts in the sample, Ne is the known number of
Lycopodium clavatum spores in the capsule added to the sample, np is the number of
dinocysts counted and ne is the number of Lycopidum clavatum counted. The
concentrations lead to calculate dinocyst fluxes as follows:
Flux (nb/cm2/yr) =Sedimentation rate (crn/yr) x Concentration (nb/cm3
Where sedimentation rate corresponds to interpolated sedimentation according to the age vs. depth relationship established based on 14C dating and sedimentological correlations with other cores using the Bayesian software Bacon 2.2 developed by Blaauw and Christen (2011) (see Fig. 1.2). The 10-106 pm fraction was treated with hydrochloric acid (HC1 10%) and hydrofluoric acid (HF 49%) in order to dissolve the carbonate and the silica particles, respectively. Residues were mounted between slides and cover slide in glycerin gel for microscopie analysis.
Analysis of the palynological content includes dinoflagellate cysts (or dinocysts), foraminiferal organic linings and reworked pre-Quatemary palynomorphs. Pollen grains, spores and other palynomorphs were also counted (see Falardeau 2017), but not used here. Dinocyst species were identified using the standardized taxonomy and nomenclature of Roch on et al. (1999). On average, 318 dinocysts were counted per sample, except in the LGM samples (110 specimens on average), which are characterized by very low concentrations.
Reworked palynomorphs, which result from the erosion of older sedimentary rocks and subsequent deposition (Streel and Bless, 1980), in elude pollen grains, spores, acritarchs as well as dinocysts. They were distinguished by a darker col or and a flattened morphology owing to the longer preservation period in the sediment. A number of well-preserved palynomorphs identified at genus or farnily level to be stratigraphically older than Quatemary were also counted as reworked (cf. Williams and Brideaux, 1975). Quantitative reconstructions of sea-surface parameters were made using the Modem Analogue Technique (MAT; Guiot, 1990) applied on the dinocyst assemblages following the procedures described by de Vernal et al. (2013). We have calculated the most probable values from a set of 5 analogues identified in the reference dinocyst database which includes data from the Greenland margins (cf. Allan et al., in prep.) in addition to data from the n = 1492 database (de Vernal et al., 2013) for a total of 1777 sites. The procedure used for reconstruction is the same as in de Vernal et al. (2013). It
consists in log-transformation of the 66 dinocyst taxa. The distance between modern
and fossil spectra (sum of the differences in taxa occurrence expressed in log values) allows identifying the 5 best analogues. The most probable sea-surface values correspond to the average of the selected analogues, weighted inversely to the distance. Poor analogues having a distance larger than a threshold value of 1.2 are excluded from
the reconstructions. The uncertainty of sea-surface reconstructions or the error of
prediction are established at± l.4°C and± 2.0°C for the sea-surface temperatures in winter and summer respectively, ±1.9 psu for the salinity in summer and± 1.6 month/yr
for the sea-ice cover (cf. Allan et al., in prep.). The error of prediction is large for salinity due to the high variability in the low salinity domain. When considering only
the> 30 psu salinity range, the uncertainty is ± 0.73 psu. 1.4 Chronology of the cores
The chronology of core MSM5-712 (Table 1.2; Figure 1.2) is based on 18 accelerator
mass spectrometry (AMS) 14C dates obtained on Neogloboquadrina pachyderma and compiled by Müller et al. (2012) and Müller and Stein (2014). Additional age tie points
were obtained from correlations with the total organic carbon content of PS2837 -5
(N!Zirgaard-Pedersen et al., 2003) and the western Svalbard reference stratigraphy of
Jessen et al. (2010) (for details see Müller and Stein, 2014). A distinct interval of rapid sedimentation rate is weil represented in core MSM5-712 between 657 and 433 cm.
The chronology of core PS2863-l is based on five AMS 14C dates on N. pachyderma (Table 1.2; Fig. 1.2). In addition, a sixth chronological tie point was obtained from stratigraphie correlation with the nearby core PS2837 -5 (81 o 13 .99'N, 02°22.85'E) from
the western slope of the Yermak Plateau (N!Zirgaard-Pedersen et al., 2003) based on a
weil identified IRD peak which was found at 106.5 cm in core PS2863-1 (Fig. 1.2). This peak bas an age of 14,202 ± 285 cal. years BP in core PS2837-5 according to our age model. Further, a very fine grained laminated layer at 133-120 cm in core PS2863-1 was associated with a regional sedimentary event recorded ali along the north western
Barents Sea and the western Svalbard continental slopes up to the Yermak Plateau (Jessen et al., 2010; Lucchi et al., 2015). In Jessen et al. (2010), the interval started at
13,140 ± 150 14C years BP and ended at 12,840 ± 150 14C years BP, which corresponds
to 14,931 ± 560 and 14,434 ± 620 cal. years BP, respectively. This sedimentological
event may have been caused by the cold turbid meltwater originating from the retreat of the Barents Sea lee Sheet during the earl y B!Z)lling interstadial (Jessen et al., 20 10; Lucchi et al., 2015). The rapidly deposited sediments in core MSM5-712 occurs within the limits of the unit described by Jessen et al. (2010) with a weighted mean age of
14,660-13,930 cal. years BP.
The age-depth relationship of cores PS2863-1, MSM5-712 and PS2837-5 was defined
by the Bacon 2.2 software that uses Bayesian statistics with default probability intervals
of 95% (2-sigma) (Blaauw and Christen, 2011). Ail the original and correlated AMS
14C ages were calibrated using the Marine13 calibration curve of Reimer et al. (2013)
with an additional correction (delta R) of 98 ± 37 years calculated from six values from
the Svalbard area (Olsson, 1980; Mangerud, 1972; Mangerud and Gulliksen, 1975) in
the Marine Reservoir Data Base of Calib 7.10 (http://calib.org/marine/). Ail the ages in
this study are given as thousand calibrated years before present (ka), unless stated otherwise. We assumed that the surface of the cores was modern with an error of± 460 years for core PS2863-1 and ± 160 years for core MSM5-712. The errors were
determined considering the mean underlying sedimentation rates and mixing by
bioturbation over the upper 3.5 centimeters. The average sedimentation rate of the
rapidly deposited sediment layer found in both cores is calculated to about 43 crn/kyr
in core PS2863-1 and 309 crn/kyr in core MSM5-712. With the exception of this layer,
the mean sedimentation rate in core PS2863-1 is about 8 crnlkyr, which much less than
in core MSM5-712 (27 crnlkyr).
1.5 Results
Dinocysts largely dominate the palynological assemblages at both sites, MSM5-712
and PS2863, with concentrations recording similar positive trends towards present
(Fig. 1.3). The lower part of the studied section, dated prior to 17 ka, contains low dinocyst concentrations (50-1000 cysts/g in PS2863 and 150-800 cysts/g in MSM5-712) while the last 8000 years are characterized by concentrations ranging 104-105 cysts/g, with a maximum recorded in the upper part of the sequence representing the last 4000 years (Fig. 1.3). Core MSM5-712 records about twice higher concentrations
than core PS2863. The concentrations led to calculated fluxes that are one order of
magnitude higher in the la te and postglacial sediments of core MSM5 -712 (~800 cysts/cm2/yr on the average) than those of core PS2863 (~60 cysts/cm2/yr on the
average). Beyond these general characteristics, a double concentration peak is recorded
at ~14.8 and ~13.9 ka in core MSM5-712 (Fig. 1.3). Core PS2863 also recorded maximum concentrations centered at 13.7 and 13 ka. However, the peaks are less pronounced, possibly due to the effect of bioturbation in this core with a lower
sedimentation rate.
The concentrations of benthic foraminifer linings are rangmg from 100 to 2000 linings/g in sediments of the last 14 ka at site PS2863 (Fig. 1.3). In core MSM5-712,
foraminifer lining concentrations continuously increased from 14 ka to present (2500
linings/g on the average) (Fig. 1.3), mirroring the trend in dinocyst concentrations, which suggests a higher primary productivity after 14 ka and high organic carbon
fluxes especially during the Middle-to-Late Holocene. The concentrations of reworked palynomorphs vary from 500 to 2000/g, with highest values in the 20-12 ka interval
(Fig. 1.3).
The dinocyst assemblages show high spec1es diversity, with occurrences of both phototrophic and heterotrophic taxa at the two sites (Figs. 1.4, 1.5). Among the phototrophic taxa, Operculodinium centrocarpum, Nematosphaeropsis labyrinthus,
the assemblages, reaching more than 50% in sorne intervals. The accompanying taxa comprised the Cyst of Pentapharsodinium dalei, Impagidinium pallidum and
Spiniferites spp. (5-20%). Heterotrophic species are represented by Brigantedinium
spp. and Islandinium minutum with low abundance of Islandinium cezare and Selenopemphix quanta(< 5%). Dinocysts are present throughout the record, including heterotrophic taxa that are more sensitive to dissolution (cf. Kodrans-Nsiah et al., 2008), suggesting generally good preservation of organic-walled microfossils in the sediment.
The dinocyst record is characterized by large variations in assemblages since.the last glacial maximum (LGM). The major transitions are generally synchronous in both cores and the assemblages are similar, which allowed us to recognize five distinct dinocyst assemblage zones at regional sc ale (Figs. 1.4, 1.5).
In Zone V (~23-19 ka), the dinocyst assemblages are distinguished by abundant B.
tepikiense reaching up to 40% in PS2863 and 46% in MSM5 -712 of the dinocyst assemblages. The occurrence of this species is a characteristic feature of the LGM interval in the northem North Atlantic (de Vernal et al., 2005). According toits modem distribution, B. tepikiense tolera tes high amplitude variation of seasonal temperature and relatively low salinity in stratified surface waters (Rochon et al., 1999; de Vernal et al., 2001, 2005). The occurrence of O. centrocarpum, which is a cosmopolitan species, is also high with a relative abundance of about 30%. Three peaks of
Brigantedinium spp. (33%, 53% and 20%) are observed, but only at site MSM5-712.
The dinocyst assemblages in core MSM5-712 also holds low but significant concentrations of more tempera te species su ch as Spiniferites mirabilis ( < 3 .5%) and
Lingulodinium machaerophorum ( < 5%).
Zone IV, which spans ~19 to 14.7 ka, is characterized by the dominance of
Brigantedinium spp. with a relative abundance of 76-94% at site PS2863 and of
O. centrocarpum (0-10%). Such an assemblage reflects harsh conditions and dense
sea-ice cover (cf. Rochon et al., 1999; de Vernal et al., 2001, 2013).
Zone III spans from 14.7 to 12.6 ka and thus covers most of the B0lling-Aller0d interstadial (14.7-12.9 ka; Rasmussen et al., 2006). It also comprises the interval
marked by very high sedimentation rates. This interval is distinguished by short-lived
variations of high amplitude in the dinocyst assemblages, but also by discrepancies
between the two records. At site PS2863, the dinocyst assemblages are mainly
dominated by Spiniferites taxa, mostly S. elongatus from 14.7 to 13.7 ka, and S.
ramosus from 13.7 to 12.6 ka. In this interval, the specimens of S. ramosus include
wide ranges of morphologies with regard to body size and shape, the length of
processes and the presence/absence of an apical boss. They also include specimens
with processes joined by more or less complete trabecula network, ranging from a
typical S. ramosus to a Nematosphaeropsis-like morphology (Fig. 1.6). At site
MSM5-712, the interval is characterized by a very short peak of B. tepikiense particularly at
14.6-14.5 ka, but Brigantedinium spp. dominates the assemblages from 14.5 to 14.1 ka.
lt is progressively replaced by O. centrocarpum, S. elongatus, S. ramosus, the Cyst of
P. dalei and/. minutum. At 13.2-12.6 ka, O. centrocarpum increases of about 10% at
the expense of S. ramosus. Despite differences between the assemblages of the Zone
III, the two sites are characterized by the significant occurrences of different
morphotypes of S. ramosus.
Zone II covers the latest Pleistocene and the early Holocene (12.6-7.6 ka). lt is
characterized by a high relative abundance of O. centrocarpum and the first significant occurrence of/. pallidum. Beyond these general features, there are differences in the dinocyst assemblages of the two cores, probabl y due to the effect of local hydrographie
conditions. Wh ile the dinocyst assemblages in core MSM5-712 con tain abundant
the dinocyst assemblages at site PS2863 are almost entirely composed of phototrophic taxa su ch as N. labyrinthus, the Cyst of P. dalei and 0. centrocarpum.
Finally, Zone 1 co vers from 7.6 ka to present. lt is characterized by the dominance of O. centrocarpum, which constitutes about 70% of the assemblages in both cores. N.
labyrinthus and /. minutum are the main accompanying taxa while /.pallidum records
about 3-9% in core PS2863, but does not exceed 2% in core MSM5-712. 1.5 .2 Reconstructions of sea-surface conditions
Application of the MAT revealed close analogues for all samples. Hence, 5 analogues were used for the reconstruction in all samp1es with a distance never exceeding the threshold value of 1.2 for a sui table analogue (Figs. 1.7, 1.9). The distances are ac tu ally lower than 0.2 for most samples, which corresponds to very similar analogues. Therefore, the reconstructions appear as reliable as possible for most parts of the records. Largest distances from modem analogues, however, are recorded from ~23 to 19 ka (mean of 0.62 and of 0.61 for MSM5-712 and PS2863, respectively) and also at ± 14.5 ka (mean of0.46) and at 10.7 ka (mean of0.84) at site MSM5-712 and between 17.1 and 16.6 ka at site PS2863 (mean of 0.50). In these intervals, one must be more cautious with quantitative estimates.
The reconstruction of sea-surface conditions from the MATis generally coherent at the two sites (Figs. 1.7-1.9). From 23 to 7.6 ka, high amplitude changes of all parameters are recorded with a distinct higher frequency between 14.7 and 13 ka, especially in core MSM5-712 (Figs. 1.8, 1.9), whereas the establishment of more stable conditions similar to the modem ones occurred after 7.6 ka.
In Zone V spanning ~23-19 ka, sea-surface conditions reconstructed from the MAT point to a strong seasonality with high temperatures in sumrner (13-16.5°C), but low temperatures in winter (1.7-l.9°C). Sumrner salinity was relatively low with a mean of 31.6 psu at site MSM5-712, but the mean was 1 psu higher at site PS2863. Su ch
conditions are compatible with estuarine and coastal environments, where modern
analogues are characterized by B. tepikiense. However, the reconstructions indicate
almost no sea-ice caver and a relatively high primary productivity, which can be
challenged in the context of the LGM. Hence, intervals of low phytoplankton productivity (Rosell-Melé and Cornes, 1999; Müller and Stein, 2014), as well as low dinocyst concentrations (de Vernal et al., 2005, 2006) were reported from the Nordic
Seas during the LGM, which would be coherent with the low dinocyst fluxes at the
study sites (Fig. 1.3).
The Zone IV, from -19 to 14.7 ka, corresponds to the coldest conditions of the entire record with extensive sea-ice caver in winter (5-10 months/yr) and summer SSTs of about 4-5°C at both sites. During this interval, sea-surface salinity remained low, of about 31.1 and 31.7 psu in summer, at sites PS2863 and MSM5-712, respectively.
In Zone Ill, spanning 14.7-12.6 ka, the two sites yielded different results as could be
expected from the discrepancies in the dinocyst assemblages. The sea-surface estimates from the composite core PS2863 indicate reduced sea-ice caver extent (mean of 2.4
months/yr) and warrner summer conditions up to 12.3°C, which corresponds to large
seasonal contrast of temperature. They also point towards saltier surface waters with
an increase of about 1 psu. The estimates from core MSM5-712 suggest warm sea-surface conditions reaching about l2°C in summer, similar as in PS2863, and relatively
low SSSs in summer with an average of 31 psu except in the first 600 years of the interval. The high temporal resolution of analyses in core MSM5-712 perrnitted to identify two short-lived events at -14.7-14.5 ka and at -14.5-14.1 ka (Fig. 1.8). At 14.7
ka a warrn pulse is marked by summer SSTs up to 14.4°C and by 2 months/yr decrease in the sea-ice caver extent. In the first 100 years, the SSSs in summer were low with an average of 30.7 psu, but they increased up to 33.4 psu between 14.6 and 14.5 ka. In the 14.5-14.1 ka interval, calder conditions prevailed with enhanced sea-ice caver reaching a maximum of 9 months/yr. The SSTs drastically decrease down to 0.8°C,
concomitantly with a drop in primary productivity. The SSSs remain relatively low with an average of 31.6 psu.
In Zone II, spanning 12.6 to 7.6 ka, summer SSTs decrease to a mean of 5.5-6°C at both sites, which resulted in reduced amplitude of seasonal temperature. The SSSs increased from 32.2 to 34.3 psu at site PS2863 and from 30.5 to 33.5 psu at site MSM5-712. The sea-ice co ver increased to a maximum of 5 months/yr at 11.4 ka at site PS2863 and to an average of7 months/yr at 11.9-10.7 ka at site MSM5-712, prior to a decrease down to 1-2 months/yr towards the end of the interval.
In the Zone I, corresponding to the last 7,600 years, summer SSTs remained relatively stable with values of about 4.5°C and 4.0°C at sites PS2863 and MSM5-712, respectively. However, a decrease of about 1.5-2°C in winter SSTs and an increase of 1-2 months/yr in sea-ice cover are recorded towards modern conditions. The estimated summer SSSs decrease by about 1 psu in core PS2863. A Jess pronounced decrease of SSSs is recorded in core MSM5-712.
1.6 Discussion
1.6 .1 The LGM paradox
In the literature about the LGM in Nordic Seas, major discrepancies characterize the SST reconstructions depending upon the proxies (cf. de Vernal et al., 2006). On one side, alkenones, dinocysts and coccoliths provide evidence for conditions as warm as or even warmer than at present in the surface waters with SSTs as high as 9-1SCC in summer (Rosell-Melé and Cornes, 1999; de Vernal et al., 2000, 2005). On the other side, planktic foraminifers led to suggest significantly colder than modem conditions, with SSTs not exceeding 4°C in summer (Sarnthein et al., 1995, 2003; Weinelt et al., 1996, 2003; N(jrgaard-Pedersen et al., 2003; Pflaumann et al., 2003).
Our results from sites PS2863 and MSM5-712 are in agreement with the previous study using dinocysts and suggest that the Nordic Seas and the eastern Fram Strait
experienced seasonally sea ice-free conditions during the LGM. This was previously inferred, not only from dinocysts (de Vernal et al., 2000, 2005) but also from coccoliths (Hebbeln and Wefer, 1997; de Vernal et al., 2000), alkenones (Rosell-Melé and Cornes, 1999) IP25 biomarkers Müller and Stein, 2014; Xiao et al., 2015) and planktic foraminifers (Hebbeln et al., 1994; Samthein et al., 1995, 2003; Weinelt et al., 1996, 2003; N~Z~rgaard-Pedersen et al., 2003; Pflaumann et al., 2003; Zamelczyk et al., 2014).
Seasonal ice-free conditions may even have prevailed along the northem continental slope of Svalbard where high fluxes of planktic and benthic foraminifers were recorded (Chauhan et al., 2014, 2016).
Open waters, at least seasonally, in the Nordic Seas were probably an essential mois ture source for the rapid growth of the Svalbard Barents Sea lee Sheet (SB SIS) (Hebbeln et al., 1994). The low sea-level and the SBSIS at the LGM certainly influenced ocean circulation as the Barents Sea pathway for A W advection was blocked, implying that ali the beat of A W was channelized along the western Barents Sea continental margin towards the Fram Strait. A sea-ice massif in the Arctic Ocean and a lower freshwater input from circum-Arctic rivers have been suggested to increase the influence of recirculating AW in the Fram Strait area in the LGM (N!Zirgaard-Pedersen et al., 2003). Mg/Ca data of Cronin et al. (2012) from Arctic Ocean ostracods also point to a strong inflow of A W, with a circulation pattern of this water mass similar to modem, at significantly greater depth, but even warrner than at present. Thus, there is ample evidence for a strong advection of A W to the Nordic Seas, the Fram Strait and northem Svalbard during the LGM, which is also in agreement with good calcium carbonate preservation (Zamelczyk et al., 2014) and regional8180 signais ofplanktic foraminifers (N!Zirgaard-Pedersen et al., 2003; Sarnthein et al., 2003). However, a flow of AW at the surface and the conditions that actually prevailed in the uppermost water layer are more equivocal. The biogenic remains leading to the reconstructions of seasonally ice-free conditions might reflect fluxes during episodic phases of open waters representing the breakout of continuo us sea-ice co ver rather than being the result of recurrent seasonally
ice-free conditions throughout the LGM as proposed by N(l)rgaard-Pedersen et al.
(2003) and Weinelt et al. (2003). Accordingly, the dinocyst assemblages would
represent episodes of open waters marked by relatively warm conditions and high productivity altemating with intervals characterized by permanent sea-ice cover and nil dinocyst fluxes as in the modem Arctic Ocean. The low dinocyst concentrations during the LGM could therefore be the result of very low fluxes except during
short-lived high productivity events. Such an assumption is compatible with the
paleoceanographical record ofMD95-2010 from the southem Norwegian Sea showing very large amplitude centennial variations of sea-surface conditions during the LGM with oscillations between 0 to 6 months/yr of sea-ice cover and evidence of episodic high SSTs (cf. Eynaud et al., 2004; de Vernal et al., 2006). The dinocyst fluxes recorded
since 18.5 ka in core PS2863 are mostly constant (~50 cysts/cm2/yr) which differ from
the very low fluxes of the LGM (~ 1 cyst/cm2/yr). Assuming uniform regional dinocyst fluxes during the summer season, we may calculate that sea ice-free conditions in northem Fram Strait occurred with an average frequency of one or two years per
century during the LGM. Higher temporal resolution of analyses would be needed at
our study sites for an unequivocal demonstration and to provide more information on
the frequency or the duration of the A W pulses at the surface in eastern Fram Strait. When providing quantitative estimates for LGM paleoenvironmental parameters in the
NE Fram Strait, one should consider the weak analogue situation for the LGM (cf. de
Vernal et al., 2005; de Vernal et al., 2006; Figs. 1.7, 1.9). During the LGM, the hydrographical conditions in the Nordic Seas were probably unique with no perfect
equivalent today. For instance, the selected modem analogues of the LGM were
obtained from the northeastem shore of the United Sates, the northem margin of Norway and the Gulf of St-Lawrence where high amplitude seasonal variations prevail today at the favor of estuarine type circulation. Such conditions do not exist in the open ocean settings such as Fram Strait. Hence, the quantitative reconstructions for the LGM must be interpreted with caution. In a context of low dinocyst concentrations, there is
also a risk of distortion of the signal due to distal input of reworked material from a
southem source. However, this is unlikely here considering the similarity of
assemblages at both sites MSM5-712 and PS2863 that are located 200 km apart from
each other. Moreover, SST reconstructions from alkenones by Rosell-Melé and Cornes
( 1999) show increasing sea-surface temperatures towards the northeast which would
be inconsistent with a warm source originating from the south as well. Furthermore,
even if sorne lateral transport of material occurred, warm sea-surface conditions must
have prevailed in the source area.
One consistent feature in most LGM records from the northem North Atlantic and the
Nordic Seas is the amplitude of variations that suggest unstable conditions in addition
to high seasonality (de Vernal et al., 2000, 2005; Samthein et al., 2003; Müller and
Stein, 2014). The reconstructions from dinocyst assemblages showing high SSTs, but
still freezing sea-surface conditions in winter also support large seasonal amplitude of
temperature (Figs. 1.7, 1.9). The inflows of A W in the context of a heavily glaciated
environment might have led to large amounts of freshwater input causing stratification
and low thermal inertia in the surface layers. The sea-surface warrning in summer was
probably amplified by intensive advection of A W, particularly since they were
confined to the Fram Strait during the LGM. At that time, sea-surface conditions in the
Nordic Seas including the Fram Strait were probably unstable, with an altemation of
surface warming with strong north ward A W fluxes and cold meltwater discharge
events, as proposed by de V emal et al. (2006).
1.6.2 Transition from the LGM to the postglacial
The occurrence of the heterotrophic taxa Brigantedinium spp. and/. minutum increased
at 20 ka (Figs. 1.4, 1.5) and reached a maximum in Zone Il, which corresponds to the
establishment of pervasive cold conditions from 19 to 14.7 ka (Figs. 1.7, 1.9).
In the dinocyst records of both sides, a transition between 20 and 18.5 ka was
glacial erosion, which is consistent with an IRD signal recorded at 20.5 ± 0.5 ka on the
western Svalbard slope (Jessen et al., 2010). Other studies reconstructed cooling at
about 19 ka. This was inferred from a decrease in the percentages of subpolar taxa in
planktic foraminifer assemblages in eastern Fram Strait (Zamelczyk et al., 2014) and
from biomarker data (Müller and Stein, 2014). The summer SST decrease and
enhanced sea-ice cover extent were suggested to result from reduced A W inflows
towards the end of the LGM (Rasmussen et al., 2007), which could be associated with
a near shut down ofthe AMOC at 18-17.5 ka (McManus et al., 2004; Hall et al., 2006;
Stanford et al., 2011). Actually, the cooling recorded after ,...,19 ka may have occurred in an early phase of the deglaciation, as recorded at about 19.2 ka on the southern
Yermak Plateau from low 8180 in planktic foraminifers (Chauhan et al., 2014) or at
about 18.5-17 ka in the Fr am Strait based on various evidences (Hebbeln et al., 1994;
Andersen et al., 1996; NS?Srgaard-Pedersen et al., 2003; Rasmussen et al., 2007). A
weakening of the AMOC may well have been linked to large freshwater and iceberg
discharges from the SB SIS, leading to cold and buoyant waters at the sea-surface.
Major inputs of meltwaters near the onset of the deglaciation are coherent with the low
8180 of planktic foraminifers from 18.5 to 17.5 ka from the Nordic Seas (Jones and
Keigwin, 1988; Lehman et al., 1991; Hebbeln et al., 1994; Bauch et al., 2001; NS?Srgaard-Pedersen et al., 2003; Rasmussen et al., 2007). They are also consistent with
the sustained low SSSs in our two core records ( < 32 psu; Figs. 1.7, 1.9) and roughly
corresponds to the onset of Heinrich event I (Hl; Heinrich, 1988; Bond et al., 1993),
spanning from 17.9 to 15.7 ka as defined in Gibb et al. (2014). The high dinocyst flux
recorded after 17 ka (Fig. 1.3) is synchronous with increased primary productivity as
deduced from biomarkers in core MSM5-712 (Müller and Stein, 2014) and planktic foraminifers in the Yermak Plateau (Chauhan et al., 2014), which suggest a transition from harsh and unstable conditions of the earliest phase of the deglaciation to more favorable pelagie conditions.
At the beginning of Zone III, there was a short pulse of high SSTs accompanied by reduced sea-ice cover lasting about 200 years (Figs. 1.8, 1.9). This short interval probably resulted from enhanced A W contribution, which led to warming and strong meltwater inputs during a short-lived interval of about 100 years. Afterwards, the SSSs increased, but remained relative] y low ( < 32 psu). This warm event is only observed in core MSM5-712, probably due to the very high temporal resolution of the core that permits to identify short-lived events. It occurred shortly after the resumption of the AMOC at about 14.6 ka, coïncident with the B~lling warrning (McManus et al., 2004; Stanford et al., 2011). lt also corresponds to a change in the benthic forarninifer assemblages indicating a shift from polar to subarctic conditions along the western Svalbard mar gin (Slubowska-Woldengen et al., 2007, 2008).
After the warm pulse, from 14.5 to 14.1 ka, the sea-surface reconstructions indicate completely opposite trends, with the setting of extremely cold conditions and extended sea-ice co ver (Figs. 1.8, 1.9). This cold event co vers the larger part of the rapidly deposited layer, which has an age of 14,660 to 13,930 cal. years BP in core MSM5-712.
The sediment of this layer would originate from the scouring of the northwestern Barents Sea continental shelf in relation with Meltwater Pulse la (Lucchi et al., 2015). In the upper continental slope of the Storfjorden, Lu cc hi et al. (20 15) identified a thick rapidly deposited sediment layer, which presented sedimentological features similar to the deposit described by Jessen et al. (2010) from the western Svalbard and the Yermak Plateau continental slopes. The stratification of surface waters would have led to enhanced sediment dispersal at regional scale of a meltwater plume resulting from major ice sheet collapse (Lucchi et al., 2015). Such a collapse might well be have been triggered by the A W influence and short warming as documented above, together with eustatic sea level rise. The palynological content of the rapidly deposited layer of both sites is characterized by a maximum peak in reworked palynomorphs, implying
erosional processes on the shelves and subsequent outwash deposition. The dinocyst
assemblages are dominated by Brigantedinium spp. which is today highly abundant in
sites affected by glacier meltwater discharge from Novaya Zemlya (Voronina et al.,
2001) in the eastern Barents Sea. Our data th us support the interpretation that this layer
was formed from the erosion and subsequent deposition of sediments originating from
the northwestem Barents Sea continental shelf.
The low dinocyst concentrations (mean of 390 cysts/g) in sediments accumulated from
14.6 to 14.3 ka (Fig. 1.3) likely result from dilution with deposits from the
sediment-laden meltwater plume. Nevertheless, the calculated fluxes are about 140 cysts/cm2/yr during this interval, which corresponds to relatively high fluxes and productivity. From 14.1 ka until the top of Zone III, recurring high SSTs possibly relate to enhanced A W heat advection. However, while subpolar conditions are recorded in bottom waters
around Svalbard (Bartels et al., 2017), particularly between 14.5-13.5 ka
(Slubowska-Woldengen et al., 2007), the planktic foraminifer assemblages rather indicate polar
conditions during the B!l)lling-Aller!l)d interstadial (Rasmussen et al., 2007;
Aagaard-S!I)rensen et al., 2014b; Chauhan et al., 2014), probably linked to heat loss to the
atmosphere and/or outpouring of cold waters as suggested by Rasmussen et al. (2007).
At the study sites, the SSTs are also marked by high seasonal amplitude from winter to
summer (Figs. 1.7, 1.9). Strong inflow of A W during the de glaciation probably initiated
atmospheric warming at the margin of the SBSIS and enhanced meltwater discharge,
leading to low salinities and a strong stratification of surface water. Enhanced ice
calving and meltwater inflows during the Aller!l)d are indicated by coarse sediment and
low
o
180 from foraminifer shells (Andersen et al., 1996; Hald et al., 2001; Jessen et al.,2010; Zamelczyk et al., 2012; Aagaard-S!I)rensen et al., 2014b, Bartels et al., 2017).
Moreover, low
o
13C of N. Pachyderma in core MSMS-712 throughout theB!l)lling-Aller!l)d suggests stratification in the water column (Aagaard-S!I)rensen et al., 2014b).