Geneviève Morneau-Vaillancourt1, Ginette Dionne1, Mara Brendgen2, 3, Frank Vitaro2,4,Bei Feng1,Jeffrey Henry1,Nadine Forget-Dubois1,Richard Tremblay5, Michel Boivin1
1Research Unit on Children's Psychosocial Maladjustment, École de Psychologie, Université Laval, Quebec, Canada
2Research Unit on Children's Psychosocial Maladjustment, Montreal, Quebec, Canada 3Department of Psychology, University of Quebec in Montreal, Montreal, Quebec, Canada 4Department of Psycho-Education, University of Montreal, Montreal, Quebec, Canada 5Department of Psychology, University of Montreal, Montreal, Quebec, Canada
Corresponding author: Michel Boivin
École de psychologie
Université Laval, Québec, Qc, Canada G1V 0A6
Complete address of author designated to review proof: Genevieve Morneau-Vaillancourt
Université Laval Québec, Canada G1V 0A6 1 418 563 2895
Abstract
The objective of this study was to examine the genetic and environmental contributions to shyness throughout the school-age period. Participants were 553 twin pairs from the
ongoing prospective longitudinal Quebec Newborn Twin Study. Teacher-rated measures of shyness were collected at five time-points from age 6 to 12 years. On average, shyness was moderately stable over time (r = .23 - .33) and this stability was almost entirely accounted for by genetic factors. Genetic factors at age 6 accounted for 44% of individual differences and these early genetic factors also explained individual differences at all subsequent ages (6% to 22%). Non-shared environmental factors explained most of individual differences at single time-points (51% to 63%), and did not account for stability in shyness. Contributions of shared environment were not significant. Our results suggest that the stability in shyness is mostly accounted for by early and persistent genetic contributions. Keywords. Shyness,
Shyness is the expression of behavioral and emotional ambivalence in contexts of social novelty, presumably reflecting an approach-avoidance motivational conflict
(Asendorpf 1990). Emerging in early childhood, shyness is a temperamental trait and is not typically identified as a disorder (Turner et al. 1990). Over time, shy toddlers often become more comfortable in contexts of social novelty and signs of shyness in infancy do not predict subsequent difficulties (Degnan and Fox 2007). However, as the child enters school, high and stable shyness then becomes associated to internalizing problems (Karevold et al. 2012). Frequent displays of shyness after school entry are associated with mental health problems (e.g., generalized anxiety disorder, separation anxiety disorder, social phobia, and symptoms of depression; Fordham & Stevenson-Hinde, 1999; Karevold et al., 2012). Therefore, early manifestations of shyness are typical, but chronic shyness past school entry may put the child at risk for internalizing problems. To understand what underlies chronic shyness, it is essential to document the etiological factors contributing to its stability.
Longitudinal studies have identified environmental and child-specific correlates, such as family factors, emotionality, or attention bias to threat, of chronic shyness throughout childhood (e.g., Eisenberg, Shepard, Fabes, Murphy, & Guthrie, 1998; Pérez-Edgar et al., 2010; Volbrecht & Goldsmith, 2010). However, most risk factors of chronic shyness have been examined separately and the relative contributions of environmental versus child-specific factors were not documented and compared. Genetically informative designs (e.g., twin studies), allow disentangling environmental sources of variance from genetic sources. Therefore, longitudinal twin studies are well-suited to examine the roles of both genetic and environmental factors in the development of a trait over time (Neale and Cardon 1992).
One twin study conducted on early shyness between 14 and 20 months showed that stability in toddlerhood was mostly accounted for by genetic factors (Cherny et al. 1994). However, this study did not include subsequent assessments of shyness in later childhood. Two longitudinal twin studies have examined social withdrawal after school entry (Van der Valk et al. 2003; Hoekstra et al. 2008). In these studies, social withdrawal was loosely evaluated using the withdrawn/depressed and anxious subscales of the Child Behavior Checklist (Achenbach, 1991, 1992; Verhulst, Ende, Ferdinand, & Kasius, 1997). Again, genetic factors mostly accounted for the stability in social withdrawal from early to middle childhood. However, these studies did not measure shyness per se. Shyness can be defined as the expression of an approach-avoidance conflict in unfamiliar social situations, whereas social withdrawal is an umbrella term for behaviors leading to self-isolation in both familiar and unfamiliar social situations (Rubin et al. 2009). Thus, shyness is a unique subtype of social withdrawal, and should be specifically documented. To overcome this limit, the present study examined the etiology of shyness from school entry (6 years) to the end of elementary school (12 years).
Two developmental mechanisms can be revealed when examining the etiology across time. According to a set-point hypothesis, factors already present at the beginning of a developmental period may persist and consistently account for sources of variance across time, supporting etiological continuity (Lacourse et al. 2014). The maturation hypothesis posits that distinct genetic or environmental influences may emerge at different periods. These influences may be observed at a later time-point. The set-point and maturation models can either act independently or concurrently to explain developmental trends.
Based on these models, the present study aimed to document the etiology of shyness by answering the following questions. First, what are the genetic and environmental
contributions to stability and change in shyness from age 6 to 12? Secondly, how are these contributions unfolding at specific ages during the same period? Two complementary genetic approaches were used to answer these questions. First, a latent growth curve model was used to examine the etiology of stability and change in shyness (McArdle &
Hamagami, 2003). It allowed verifying whether the set-point model was supported through continuous genetic and environmental contributions. This general approach to analyzing stability and change was followed by a Cholesky decomposition model. This model allowed testing the maturation hypothesis by estimating time-specific contributions and uncovering new contributions emerging at later periods, if any (Loehlin 1996). It may also support the set-point hypothesis by verifying if genetic and environmental contributions at onset endure through time.
We hypothesized that shyness would be moderately stable from ages 6 to 12, as shown in previous studies (Karevold et al. 2012). This stability would most likely be
explained by common genetic factors, supporting a genetic set-point model. The etiology of shyness being further examined in a time-specific approach, we hypothesized that
additional genetic factors would emerge at later time-points, yet would have a smaller contribution to shyness. As for environmental factors, they would also support the maturation model, and account for individual differences in shyness but only at specific time-points.
Methods Participants
Participants of the Quebec Newborn Twin Study were initially recruited at birth in the greater Montreal area, Canada (QNTS; Boivin et al., 2013a). At the first assessment, a total of 662 families were involved when twins were five months old. The present study
was based on elementary school assessments, collected prospectively with measures of shyness taken at 6 years (mean age [M] = 6.04 years, standard deviation [SD] = .28), 7 years (M = 7.08, SD = .27), 9 years (M = 9.10, SD = .29), 10 years (M = 10.00, SD = .28), and 12 years (M = 12.09, SD = .28). Teachers completed the questionnaires for 553 twin pairs (50.4% boys) at least once over the targeted period (221 monozygotic twins [MZ], 167 same-sex dizygotic twins [DZ], 158 opposite-sex DZ pairs, and 7 incomplete pairs). Additional information on the sample can be found in the Supplementary Materials. Procedure and Attrition
Teacher ratings were collected during the spring of each school year so that they were familiarized with the children. Each year, between 60.6 and 76.4% of twin siblings were in separate classrooms, allowing the majority of them to be assessed by different teachers. Therefore, independent evaluations were collected from different teachers at each wave. Data were obtained for 386 complete twin pairs at age 6, 408 at 7, 361 at 9, 370 at 10, and 282 at 12 years. When children were in kindergarten, some teachers were on a strike and could not complete the questionnaire. Once the strike ended the following year, more participants were included in the study. This explains why the sample size increased from age 6 to 7.
Data were available for 14 incomplete pairs at age 6 years, 20 at age 7 years, 32 at age 9 years, 31 at age 10 years, and 57 at age 12 years. These incomplete pairs were instances where twins were in different classrooms with one teacher completing the evaluation, whereas the other did not. Many of these cases were incomplete only at one time-point, so that the model could still use the information from the co-twin at other assessment times. Therefore, we decided to include these incomplete pairs to maximize sample size and power.
Attrition rate, based on the sample of 662 twin pairs who were initially recruited in infancy, was 41% at age 6; 37% at 7; 43% at 9; 42% at 10; 53% at 12 (see Boivin et al., 2013a for more details on the sample attrition in the QNTS at each wave). These
percentages are in comparison to the initial sample at the first assessment at five months. Independent samples t tests showed that children who had missing data at 12 years had higher shyness scores at 10 years (t = -2.19, df = 200, p < .05). Children who had missing data had lower income at 6 years (t = 2.20, df = 442, p < .05), 7 years (t = 2.08, df = 362, p < .05), and 9 years (t = 1.99, df = 830, p < .05). Twins for whom data were unavailable did not differ from participating twins in terms of parental educational level, first language spoken at home, and parental ethnicity.
Most twins were in different classrooms at each time-point. At age 6, 68% were in different classrooms; and then 76% at age 7 and age 9, 70% at age 10, and 60% at age 12. At all time-points, the percentages of MZ and DZ pairs that were in the same class were similar: the numbers were 30% of MZ and 32% of DZ at age 6, 27% and 22% at age 7, 23% and 24% at age 9, it was, 33% and 27% at age 10, and finally 42% and 38% at age 12. At age 6 and 7, twins sharing the same classroom were significantly less shy on average than twins who were in separate classroom. However, this difference was not found at 9, 10 and 12 years. As children may initially be unfamiliar with most of their peers, twins sharing the same class may have found it easier to socialize with unfamiliar peer. Over time, as they become familiar with other kids, this advantage fades away (i.e. at ages 9, 10, and 12). We also tested whether the shyest twins (top quartile versus the others) were more likely to be kept together at the following year. This was never the case. Given this fading and
inconsequential trend in shyness, and the fact that most twins were in different classrooms, we did not consider this in the following analyses.
Measurement of Shyness
Shyness was evaluated based on an adaptation of Asendorpf’s dispositional shyness scale (1987). This original scale was validated with measures of situational shyness, and showed satisfactory internal consistency (Asendorpf 1987). Our adapted measure consisted of three items: Over the past six months, how many times did the child… easily approached
unfamiliar children; … was shy among unfamiliar children; … took a lot of time to get used to unfamiliar children. Each item was answered using a three-point scale (0 = never, 1
= sometimes, 2 = often). The score for the first item was reversed. Shyness scores were averaged over the three items. Ordinal alpha coefficients for ordinal subscales (Zumbo et al. 2007) were satisfactory: .78 at 6 years, .73 at 7 years, .65 at 9 years, .71 at 10 years, and .68 at 12 years. Additional analyses were conducted to confirm the measurement invariance of the scale across ages (see Supplementary Materials, Table S4). We examined whether items loaded on a single shyness construct, and whether the measurement and structural equivalence held across time. A one-factor structure was confirmed. The scale met measurement and structural invariance criteria, suggesting that the scale of shyness was equivalent at all ages. The scale also showed the expected associations with other relevant phenotypes (anxiety symptoms, depressive symptoms and school performance) at all time-points.
Statistical Analyses
We conducted descriptive and exploratory analysis with IBM Statistical Package for the Social Sciences software, version 22.0 (IBM Corporation 2013). All score distributions for shyness were normal. We tested genetic models in Mplus, version 7.31 (Muthen & Muthen, 2017). All available data were included in the models through maximum likelihood estimation of parameters (Schlomer et al. 2010).
Data were first checked for a possible confounding effect of sex. We examined sex differences by comparing shyness scores between boys and girls using independent samples
t tests and by comparing intra-pair correlations for girls, boys and opposite-sex twin pairs
with Fisher's r-to-z transformation (Steiger 1980). No sex difference was found at any time-point on means and same-sex intra-pair correlations. Correlations between same-sex DZ pairs and opposite-sex DZ pairs did however differ but followed an inconsistent pattern. At ages 6 and 7, opposite-sex DZ pairs were rated to be more similar than same-sex twins. At age 9, 10 and 12, opposite-sex DZ pairs were rated to be more different than same-sex twins. Therefore, all twins were included in the models.
Phenotypic description of shyness. We conducted descriptive statistics, including means, standard deviations, and intra-pair correlations for shyness scores. Phenotypic stability was assessed through Pearson correlations across measures. Cross-twin cross-trait correlations were conducted to examine whether there was a genetic component to the stability in shyness.
Genetic description of shyness. Genetic analyses were conducted under the
assumptions of twin designs. These assumptions are that MZ twins are genetically identical and that DZ twins share, on average, half of their genes. Environmental influences
contributing to intra-pair similarity above genetic similarities are shared environmental factors (C), while environmental influences contributing to intra-pair differences are unique environmental factors (E). Environments are not more similar for MZ than for DZ twins (equal environment assumption). Moreover, estimations of genetic contributions are all strictly additive (A; e.g., no dominant or recessive genetic effects are estimated; Neale & Cardon, 1992).
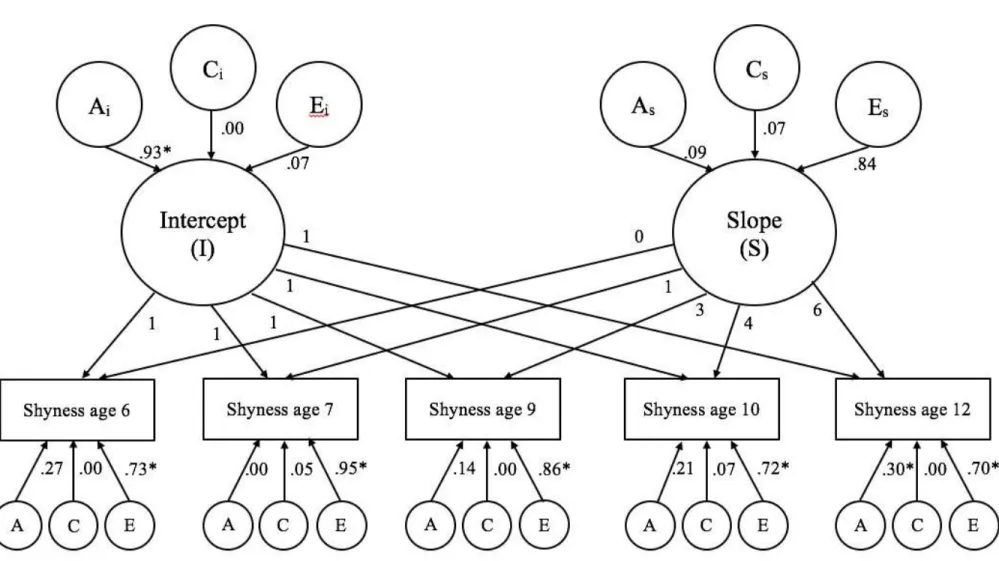
To first investigate the set-point hypothesis, a genetically informative growth curve model was tested to examine possible early and persisting contributions to stability in shyness. Growth curve models allow estimating stability and change by taking into account the patterns of means over time (Duncan et al. 2006). The intercept (i.e., initial levels in shyness, or systematic stability) and the slope (i.e., rate of change in shyness as a function of age) are latent factors estimated with means and variations around these means. Here, intercept paths were all fixed to 1. This constraint allowed retaining common variance in initial levels between all assessments. Slope loadings were fixed in agreement with the sequence of assessments across time: 0 for 6 years old, 1 for 7 years old, 3 for 9 years old, 4 for 10 years old, and 6 for 12 years old. Finally, time-specific residuals were estimated at each time-point. The genetically informative growth curve model further decomposes the latent intercept and slope, and age-specific residuals into their ACE factors (McArdle and Hamagami 2003).
Then, we tested a Cholesky model to examine time-specific etiology. This model examines both the maturation and set-point hypotheses by indicating if new sources of variance emerge over time, while allowing the possibility that initial sources of variance endure over time. The Cholesky decomposes the phenotypic variance into ACE factors (Loehlin 1996). These initial ACE factors are left free to contribute to subsequent
phenotypes. At each time-point, new ACE factors account for residual variance, adding to contributions of the previous ACE factors. Therefore, each shyness phenotype is
represented by a series of ACE previous and new contributions. Results
The total number of twin pairs, means, standard deviations, and intra-pair correlations at each wave are presented in Table 1.
(Insert Table 1 here)
The pattern of means over time indicates a slight decrease of average shyness scores. Intra-pair correlations were moderate and typically higher for MZ than for DZ Intra-pairs, suggesting A and E, and perhaps C contributions to shyness. Table 2 shows that phenotypic
correlations were moderately stable from 6 to 12 years. Table 3 indicates that cross-twin cross-trait correlations were stronger for MZ twins, suggesting a potential genetic contribution to the stability in shyness.
(Insert Table 2 here) (Insert Table 3 here) Genetic Description
The genetically informative growth curve and Cholesky models were tested (univariate models are reported in Table S1 of Supplementary Materials). To evaluate model adjustment, we compared both multivariate models to a saturated model using the χ² difference test, and also the Root Mean Square Error of Approximation (RMSEA), a commonly used absolute fit index, and the Akaike Information Criteria (AIC), a reliable parsimony fit index (Hooper et al. 2008). Both initial latent growth curve and Cholesky model did not fit significantly worse than the saturated model, and had good fit: χ² (36, N = 553) = 38.73, p > .05; RMSEA = .02; AIC = 4406.41 for the latent growth curve model; and χ² (19, N = 553) = 24.292, p > .05, RMSEA = .03 and AIC = 4426.06 for the Cholesky model.
What are the genetic and environmental contributions to stability and change in shyness? To answer our first question, we conducted a genetically informative growth
curve model (see Figure 1). This model decomposes the intercept, slope, and residual time-specific variances into ACE components. Unstandardized estimates and confidence
intervals are presented in Table S2 of Supplementary Materials. (Insert Figure 1 here)
Since no significant C contributions appeared for the slope and the intercept, we constrained these C contributions to 0. The C parameters for the residuals were freely estimated, except for the age 6 years for which C was constrained to 0. We finally
constrained A factors to the slope to 0, since this parameter did not significantly contribute to the model. These constraints did not deteriorate the fit of this nested model.
The percentage of variance accounted for by the intercept and slope on each wave was 27% at 6 years, 34% at 7 years, 37% at 9 years, 38% at 10 years, and 41% at 12 years. At each assessment, the remaining percentage of variance was time-specific. Almost all of the variance in the intercept was explained by genetic factors: 93% of this variance was attributable to the same set of genes. E contributions to the intercept and slope were non-significant. Interestingly, 20% of the residual variance at 6 years, and 18% of the variance at 12 years was accounted for by additional and specific genetic factors. Therefore, 20% and 18% of individual differences specific to the first and last time-point, respectively, were attributable to new genetic factors. Overall, age-specific residuals were explained by non-shared environmental factors at all assessments.
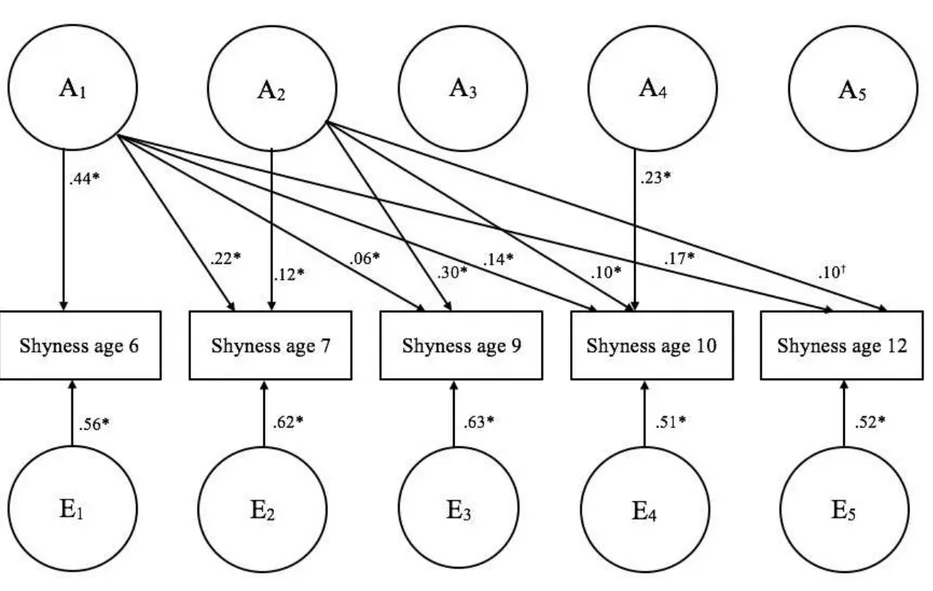
How are genetic and environmental contributions unfolding at specific periods throughout childhood? We conducted a Cholesky decomposition to examine etiological mechanisms in a time-specific approach. Figure 2 presents the longitudinal two-factor Cholesky model with standardized path estimates. Only significant paths are shown in the figure to alleviate the presentation. All unstandardized and standardized estimates, along
with confidence intervals are in Table S3 of Supplementary Materials. Consistent with the growth curve model, C factors were not significant and were all constrained to 0. The fit of this nested model was not significantly worse than the full Cholesky model.
(Insert Figure 2 here)
Genetic contributions accounted for substantial percentages of the variance at all time-points: 44% at 6 years; 36% at 7 years; 36% at 9 years; 48% at 10 years; and 46% at 12 years. Most notably, early genetic factors at 6 and 7 years accounted for shyness at all subsequent time-points; genetic factors at age 6 accounted for individual differences in shyness at all subsequent ages, and additional genetic factors at 7 years contributed to shyness at 9, 10, and marginally at 12 years (p = .06). New genetic factors emerged at 10 years, but did not contribute to shyness at 12 years. There were no new contributions of genetic factors at 9 and 12 years. Genetic contributions to these later phenotypes were entirely accounted for by earlier genetic contributions observed at 6 and 7 years. Moreover, non-shared environmental factors were limited to age-specific shyness. Overall, non-shared environmental factors explained slightly more than half of age-specific variance, and these contributions were not correlated across time-points.
Discussion
The first school years represent a stressful period for shy children since they repeatedly face new social interactions each year (Coplan et al. 2008). To understand the basis of chronic shyness throughout childhood, it is necessary to identify the longitudinal patterns of genetic and environmental contributions to its development. The goal of the present study was to examine the genetic and environmental etiology of shyness from 6 to 12 years, and describe this etiological pattern according to complementary set-point and maturational genetic models.
Our study provided an extensive longitudinal evaluation of children's shyness throughout the school-age period, something that has never been conducted before. Indeed, the specific focus on the longitudinal gene-environment etiology of shyness is a unique feature of the present study. Moreover, the use of independent ratings across time-points also likely diminished biases leading to inflated stability estimates (Little 2013). Finally, most twins (~70%) were in separate classrooms each year, allowing independent teachers to evaluate them.
The phenotypic description of shyness revealed that it was moderately stable throughout childhood. Results from both genetic models supported a genetic set-point hypothesis, with early and persistent genetic contributions to shyness throughout childhood. However, results from the Cholesky model also supported a genetic maturation model. This model showed that new genetic contributions emerged at different time-points.
Phenotypic Stability of Shyness
The moderate stability of shyness over time (r = ~ .20 - .30) was weaker than those found in another longitudinal study on shyness (Karevold et al., 2012; ~ r = .50). This divergence may be explained by differences in measurement methods. Karevold et al. (2012) used repeated parental evaluations which may inflate correlations through time. In our study, repeated measures were collected through independent evaluations from different teachers each year. This may explain why stability estimates were higher in Karevold et al. (2012). Despite being collected by independent raters, we found moderate associations between shyness scores across time-points. This further supports that shyness is partly founded in a stable temperamental trait throughout childhood. Furthermore, teachers may be better than parents at evaluating children’s social behavior among peers
(Verhulst et al. 1994). They usually spend more time in the presence of children. Therefore, they may have a more objective perspective on children’s behavior due to their experience. Genetic Etiology of Shyness
Both analytic approaches supported the genetic set-point hypothesis. Stable genetic influences contributed to individual differences in shyness throughout childhood. In the growth curve analysis, 93% of the variance in the intercept was attributed to genetic factors. This estimate may seem high, but it should be pointed that it reflects common variance at all time levels. In other words, the systematic stability of shyness from age 6 to 12 is almost entirely attributed to the same persistent genetic factors. This result is consistent with the Cholesky decomposition according to which a single set of genes at age 6 accounts for individual differences in shyness across all subsequent waves. This persisting genetic contribution over time is consistent to that found in a previous study of shyness in
toddlerhood, in which genetic factors contributed to the stability of shyness from 14 to 20 months (Cherny et al. 1994). Building on findings from Cherny et al. (1994), our results may point to a continuous contribution of the same genes emerging much before school entry.
The Cholesky model also supported the genetic maturation model as new genetic contributions at ages 7 and 10 years were observed. These new contributions explained 12% and 23% of the total variance at 7 and 10 years, respectively. It is possible that new genetic influences reflect environmental changes through gene-environment interactions (see Boivin et al., 2013b). Genetic influences may interact with environmental factors specific to these developmental period. For instance, at age 7, children transition from kindergarten to first grade. Environmental settings can change considerably over this period. When children enter first grade, they are introduced to a formal and structured
learning environment in which they are evaluated (Entwisle and Alexander 1998).
Moreover, in first grade, children face several novel social imperatives (e.g., making new friends, acquiring and maintaining peer status). As for the emergence of new genetic contributions at age 10, it is possible that they reflect gene-environment interactions linked to changes in social perceptions. With the onset of puberty, children’s social values may start to shift (Gifford-Smith and Brownell 2003). For instance, they may seek popularity and acceptance among the peer group (Parker and Asher 1993). Therefore,
gene-environment interactions may be due to changes happening at school, and these new challenges and contexts may trigger the activation of genes implied in socialization processes.
Environmental Etiology of Shyness
Despite substantial persistent and emerging genetic contributions to shyness, the Cholesky decomposition also indicated that a substantial part of individual differences at each time-point was due to non-shared environmental factors. In previous longitudinal studies conducted on withdrawn behavior, a correlate of shyness, non-shared environmental factors also accounted for time-specific sources of variance, over and above genetic factors (Hoekstra et al., 2008; van der Valk et al., 2003). Despite the difference in construct (shyness versus withdrawal), we also found substantial contributions of non-shared environment in the growth curve model. However, these sources of contributions were observed for residual variances, which suggests that time-specific non-shared
environmental factors contribute to shyness. Experiences unique to each child, such as the effect of the people they meet at the beginning of the school year, would be reflected as non-shared environment. These non-shared environmental contributions could also reflect latent variable measurement error.
Limitations
Our study bears limitations. First, the sensitivity of the measurement scale may have been affected by the small number of items, and by the narrow distribution. The short evaluation scale (0 = never, 1 = sometimes, 2 = often) may have limited the accuracy of the measures. Because it is based on three items, the scale may have been less sensitive to measuring aspects of shyness. For instance, shyness is often observed in social novelty contexts, but it can sometimes be expressed in situations of perceived social evaluation (Rubin et al. 2009). Our measure aimed at evaluating children’s social response with unfamiliar peers and did not include contexts of perceived social evaluation. However, the unidimensional factorial model validating our construct (see Table S5 in the Supplementary Materials) was estimated with WLSMV, a robust estimator for non-normal ordinal data. Indicators for the constructs in this factorial model were accurately estimated. Internal consistency estimates at each time-point were satisfactory, and measurement error was limited. Validity and invariance analyses also confirmed that our construct was associated with relevant reference behaviors and accurately measured across development (see Supplementary Materials).
A second limit concerns the pattern of attrition from age 10 to age 12; children with a higher shyness score at age 10 were more likely to be missing at the age 12 assessment time. This may have biased the distribution, with more children at the higher-end missing, and therefore restricted variability in shyness at that time. However, the distribution of shyness at age 12 years was about normal (skewness: .75; kurtosis: .60), and the variance at the two time points was about the same (.19 at age 10 and .20 at age 12). On the other hand, this attrition pattern may have limited the generalization of the results to the population, but only at age 12.
Finally, we were not able to decompose the rate of change in shyness because no significant variation around the slope was found in the growth curve model. The slope estimate was almost null, and we would expect to see some variation in the rate of change over time. For instance, while some shy children show resilience and overcome their shyness over time (Degnan and Fox 2007), others are consistently shy (Dennissen et al. 2008). However, children who overcame shyness may not have been in numbers high enough to affect the variance around the slope.
Conclusion
In conclusion, our study showed that both genetic and environmental factors underpin the development in shyness over the school-age period. Most notably, genetic factors accounted for most of systematic stability from 6 to 12 years. Environmental
contributions were mostly observed for age-specific individual differences. Therefore, early genetic factors seem to have substantial influence in shaping the development of shyness. Our findings clearly indicate that, over the first two school years, genetic mechanisms contributing to chronic shyness are well established. It is possible that these mechanisms take place earlier during the preschool period. Future studies should aim at documenting preschool risk factors for shyness and at investigating the genetic markers associated with high levels of shyness.
Acknowledgements
We gratefully acknowledge the on-going contribution of families, children and teachers in the Quebec Newborn Twin Study (QNTS). We also thank Hélène Paradis for data preparation and Marie-Élyse Bertrand for project coordination.
Michel Boivin, Canada Research Chair in Child Development, School of
Psychology, Laval University, 2325, Allée des Bibliothèques, Local 1224, Québec, G1V 0A6, Canada. E-mail: [email protected]
Funding
The present study was supported by the Social Sciences and Humanities Research Council of Canada [309262] studentship to Geneviève Morneau-Vaillancourt. The Quebec Newborn Twin Study (QNTS) is supported by the Social Sciences and Humanities
Research Council of Canada, the Canadian Institutes of Health Research, the Fonds Québécois de la Recherche sur la Société et la Culture (multiple grants).
Conflict of Interest All authors declare no conflict of interest.
Ethical Approval
All procedures performed in this study were in accordance with the ethical standards of Université Laval and Sainte-Justine Hospital and with the 1964 Helsinki declaration and its later amendments or comparable ethical standards.
Informed Consent
Informed consent was obtained from all individual participants or their parents in the study.
References
Achenbach TM (1991) Manual for the child behavior checklist/4-18 and 1991 profile. University of Vermont, Department of Psychiatry, Burlington
Achenbach TM (1992) Manual for the child behavior checklist/2-3 and 1992 profile. University of Vermont, Department of Psychiatry, Burlington
Asendorpf JB (1990) Beyond social withdrawal: Shyness, unsociability, and peer avoidance. Hum Dev 33:250–259. doi: 10.1159/000276522
Asendorpf JB (1987) Videotape reconstruction of emotions and cognitions related to shyness. J Pers Soc Psychol 53:542–549. doi: 10.1037/0022-3514.53.3.542
Boivin M, Brendgen M, Dionne G, et al (2013a) The Quebec Newborn Twin Study into adolescence: 15 years later. Twin Res Hum Genet 16:64–69. doi:
10.1017/thg.2012.129
Boivin M, Brendgen M, Vitaro F, et al (2013b) Evidence of gene-environment correlation for peer difficulties: Disruptive behaviors predict early peer relation difficulties in school through genetic effects. Dev Psychopathol 25:79–92. doi:
10.1017/S0954579412000910
Cherny SS, Fulker DW, Corley RP, et al (1994) Continuity and change in infant shyness from 14 to 20 months. Behav Genet 24:365–379. doi: 10.1007/BF01067538
Coplan RJ, Arbeau KA, Armer M (2008) Don’t fret, be supportive! Maternal characteristics linking child shyness to psychosocial and school adjustment in kindergarten. J
Abnorm Child Psychol 36:359–371. doi: 10.1007/s10802-007-9183-7
Degnan KA, Fox NA (2007) Behavioral inhibition and anxiety disorders: Multiple levels of a resilience process. Dev Psychopathol 19:729–46. doi: 10.1017/S0954579407000363 Dennissen JJA, Asendorpf JB, Van Aken MAG (2008) Childhood personality predicts
long-term trajectories of shyness and aggressiveness in the context of demographic transitions in emerging adulthood. J Pers 76:67–99. doi:
10.1111/j.1467-6494.2007.00480.x
Duncan TE, Duncan SC, Strycker LA (2006) Introduction to Latent Variable Growth Curve Modeling: Concepts, Issues, and Applications, Second Edi. Lawrence Erlbaum
Associates, Mahwah, New Jersey
Eisenberg N, Shepard SA, Fabes RA, et al (1998) Shyness and children’s emotionality, regulation, and coping: Contemporaneous, longitudinal, and across-context relations. Child Dev 69:767–90
Entwisle DR, Alexander KL (1998) Facilitating the transition to first grade: The nature of transition and research on factors affecting it. Elem Sch J 98:351–364
Fordham K, Stevenson-Hinde J (1999) Shyness, friendship quality, and adjustment during middle childhood. J Child Psychol Psychiatry Allied Discip 40:757–768. doi: DOI: undefined
Gifford-Smith ME, Brownell CA (2003) Childhood peer relationships: Social acceptance, friendships, and peer networks. J Sch Psychol 41:235–284. doi: 10.1016/S0022-4405(03)00048-7
Hoekstra R V., Bartels M, Hudziak JJ, et al (2008) Genetic and environmental influences on the stability of withdrawn behavior in children: A longitudinal, multi-informant twin study. Behav Genet 38:447–461. doi: 10.1007/s10519-008-9213-4
Hooper D, Coughlan J, Mullen M (2008) Structural equation modelling: Guidelines for determining model fit. Electron J Bus Res Methods 6:53–60. doi: 10.1037/1082-989X.12.1.58
Karevold E, Ystrom E, Coplan RJ, et al (2012) A prospective longitudinal study of shyness from infancy to adolescence: Stability, age-related changes, and prediction of socio-emotional functioning. J Abnorm Child Psychol 40:1167–1177. doi: 10.1007/s10802-012-9635-6
Lacourse E, Boivin M, Brendgen M, et al (2014) A longitudinal twin study of physical aggression during early childhood: Evidence for a developmentally dynamic genome. Psychol Med 44:2617–2627. doi: 10.1017/S0033291713003218
Little TD (2013) Overview and Foundations of Structural Equation Modeling. In:
Longitudinal Structural Equation Modeling. The Guilford Press, New York, NY, pp 8–9
Loehlin JC (1996) The Cholesky approach: A cautionary note. Behav Genet 26:65–69. doi: 10.1007/BF02361160
McArdle JJ, Hamagami F (2003) Structural equation models for evaluating dynamic concepts within longitudinal twin analyses. Behav Genet 33:137–159. doi: 10.1023/A:1022553901851
Muthen LK, Muthen BO (2017) MPlus User’s Guide, 8th edn. Muthen & Muthen, Los Angeles, CA
Neale MC, Cardon LR (1992) Methodology for Genetic Studies of Twins and Families. Springer Netherlands, Dordrecht
Parker JG, Asher SR (1993) Friendship and friendship quality in middle childhood: Links with peer group acceptance and feelings of loneliness and social dissatisfaction. Dev Psychol 29:611–621. doi: 10.1037/0012-1649.29.4.611
Pérez-Edgar K, Bar-Haim Y, McDermott JM, et al (2010) Attention biases to threat and behavioral inhibition in early childhood shape adolescent social withdrawal. Emotion
10:349–357. doi: 10.1037/a0018486
Rubin KH, Coplan RJ, Bowker JC (2009) Social withdrawal in childhood. Annu Rev Psychol 60:141–171. doi: 10.1146/annurev.psych.60.110707.163642
Schlomer GL, Bauman S, Card NA (2010) Best practices for missing data management in counseling psychology. J Couns Psychol 57:1–10. doi: 10.1037/a0018082
Steiger JH (1980) Tests for comparing elements of a correlation matrix. Psychol Bull 87:245–251. doi: 10.1037/0033-2909.87.2.245
Turner SM, Beidel DC, Townsley RM (1990) Social phobia: Relationship to shyness. Behav Res Ther 28:497–505. doi: 10.1016/0005-7967(90)90136-7
Van der Valk JC, Van den Oord EJCG, Verhulst FC, Boomsma DI (2003) Genetic and environmental contributions to stability and change in children’s internalizing and externalizing problems. J Am Acad Child Adolesc Psychiatry 42:1212–1220. doi: 10.1097/01.chi.0000081824.25107.bb
Verhulst FC, Ende D, Ferdinand RF, Kasius MC (1997) The prevalence of DSM-III-R diagnoses in a national sample of dutch adolescents. Arch Gen Psychiatry 54:329–336. doi: 10.1001/archpsyc.1997.01830160049008
Verhulst FC, Koot HM, Ende J (1994) Differential predictive value of parents’ and teachers’ reports of children’s problem behaviors: A longitudinal study. J Abnorm Child Psychol 22:531–546. doi: 10.1007/BF02168936
Volbrecht MM, Goldsmith HH (2010) Early temperamental and family predictors of shyness and anxiety. Dev Psychol 46:1192–205. doi: 10.1037/a0020616
Zumbo BD, Gadermann AM, Zeisser C (2007) Ordinal versions of coefficients alpha and theta for likert rating scales. J Mod Appl Stat Methods 6:21–29. doi:
Tables and Figures
Table 1
Descriptive Statistics and Intra-Pair Pearson Correlations for Teacher-Rated Shyness
Assessment N pairs Mean (SD) Intra-pair correlations
MZ SS DZ OS DZ Age 6 386 .76 (.52) .49** .02 .19* Age 7 408 .79 (.47) .33** .12 .28** Age 9 361 .74 (.44) .39** .26* -.02 Age 10 370 .71 (.44) .46** .32** .15 Age 12 282 .68 (.45) .49** .22* .11
Note. ** p < .01. * p < 0.05. Abbrevations: MZ = monozygotic twins; SS DZ = same-sex
Table 2
Pearson Correlation Coefficients for Teacher-Rated Shyness across Time
Age 6 Age 7 Age 9 Age 10 Age 12
Age 6 1
Age 7 .30 1
Age 9 .23 .33 1
Age 10 .27 .26 .32 1
Age 12 .24 .32 .28 .32 1
Table 3
Cross-Twin Cross-Trait Pearson Correlations for Teacher-Rated Shyness
MZ twins Assessment Twin 1 Age 6 .49** .40** .20* .24** .29** Age 7 .32** .33** .36** .21* .27** Twin 2 Age 9 .19* .30** .39** .28** .34** Age 10 .26** .37** .24** .46** .21* Age 12 .26* .29** .16 .25* .49** DZ twins Assessment Twin 1 Age 6 .11 .07 .06 .12 -.01 Age 7 .02 .21** .18* .13 .13 Twin 2 Age 9 -.01 .05 .11 .12 .14 Age 10 -.00 .15 .17* .26** .25** Age 12 .12 .15 .05 .09 .17*