Université de Montréal
Association entre l’élastographie vasculaire non-invasive et
l’indice de masse corporelle chez les enfants
Association between non-invasive vascular elastography and body mass index in
children
par Ramy El Jalbout, M.D.
Département des sciences biomédicales Faculté de médecine
Mémoire présenté à la faculté des études supérieures en vue de l’obtention du grade de maîtrise
en sciences biomédicales Option générale
Avril 2017
i
Résumé
Sachant que l’Athérosclérose commence durant l’enfance par des marqueurs subcliniques, cette étude explore l’association entre l’indice de masse corporelle (IMC) et l’élastographie vasculaire non-invasive (NIVE) des artères carotides communes chez les enfants. On compare aussi les techniques de mesure de l’intima-média (IMT) des artères carotides en se basant sur le mode-B et la radiofréquence (RF) chez les enfants avec IMC normal et élevé. Il s’agit d’une étude prospective effectuée entre 2005 et 2011. Les paramètres de « NIVE » ont été comparés pour deux groupes d’IMC (normal et élevé) de 60 enfants respectivement, faisant tous partie de la cohorte de l’étude QUebec Adipose and Lifestyle Investigation in Youth (QUALITY). Les paramètres de NIVE incluent la contrainte axiale cumulative (CAS) en %, la translation axiale cumulative (CAT) en mm. L’épaisseur de l’intima-média est calculée selon trois méthodes : logiciel «M’ath-Std» (mode-B), « echotracking » des signaux de RF et
probabilité de distribution des signaux de RF sur la plateforme NIVE. Une analyse ANOVA et
corrélation Pearson ont été effectuées sur le logiciel SAS version 9.3. Une corrélation intra-class (ICC) a été effectuée sur un logiciel MedCalc version 17.2. L’âge moyen était 11,4 ans pour le groupe IMC normal et 12 pour le groupe IMC élevé. Cinquante-huit pourcent étaient des garçons dans le groupe IMC normal et 63% dans le groupe IMC élevé. Les deux groupes étaient différents selon l’âge, stade de Tanner, tension artérielle (systolique et diastolique), et LDL mais similaire pour le sexe. En
contrôlant pour les variables confondantes, la CAS n’est pas différente entre les deux groupes. La CAT est plus basse chez les enfants avec IMC normal (CAT=0.51 +/-0.17 mm pour le groupe « IMC normal » et 0.67+/-0.24 mm pour le groupe « IMC élevé » (p<0.001)). Il y a une très faible corrélation entre les trois techniques de mesure d’IMT ICC=0,34 (95% intervalle de confiance 0,27-0,39). L’IMT est significativement plus élevé dans le groupe d’enfants « IMC élevé ». Mode-B (0.55 mm « IMC normal » vs. 0.57 mm « IMC élevé »; p=0.02); IMT RF (0.45 mm « IMC normal » vs. 0.48 mm « IMC élevé »; p=0.03) et IMT probabilité de distribution des signaux RF (0.32 mm « IMC normal » vs. 0.35 mm « IMC élevé »; p=0.010). La NIVE montre une différence significative dans la CAT de l'artère carotide commune des enfants avec un IMC normal par rapport à l'IMC élevé. Des variations significatives de la mesure des IMT ont été observées entre les différentes techniques. Cependant, les enfants avec IMC élevé ont des valeurs IMT plus élevées, indépendamment de la méthode utilisée. Les deux marqueurs subcliniques peuvent être utilisés pour la stratification des enfants à risque de maladies
ii
Mots-clés : Élastographie vasculaire non-invasive, indice de masse corporelle, épaisseur intima-média,
iii
Abstract
Knowing that cardiovascular disease risk factors are present in asymptomatic children, this study explores the association between non-invasive vascular elastography (NIVE) as a subclinical marker of atherosclerosis and obesity in children. In the absence of a gold standard, we also compare B-mode and Radiofrequency (RF) based ultrasound measurements of intima-media thickness (IMT) in children with normal and increased body mass index (BMI). This is a prospective study between 2005 and 2011. NIVE parameters and IMT of the common carotid artery were compared between 60 children with normal BMI and 60 children with increased BMI enrolled in the QUebec Adipose and Lifestyle Investigation in Youth cohort (QUALITY). NIVE parameters included cumulated axial strain (CAS) (%) and cumulated axial translation (CAT) in mm. The three methods of IMT measurements included M’ath Std (B-mode), RF echotracking system and RF probability distribution using NIVE platform. ANOVA analysis and Pearson correlation were calculated using SAS version 9.3. Intra-class
correlation coefficient (ICC) and regression analysis was done on MedCalc software version 17.2. The mean age was 11.4 years for the normal BMI group and 12 years for the increased BMI group. Fifty-eight percent were boys in the normal BMI group and 63% in the increased BMI group. The two groups were significantly different with respect to age, Tanner stage, systolic and diastolic blood pressure and were similar with respect to sex. After controlling for confounders, the results show no difference in CAS between the two groups and a significantly lower CAT in the normal BMI group (CAT=0.51+/-0.17 mm for the normal BMI group and 0.67+/-0.24 mm for the increased BMI group (p<0.001)). There is a weak correlation among the three techniques. ICC=0.34 (95% confidence interval (CI): 0.27-0.39). There is however significantly increased IMT in children with increased BMI according to all three techniques. The results were as follow: for B-mode IMT (0.55 mm (normal BMI group) vs. 0.57 mm (increased BMI group); p=0.02); for RF echotracking IMT (0.45 mm (normal BMI group) vs. 0.48 mm (increased BMI group); p=0.03) and for RF probability distribution IMT (0.32 mm (normal BMI group) vs. 0.35 mm (increased BMI group); p=0.010).NIVE is a one-step technique for IMT and CAT measurement in children at risk. Significant IMT measurement variation is observed between the three techniques. However, children with increased BMI tend to have higher IMT values regardless of the technique. Both subclinical markers can be used for optimal stratification of children with cardiovascular disease risk factors. The same technique should be used throughout.
iv
Keywords: Non-invasive vascular elastography, Intima-media thickness, Body mass index,
v
Table of content
Résumé ... i
Abstract ... iii
Table of content ... v
List of tables ... viiii
List of figures ... viiiiii
List of abbreviations ... ix
Acknowledgement ... x
Introduction ... 1
Chapter 1: Literature review ... 3
1.1 Childhood obesity and cardiovascular diseases ... 3
1.2 Evaluation of subclinical markers at imaging ... 4
Material and methods ... 7
Chapter 2. Association between carotid artery non-invasive elastography and BMI as indicator of early changes for developing cardiovascular diseases in children ... 12
2.1 Abstract ... 12
2.2 Introduction ... 14
2.3 Materials and Methods ... 15
2.3.1 Study design and patient population ... 15
2.3.2 Data analysis ... 16
2.3.3 Image acquisition ... 17
2.3.4 Carotid wall segmentation and NIVE computation ... 17
2.3.5 Statistical analysis ... 18
2.4 Results ... 18
2.5 Discussion ... 20
2.6 Conclusion ... 22
2.7 References ... 23
Chapter 3: Carotid artery intima-media thickness measurement in children with normal and increased BMI: A comparison of three techniques ... 35
vi
3.1 Abstract ... 35
3.2 Introduction ... 37
3.3 Materials and methods ... 38
3.3.1 Study design and patient population ... 38
3.3.2 Data analysis ... 38 3.3.3 Image acquisition ... 39 3.3.4 Statistical analysis ... 40 3.4 Results ... 40 3.5 Discussion ... 42 3.6 Conclusion ... 45 3.7 References ... 45
Discussion and conclusion ... 52
vii
List of tables
Chapter 2
Table I. Comparison of mean values of BMI z-score, age, sex, Tanner stage, blood pressure and LDL between the two groups………....27 Table II. Pearson correlation coefficients for the relationship between blood pressure and NIVE parameters in the two groups……….………...28 Table III. Summary table of the values, standard error and p values of ANOVA
multiple comparison analysis of NIVE parameters between the two groups…………29
Chapter 3
Table IV. Comparison of mean values of BMI z-score, age and sex between the groups of children with normal BMI and those with increased BMI………48
viii
List of figures
Chapter 1
Figure 1. The atherosclerosis process ... 10 Figure 2. Conceptual map ... 10 Chapter 2
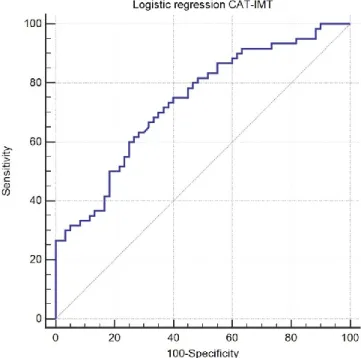
Figure 3. Flow chart of visit 2 of the QUALITY study among which the 120 children were randomly selected. ... 30 Figure 4. Static ultrasound image obtained from the RF video sequence………... 30 Figure 5. Time varying curve representing strain and translation ... 31 Figure 6. ROC graph of logistic regression analysis of both CAT and IMT plotted against increased BMI as outcome. ... 33 Chapter 3
Figure 7. Box and whisker plot of IMT measurements according to B-mode, RF echotracking and RF probability distribution techniques. ... 49 Figure 8. Agreement plots and regression lines between the 3 techniques. ... 49 Figure 9. Box and Whisker plot of IMTs obtained for the normal BMI and increased BMI groups using B-mode, RF echotracking and RF probability distribution techniques………...………..51
ix
List of abbreviations
AEPC Association for European pediatric cardiology BMI Body mass index
CAS Cumulated axial strain CAT Cumulated axial translation CLT Cumulated lateral translation CI Confidence interval
CRP C-reactive protein ECG Electrocardiogram
ICC Intra-class correlation coefficient IMT Intima-media thickness
LDL Low density lipoprotein
LSME Lagrangian speckle model estimator MAX |SSE| Maximal shear strain magnitude NIVE Non-invasive vascular elastography PWV Pulse wave velocity
QUALITY QUebec Adipose and Lifestyle Investigation in Youth QCAHS Quebec Child and Adolescent Health and Social Survey RF Radiofrequency
x
Acknowledgement
I would like to thank all my colleagues at the radiology department of CHU Sainte-Justine, especially Dr. Josée Dubois, my boss, research director, and idol. I would also like to thank QUALITY and NIVE research teams, Mr. Thierry Ducruet, biostatistician at Sainte-Justine University Health Center and Ms. Liette Bigras for her help in making this thesis better.
1
Introduction
The prevalence of obesity in children is increasing in North America [1]. Atherosclerosis is a known complication. Mortality and morbidity rates attributed to
atherosclerosis are high. Atherosclerosis does begin in childhood and obese children tend to become obese adults [2, 3, 4]. The detection of early subclinical changes in the vascular wall of the common carotid artery such as arterial stiffness and intima-media thickness (IMT) could be helpful in the stratification of children with risk factors. IMT is the thickness of the
interface of two anatomical boundaries: lumen-intima and media adventitia seen on B-mode ultrasound as echogenic lines. In this perspective, the QUebec and Lifestyle Investigation in Youth study (QUALITY) aims at looking at the cardiometabolic consequences of obesity in children and subclinical markers thereof [3]. The relationship between obesity and arterial wall stiffness and IMT is complex. It depends on many factors such as lipid profile, blood pressure, sexual maturity (Tanner stage), age and sex.
Techniques used in the evaluation of arterial wall stiffness include pulse wave velocity (PWV) (using a finger pulse wave sensor), β stiffness and IMT. PWV is the time of
propagation of the arterial pulse pressure and is currently the method of choice to assess arterial stiffness clinically [5, 6]. β stiffness using the difference in luminal diameter between systole and diastole is another common indicator of arterial wall elasticity [7]. Other
techniques exist such as catheter-based endovascular elastography which is however invasive. Strain elastography looks at the arterial wall deformation secondary to external
pressure. Shear elastography uses an external ultrasound pulse wave. Acoustic Radiation Force Impulse (ARFI) imaging is an example of shear elastography. It analyzes relative differences in tissue displacement by monitoring tissue response within a radiation force region of excitation (ROE). In Shear Wave Elasticity Imaging (SWEI), low-frequency shear wave propagation away from the ROE is used to quantify tissue stiffness [8]. These are different from non-invasive vascular elastography (NIVE) which uses the natural cardiac pulsation to evaluate the vessel wall biomechanics.
2
Besides its non-invasiveness and lack of external force, NIVE is distinguished by its robustness related to the mathematical algorithms behind its calculation. Mathematical details of the Lagrangian speckle model estimator (LSME) implementation used in NIVE have been reported in the literature [9]. Consecutive radiofrequency (RF) images are used to generate each elastogram of an imaging sequence, from which a time-varying curve representative of the vessel wall deformation and translation is obtained during systole and diastole [10, 11]. The deformation of the vessel wall is computed with an affine-based model analyzing two dimensional (2D) RF echoes between successive frames. It involves a nonlinear minimization algorithm that enables analysis of the 2D deformation matrix. NIVE evaluates translation, axial strain and shear of the vessel wall in the longitudinal plane with an external ultrasound probe. It assumes incompressibility and isotropy of the tissue within small measurement windows that overlap within the whole segmented region of interest. A mean value is estimated for each parameter over all measurement windows. A robust estimation of arterial biomechanics is therefore obtained. The reliability and reproducibility of this method has been proven in adults [10, 11, 12] but not in children.
The segmentation of the vessel wall and generation of elastograms in NIVE use a dedicated platform (ORS-NIVE, Object Research System, Montreal, Canada). A region of interest comprising the IMT and the adventitia is identified and manually segmented on the first frame of the cine-loop acquisition to initiate the automated segmentation that is
propagated to subsequent frames. The segmentation process is based on the analysis of a mixture of Nakagami probability distributions defining image speckle [13, 14]. The LSME algorithm is then applied to generate elastography parameters of the sub-segments. An average IMT value of all sub-segments is also obtained.
NIVE is a promising non-invasive alternative for elasticity and IMT measurements. It aims at evaluating early mechanical vascular wall changes not seen with conventional
ultrasound. The combination of IMT and NIVE parameters could become a potential strong marker of subclinical atherosclerosis in children.
3
IMT was shown to be increased in overweight/obese children [1]. IMT measurement techniques in the literature include B-mode ultrasound and RF-based ultrasound. The clinical usefulness of IMT in children is limited because of lack of comparative studies among techniques. Measurements need to be adjusted for the inherently thinner IMT in children. Many factors influence IMT, namely age, maybe sex, patient positioning during image acquisition and the technique whether based on B-mode ultrasound (automatic or manual), or based on RF echotracking (automatic or semi-automatic). This is why there are
recommendations on measuring and reporting IMT [15, 16].
The primary objective of this study was to evaluate the potential of NIVE as a non-invasive one-step method to calculate IMT and detect early changes in vascular biomechanics associated with children with increased body mass index (BMI) in comparison to children with normal BMI. The secondary objective is to compare this IMT measurement to conventional B-mode based and echotracking RF-based measurements.
Chapter 1: Literature review
1.1 Childhood obesity and cardiovascular diseases
The cardiovascular diseases attributed mortality rate was about 244/100 000 in North America [1]. Baker et al. showed an association between BMI in childhood and cardiovascular diseases and mortality in adulthood. Obese children tend to remain obese in adulthood [2]. Genetic risk factors show that children of obese parents tend to be obese.
In 1999, the Quebec Child and Adolescent Health and Social Survey (QCAHS) found prevalence between 20.7 and 22.7% of overweight and obesity among children aged 9 to 16 years. Despite methodological differences in the studies done in Quebec and Canada, the prevalence of overweight and obesity among children seems to be increasing. There is a clear association between obesity and dyslipidemia, hyperinsulinemia and hypertension. QCAHS
4
study demonstrated elevated lipid profile among 64% of obese boys and 54% of obese girls, abnormal insulin levels among 72% of boys and 80% of girls and increased blood pressure among 40% of boys and 41% of girls. QCAHS showed that four other biomarkers are
increased in association with cardiometabolic diseases: Apo-B, low density lipoprotein (LDL), glucose and C-reactive protein (CRP). CRP is a surrogate marker of cardiovascular diseases and diabetes. CRP was increased in 18% of boys and 29% of girls [17].
Dyslipidemia is a related risk factor. It is associated with obesity. In this perspective, the American Academy of Pediatrics (AAP) recommends screening as early as two years of age in children with risk factors including obesity, hypertension, diabetes and family history thereof [18, 19].
Obesity, dyslipidemia and hypertension in children are related to hemodynamic changes. Childhood hypertension predicts hypertension in adulthood. However, the
relationship between childhood hypertension and cardiovascular sequelae of hypertension in adults is not clear [20].
In summary, risk factors of cardiovascular diseases in adulthood begin early on. Since children are asymptomatic, the need for subclinical markers at lab tests and imaging is
important to help in risk stratification and prevention. Diet modification, weight loss
encouragement and sometimes medication could be helpful in reversing the consequences of obesity.
1.2 Evaluation of subclinical markers at imaging
The cardiovascular sequelae related to atherosclerosis begin with arterial wall
mechanical changes secondary to endothelial damage and develop into fat streak deposits and later atherosclerotic plaques which lead to vascular stenosis, myocardial infarction and stroke (figure 1). Since morbidity and mortality related to these diseases are high, the more the risk stratification is accurate, the better the prevention will be. IMT is a surrogate marker of
5
mechanical vascular wall dysfunction. The Cardiovascular Risk in Young Finns study showed a positive association between IMT and BMI [21]. Obesity, dyslipidemia and hypertension in children are related to increased IMT [20].
Ultrasound is the modality of choice to evaluate atherosclerotic plaques in adults. In the absence of atherosclerotic plaques, IMT could be used to evaluate early vascular changes. There are two techniques to measure IMT, using B-mode ultrasound and RF echotracking. By placing the ultrasound transducer parallel to the carotid artery, B-mode IMT is measured on the screen either manually with calipers or semi-automatically by indicating the region of interest on the screen. The software will then calculate IMT of the selected area. RF techniques involve an interface in the ultrasound machine to detect RF raw signals that are tracked back to assess IMT. IMT measurement in children is difficult due to the small dimension of the vessel wall and inconsistencies in measurement techniques. This has led to lack of consistent age dependant normative values. The Mannheim consensus and the Association for European Pediatric Cardiology (AEPC) have set uniformal criteria for
measuring and reporting IMT [15, 16]. This facilitates comparison of different cohorts. There is no gold standard technique for IMT measurement at the time being.
Besides IMT, vascular elastography is used to assess the early mechanical changes before the appearance of atherosclerotic plaques. There are three types of elastography in general. The first is strain elastography and consists of applying pressure with the ultrasound probe on the organ of interest (mainly applied to assess liver fibrosis). The ultrasound registers the velocity of the propagated waves and gives an estimation of liver elasticity. The second type is Shear wave elastography in which there is a shear ultrasound pulse wave traveling through the tissue, the velocity of which, gives an estimation of its stiffness (used in breast masses, thyroid nodules and has vascular applications). The third type is NIVE which assesses the strain and the translation of the vessel wall as it distends and collapses during systole and diastole respectively. NIVE gives elastography maps of the vessel wall by calculating the deformation matrix of RF waves obtained by ultrasound secondary to the vascular wall movement and deformation using LSME [11]. Basically, in contradistinction to endovascular elastography which is invasive and necessitates intravascular access, NIVE uses a
6
conventional ultrasound probe placed on the common carotid artery. A video sequence of 30 seconds (five cardiac cycles) is recorded. This video is then analyzed in special software available at the University of Montreal Research Center (ORS-NIVE). It uses the RF-generated pulses from sub-segments of the vessel which are encoded and averaged over the entire vascular wall imaged in the video. The relative arterial wall movement and scatters cause changes in the amplitude and phase of backscattered waves. LSME assesses the
deformation matrix and allows tissue motion estimation as a nonlinear minimization problem restoring the best match between the pre-motion image and the restored speckle post-motion image. LSME allows assessment of 2D deformation matrix including the axial strain, shear and the lateral strain and shear. The average values of strain and translation are then calculated from the elastography map. The segmentation of the vessel wall RF data obtained from a regular B-mode image is mathematically done using a mixture of Nakagami distributions and stochastic optimization. Explained in a simplified manner, the echogenicity of the intima-media layer, the lumen and the adventitia is mathematically modeled by a mixture of
algorithms. The first is the expectation maximization algorithm which is an iterative statistical method to find maximum likelihood (a posteriori). The second is a variant of the
exploration/selection algorithm to obtain the optimal segmentation of the carotid wall. This method is semi-automatic [13]. The same segmentation is used to measure IMT.
NIVE has been validated in vitro using polyvinyl phantoms and in vivo in healthy adults and those with atherosclerotic plaques. It can estimate shear between the different tissue layers that make up the vessel wall and the shear between the vascular wall and atherosclerotic plaques (to predict its stability). It showed that elasticity is increased in young adults and in women compared to older men [10]. NIVE has not been studied in children.
PWV, β stiffness, ambulatory arterial stiffness and IMT are currently used in children to evaluate early vascular changes. PWV is a functional simple technique to assess arterial stiffness by measuring the velocity of cardiac pulse pressure through the artery. The stiffer the artery the faster the pulse pressure travels. PWV is evaluated using applanation tonometry, oscillometry, Doppler echocardiography or MRI. The gold standard is the carotid femoral PWV. Pulse wave analysis (PWA), is a mixture of central and peripheral arterial stiffness
7
assessment [22]. There are published normative values in children and the technique is very useful clinically [23]. β stiffness assesses arterial distention capability by measuring the luminal diameter in systole and diastole. Ambulatory arterial stiffness in children is defined as one minus the regression slope of 24 h systolic and diastolic blood pressure. Saner et al. found increased ambulatory arterial stiffness in obese children independently from systolic and diastolic blood pressure (but not pulse pressure) [24].
The need in children for an imaging modality that assesses elasticity and IMT at the same time is therefore important to help in risk stratification. NIVE is a potential tool to examine these two subclinical markers at imaging using a single ultrasound exam.
Elastography could be a surrogate to PWV and the inherent mathematical calculation of IMT using the segmentation method could be a promising technique in children in the absence of a gold standard. Validation in children is needed in the light of the promising results of the reproducibility of NIVE in healthy adults who, like children, do not have atherosclerotic plaques.
Material and methods
The QUALITY cohort aims at identifying predictive risk factors of cardiometabolic diseases related to obesity in Quebec children. It is a prospective study done between 2005 and 2011. It consists of a multidisciplinary team of over 20 researchers with different expertise. Its objectives are to explore the relationship between excess weight and its cardiometabolic consequences taking into account the genetic, sociodemographic, anthropometric and
economic factors. One of its explicit objectives is to examine the relationship between obesity in children and subclinical markers of atherosclerosis.
A total of 387 377 pamphlets were distributed in 1040 primary schools in the cities of Montreal, Sherbrooke and Quebec of which 89% accepted participation. Eligibility criteria
8
included: Caucasian children of western European ancestry aged between 8 and 10 years, with at least one obese biological parent defined as BMI ≥30 kg/m² or waist circumference >102 cm in men and >88 cm in women. Both biological parents should have been available for assessment.
Exclusion criteria included pregnant or breastfeeding mother or if the family had impending plan to move out of province. A previous diagnosis of diabetes type 1 and 2 in the child, a serious illness or psycocognitive disorder limiting the child’s participation in the project and treatment with anti-hypertensive medication or oral steroids were the other exclusion criteria. Children following very restricted diet were also excluded.
The recruitment and data collection was done by QUALITY team. Demographic data, lifestyle behavior data and health information were all collected. Anthropometric data, sexual maturation, dietary intake, overnight fasting blood chemistry, Dual-Energy X-Ray
Absorptiometry (DEXA), carotid artery IMT as well as dental exam were obtained at the second visit.
Among the 564 families who completed the second visit, I have randomly selected 120 children from two groups of normal and increased BMI as defined by ≥85th percentile for age and sex. I have solicited the age, sex, Tanner stage, blood pressure, lipid profile data for all 564 children. I have then looked up the information relative to the specific 120 selected children. I did the descriptive analysis, selected the carotid artery videos and looked at the corresponding IMT values obtained using B-mode and RF echotracking techniques. I have then sent the videos to NIVE lab for segmentation and elastography analysis.
Independent variables included age, sex, Tanner stage, systolic blood pressure, diastolic blood pressure and LDL. Outcome included cumulated axial strain (CAS) (%), cumulated axial translation (CAT) (mm), CAS/CAT, cumulated lateral translation (CLT) (mm), the maximal shear strain magnitude (Max |SSE|) and IMT (mm) (figure 2).
9
Age was calculated depending on date of birth. Sex was set by asking the child, BMI was calculated using the formula weight(kg)/height(m)², definition of overweight/obesity (increased BMI) is made according to the Centers for Disease Control age and sex adjusted z-score for weight and height. Tanner stage was assessed by specialized trained staff. Blood pressure was obtained as mean of three measures of a total of five taken one minute apart after at least five minutes of rest using a Dinamap XL Vital Signs Monitors. LDL was measured on an overnight fasting blood sample.
Ultrasound videos and RF echotracking IMT were obtained using a linear array L10-5 40 mm ultrasound transducer (model 410503) on MyLab-70 platform (ESAOTE) equipped with an ART.LAB platform. These videos were sent to NIVE lab.
B-mode IMT measurements were obtained using an ATL 5000 HDI unit equipped with a 5.5-12.5 MHz probe and a mean of 25 frames per second. Automated measurements were obtained from 2D image acquisition using M’Ath-Std (Metris, Argenteuil, France). We sought a quality index >0.5 for each IMT measure indicating that more than 50% of the measures were taken into account by the software to calculate the average IMT. We used maximal optic visualization without electrocardiogram (ECG) monitoring.
We measured elasticity and IMT of the far wall of the common carotid artery at 1 cm from the bifurcation. The child was in the supine position with head tilt 45 degrees away from the examined side. The videos were taken by two different ultrasound technologists. There was blind data acquisition and analysis.
10
Figure 1. Diagram showing that the atherosclerosis process begins with changes in the vascular stiffness and ends with atherosclerotic plaques.
CAD: Coronary artery disease
Figure 2. Conceptual map showing the independent variable (BMI), outcome (IMT and elastography), and the confounders including blood pressure, lipid profile, age, sex
and Tanner stage CAD, Stroke, Aneurysms
Physical properties Fat deposition Fibrous plaques Atherosclerotic plaques Age 10 20 30 50 70
IMT
BMI
Hypertension
Dyslipidemia
Age
sex*
Tanner
Vascular elastography
11
I am the main author of the following article entitled Association between carotid artery non-invasive elastography and BMI as indicator of early changes for developing cardiovascular diseases in children. I did data collection from QUALITY study data bank. Dr. Josée Dubois and Dr. Guy Cloutier were implicated in the study design. Mr. Thierry Ducruet helped me in statistical analysis. The manuscript was reviewed by Dr. Mélanie Henderson, Chantale Lapierre, Emile Lévy and Gilles Soulez.
12
Chapter 2. Association between carotid artery non-invasive
elastography and BMI as indicator of early changes for
developing cardiovascular diseases in children
Ramy El Jalbout1, Guy Cloutier2, Mélanie Henderson3, Emile Levy3, Chantale Lapierre1, Gilles Soulez4, Josée Dubois1
1 University of Montreal, Department of Radiology, Sainte-Justine University Health Center, Montreal, Quebec, Canada
2 Laboratory of Biorheology and Medical Ultrasonics, University of Montreal Hospital Research Center (CRCHUM), Montreal, Quebec, Canada
3 University of Montreal, Department of Pediatrics, Sainte-Justine University Health Center, Montreal, Quebec, Canada
4 University of Montreal, Department of Radiology, University of Montreal Hospital, Montreal, Quebec, Canada
Article submitted to Radiology, authorized to resubmit with corrections
2.1 Abstract
Purpose: Determine whether there are differences in carotid artery wall properties and intima- media thickness (IMT) in children with normal and increased body mass index (BMI)
according to Non-Invasive Vascular Elastography (NIVE).
Methods: This is a prospective study between 2005 and 2011. We randomly selected 120 children from the QUebec Adipose and Lifestyle Investigation in Youth cohort (QUALITY) study among two groups of normal and increased BMI. QUALITY study is approved by the Ethics Review Board of the Sainte-Justine University Health Center and Quebec Heart and Lung Institute. Written informed consent was obtained from caregivers. Video sequences of
13
the common carotid arteries obtained with radiofrequency (RF) ultrasound using a high frequency linear transducer were obtained. The carotid wall was then segmented. The
Lagrangian speckle model estimator (LSME) was used to measure the cumulated axial strain (CAS), cumulated axial translation (CAT), cumulated lateral translation (CLT), and maximal shear strain (Max |SSE|). Intima-media thickness (IMT) was also calculated. Variables were included in a multivariate model including age, sex, Tanner stage, blood pressure and low density lipoprotein (LDL).
Results: The mean age was 11.4 years for the normal BMI group and 12 years for the
increased BMI group. Fifty-eight percent were boys in the normal BMI group and 63% in the increased BMI group. The two groups were significantly different with respect to age, Tanner stage, systolic and diastolic blood pressure and were similar with respect to sex. CAS was not significantly different between the normal BMI and increased BMI groups (6.10±1.78% and 5.72 ±1.86%, respectively (p=0.58)). CAT was lower in the normal BMI group (0.51±0.17 mm (normal BMI) 0.67±0.24 mm (increased BMI) (p<0.001)). Respectively for the normal BMI and increased BMI groups, CLT was 0.98±0.33 mm and 0.90±0.34 mm (p=0.21), and Max |SSE| was 0.48±0.12% and 0.53±0.12% (p=0.38). IMT was significantly lower in the normal BMI children (IMT=0.32 mm) compared to the increased BMI group (IMT=0.35 mm) (p=0.013).
Conclusion: NIVE has the potential to detect early mechanical changes at the level of the carotid vessel wall associated with overweight and obesity in children.
14
2.2 Introduction
Atherosclerosis begins subclinically in childhood, and is characterized by changes in the mechanical properties of the carotid wall followed by fat deposition and eventually atherosclerotic plaques in adulthood [1]. The initial step in atherosclerosis is endothelial dysfunction followed by abnormal vasomotion and increased arterial stiffness [2].
The Pathobiological Determinants of Atherosclerosis in Youth study showed that atherosclerosis begins in childhood and progresses over time [3, 4]. Obese children are at higher risk of remaining obese adults [5]. Among the markers associated with early
atherosclerosis is the intima-media thickness (IMT). Obesity is associated with increased IMT [6, 7]. Although IMT measurement in adults is reproducible, this parameter in the pediatric population is vulnerable to variation depending on the technique [8, 9, 10]. These technical limitations incited the Association for European Pediatric Cardiology (AEPC) to publish guidelines for the scanning technique, measurement and interpretation of IMT [9].
There are several methods to assess subclinical changes in vessel wall compliance [11, 12]. They are different than non-invasive vascular elastography (NIVE) which uses the natural cardiac pulsation to evaluate vessel wall biomechanics. Among them, pulse wave velocity (PWV) which is the time of propagation of the arterial pulse pressure and is currently the method of choice to assess arterial stiffness clinically [13]. β stiffness technique calculates the difference in luminal diameter between systole and diastole which is an indicator of arterial wall elasticity [12].
What makes NIVE different is the mathematical calculation behind it. It is based on the Lagrangian speckle model estimator (LSME) [14]. Consecutive radiofrequency (RF) images are used to generate each elastogram of an imaging sequence, from which a time-varying curve representative of the vessel wall deformation and translation is obtained during systole and diastole [14, 15, 16]. The deformation of the vessel wall is computed with an affine-based model analyzing two dimensional (2D) RF echoes between successive frames. It
15
involves a non-linear minimization algorithm that enables analysis of the 2D deformation matrix. It assumes incompressibility and isotropy of the tissue within small overlapping measurement windows. A mean value is estimated for each parameter. A robust estimation of arterial biomechanics is therefore obtained.
NIVE is a promising non-invasive alternative for elasticity and IMT measurement. The goal of this study was to evaluate the potential of NIVE as a non-invasive one-step method to calculate IMT and detect early changes in vascular biomechanics associated with obesity in children.
2.3 Materials and Methods
2.3.1 Study design and patient population
This is a prospective study between 2005 and 2011. NIVE parameters were compared between children with increased body mass index (BMI) and children with normal BMI enrolled in the QUebec Adipose and Lifestyle Investigation in Youth cohort (QUALITY). QUALITY study aims at evaluating the cardiometabolic consequences of obesity in childhood in response to growing concern for cardiovascular risk factors [17, 18]. Pamphlets were distributed in schools of Montreal, Quebec and Sherbrooke. Inclusion criteria were Caucasian and healthy children having at least one obese parent defined as BMI >30 kg/m2. Children were recruited at 8 to 10 years of age (n=634). Other inclusion criteria were Caucasian and healthy children. Exclusion criteria were as follows: mother of child being pregnant or breastfeeding, families planning to leave the province, children with cognitive challenge, children on hypertensive medication and oral steroids. The current manuscript involves 120 children of the 562 who completed the second visit when the children were aged 10-12 years. The QUALITY cohort demographic and social profiles were described in a previous
16
consideration the different variables we wished to include in the study, we prospectively calculated a power of 90 participants. We randomly selected 60 children with increased BMI (defined as BMI ≥ the 85th percentile for age and sex) and 60 with normal BMI (BMI < 85th percentile). QUALITY study has been approved by the Ethics Review Board of the Sainte-Justine University Health Center and Quebec Heart and Lung Institute. Written informed consent was obtained from the children’s caregivers.
2.3.2 Data analysis
Primary endpoints included the cumulated axial strain (CAS), cumulated axial translation (CAT), CAS/CAT, cumulated lateral translation (CLT), and the maximal shear strain magnitude (Max |SSE|). The secondary endpoint was IMT calculated using
segmentation of the same video used for NIVE analysis. Since obesity and lipid profile are related to cardiovascular diseases and since NIVE stems from the inherent deformation of the vessel wall secondary to distention and relaxation in systole and diastole, the independent variables which we included were BMI, age, sex, systolic and diastolic blood pressures (taking into account pulse pressure) and low density lipoprotein (LDL). This information and carotid ultrasound data were all collected during the same visit. Blood pressure was taken 1.5 hours on average before the ultrasound exam. Weight was measured twice on an electronic scale to the nearest 0.1 kg. Height was measured twice to the nearest 0.1 cm. BMI was calculated according to the formula weight (kg)/height (m)2. Definition of overweight/obesity is made according to the Centers for Disease Control age and sex adjusted z-score for weight and height. Tanner stage was defined by specialized staff. Blood pressure was calculated as mean of last three measures of a total of five measures taken one minute apart after at least five minutes of rest using a Dinamap XL Vital Signs Monitors. LDL was measured on an overnight fasting blood sample.
17
2.3.3 Image acquisition
Using a linear array L10-5 40 mm ultrasound transducer (model 410503) of the MyLab-70 platform (ESAOTE) equipped with an ART.LAB platform, a two to five cardiac cycle long RF-digitized data was recorded. The frame rate was 30 per second. Gain
compensation was set at more than 60 dB. The cine-loop typically included 250 to 300
images. The videos were obtained by two technologists to minimize inter-operator variability. In this same perspective, we analyzed the time sequence videos of the far wall relative to the transcutaneous longitudinal ultrasound probe with 45 degrees head tilt to the opposite side. The common carotid artery was targeted at 1 cm from the bifurcation. Blinded analysis of all 120 sequences was made by NIVE.
2.3.4 Carotid wall segmentation and NIVE computation
The segmentation of the vessel wall and NIVE analysis were performed for the entire cine-loop acquisition using a dedicated platform (ORS Visual, Object Research Systems (ORS) Inc., Montreal, Canada). A region of interest comprising the IMT and the adventitia was identified and manually segmented on the first frame of the cine-loop acquisition to initiate the automated segmentation that was propagated to subsequent frames. The segmentation process was based on the analysis of a mixture of Nakagami probability distributions defining image speckle [19, 20]. The LSME algorithm was then applied to generate elastography parameters of the segmented vessel.
CAS in percentage measures the range of variation within a cardiac cycle of strain in the axial direction. CAT in millimeter reflects the amplitude of the axial movement of the vessel wall as it distends. CAS/CAT indicates strain per unit axial translation. Max |SSE| in percentage is the peak axial shearing motion occurring between the different tissue layers of the vessel wall within a cardiac cycle. CLT in millimeter represents the amplitude of the
18
movement from left to right in a longitudinal view of the carotid artery. IMT was calculated as an average thickness over systole and diastole excluding the adventitia. Each outcome was averaged over all available cardiac cycles.
2.3.5 Statistical analysis
The two study groups’ demographic, clinical and biological variables were compared. Univariate unpaired two-tailed Student t-tests and Chi square analysis was done with a significance level of p<0.05. Pearson correlation analysis was performed between systolic, diastolic and pulse pressure and the four NIVE parameters and IMT. All categorical and linear variables were included in a multivariate model (ANOVA) while controlling for age, sex, Tanner stage, blood pressure and LDL using SAS version 9.3. Bonferroni correction was also applied.
2.4 Results
Data on 564 children are available for the present analysis (figure 3). Of the 120 randomly selected children aged between 10 and 13 years at the time of the second visit, 73 were boys and 47 girls. The mean age was 11.4 years for the normal BMI group and 12 years for the increased BMI group. In the normal BMI group, 58% were boys and for the increased BMI group, 63% were boys. The two groups were significantly different with respect to age, Tanner stage, LDL, systolic and diastolic blood pressure and were similar with respect to sex. According to the inclusion criteria of the QUALITY study, they all had at least one obese parent. Children were not known of having any medical disease. Mean blood pressure and LDL were higher in the group of children with increased BMI. Three children had borderline high LDL blood level in the normal BMI group and one in the increased BMI group. One child had high LDL in the increased BMI group. The remainder had acceptable LDL blood
19
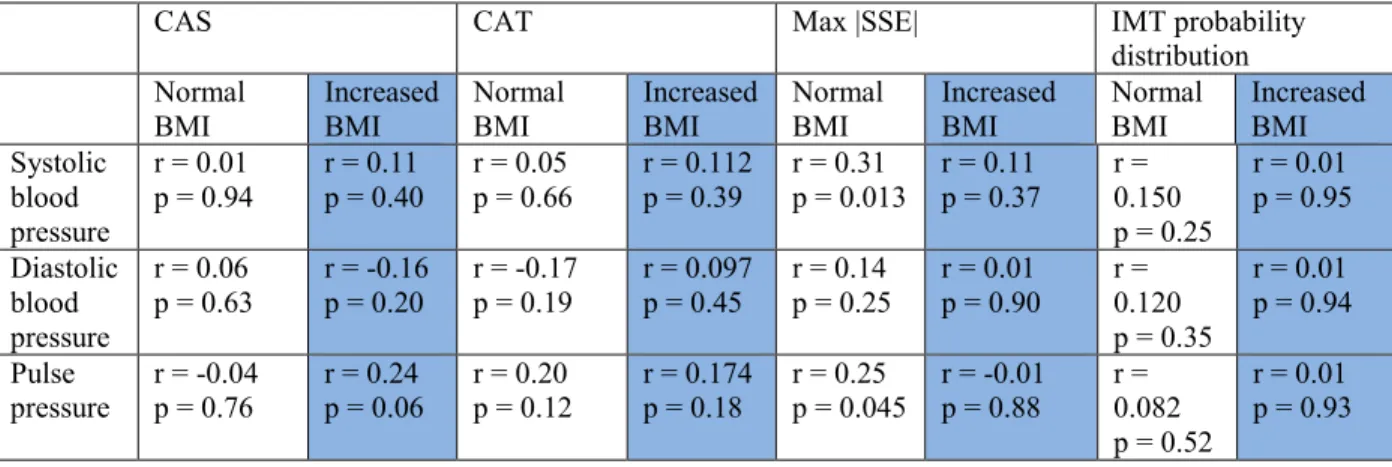
levels (<2.85 mmol/L according to American Academy of Pediatrics). Only one child in the increased BMI group had a high systolic blood pressure (96.2 percentile) as defined by more than the 95th percentile for age and sex. Twenty-six children had Tanner stage of two and above in the normal BMI group and 43 in the increased BMI group. Table I shows mean values for each physiological parameter for both groups. Pearson correlation coefficient analysis did not show relationship between systolic blood pressure, diastolic blood pressure, pulse pressure, and any of the primary and secondary outcomes in the increased BMI group (table II). In the normal BMI group, there was a weak correlation between systolic blood pressure and Max |SSE| (r=0.31 p=0.01). There was also a weak negative correlation between pulse pressure and Max |SSE| r=0.259 (p=0.04) (table II). There is no collinearity between blood pressure and the outcomes. All data were retained.
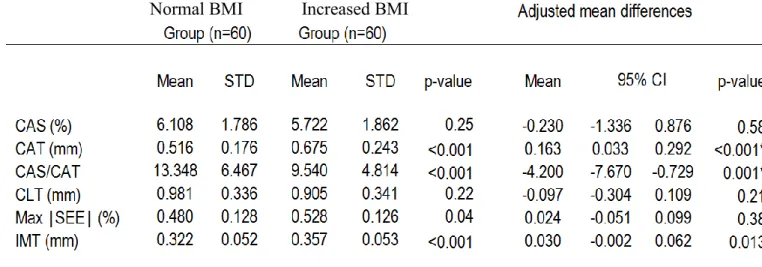
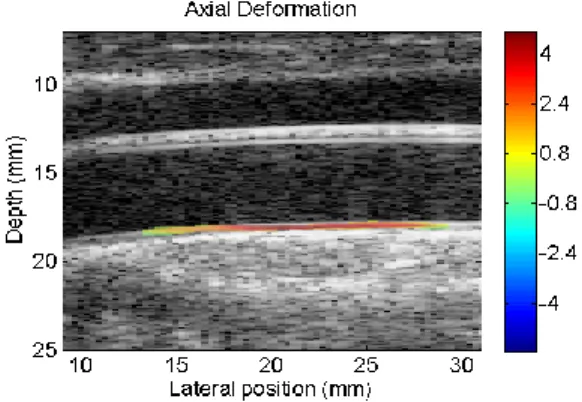
The results of the ANOVA multiple comparison analysis which included all the variables and primary and secondary outcomes are shown in table III with the mean adjusted difference of the outcomes in both groups. Adjustment was made for age, sex, Tanner stage, blood pressure and LDL. The values of strain, translation and shear motion are given as an average value over the whole segmented wall region. Figure 4 shows an example of a segmented vessel with the computation of the axial strain map in color. Figure 5 shows elastography curves for parameters tested in this report. The results show no difference in CAS between the two groups and a significantly lower CAT in the normal BMI group. The values were as follows: CAS=6.10+/-1.78% for the normal BMI and 5.72+/-1.86% for the increased BMI group (p=0.58) and CAT=0.51+/-0.17 mm for the normal BMI group and 0.67+/-0.24 mm for the increased BMI group (p<0.001). The ratio CAS/CAT was higher in the normal BMI group (mean=13.34±6.46%/mm) compared to the increased BMI group (mean=9.54±4.81%/mm) (p<0.001). CLT and Max |SSE| are not significantly different between both groups. CLT was similar between both groups irrespective of the other confounders. However, we found a significantly lower Max |SSE| in the normal BMI group without adjusting for age and blood pressure (0.48% and 0.53%, for normal and increased BMI groups respectively (p=0.04)).
20
There was a significantly lower IMT in the normal BMI group (IMT=0.32 mm) versus the increased BMI group (IMT=0.35 mm) with an adjusted mean difference of 0.03 (95% confidence interval (CI):0.007-0.054), p=0.013). There is no correlation between IMT and CAT in both groups. Pearson correlation coefficient r=0.17 (p=0.17) in the normal BMI group and r=0.08 (p=0.50) in the increased BMI group.
Since CAT and IMT were significantly different between both groups, we did a linear regression for both variables and plotted the result against increased BMI in a ROC curve. It showed a sensitivity of around 73.6% (figure 6).
2.5 Discussion
There are differences in CAT and IMT of the common carotid artery of children with normal compared to increased BMI irrespective of age, sex, blood pressure and Tanner stage. In adults, NIVE showed decreased elasticity in men compared to women and decreased elasticity with aging. The reliability and reproducibility of NIVE has been proven in adults [16]. NIVE has not been studied in children.
The relationship between obesity and mechanical properties of the carotid artery is complex. Several studies in the literature have been done to evaluate the relationship of arterial stiffness and BMI. Recent meta-analysis showed moderate relationship between obesity and decreased arterial stiffness as measured by central PWV [21] and strong
relationship for both PWV and β stiffness index [22]. In agreement with these other methods, NIVE demonstrated a difference between children with normal BMI and increased BMI. In fact, NIVE could be a potential surrogate for PWV since it analyzes sub-segments of the arterial wall movement itself.
Another factor affecting the mechanical properties of the carotid wall is blood pressure. NIVE stems from the fact that the arterial wall deforms proportionally to the pulse pressure
21
during systole and diastole due to the cycling driving force inducing wall compression and dilatation. Intuitively, with an increase in blood pressure, the strain magnitude should increase. The maximum axial strain has been shown in adults to assess plaque stability [23]. We found a significantly lower Max |SSE| in the normal BMI group without adjusting for age and blood pressure. This difference did not prevail after adjusting for either blood pressure or age. This finding is not surprising, given the central role of blood pressure in shear strain generation. It is in agreement with the factors that lead to the recommendations for standardization of the assessment of subclinical atherosclerosis in children namely taking into account blood pressure in the interpretation of elasticity and IMT values [24]. Children with increased BMI in the current cohort had higher systolic and diastolic blood pressures. After controlling for blood pressure and using Bonferroni correction, CAT remained significantly higher in children with increased BMI (table III).
CAT reflects the range of variation within a cardiac cycle of the axial translation of the artery as the lumen dilates and relaxes, and the vessel wall compresses and dilates. Since CAT is higher in the increased BMI group independently of blood pressure, we presume that the artery is stiffer and hence compresses less but translates more. The fact that CAS did not differ between groups may be related to the compensatory higher axial motion of the stiffer wall. In other words, the stiffer the vessel wall the greater the translation would be. The ratio
CAS/CAT (strain per unit translation) was higher in the normal BMI group but its statistical significance is questionable since it depends on CAT. The results thus indicate clear
differences in the mechanical properties of the vessel wall in children with increased BMI. This phenomenon was not explained by the difference in blood pressure.
Increased IMT is associated with obesity in children [25, 26, 27]. IMT measurement techniques available in the literature include B-mode ultrasound and RF echotracking-based ultrasound manually and using automated and semi-automated techniques. IMT obtained using the segmentation algorithms used in NIVE is based on RF and is an average value over the entire cardiac cycles and entire vessel segments. These algorithms include maximum likelihood and exploration selection iterative methods. Therefore, this gives IMT values based on RF probability distribution data defining image speckle. RF probability distribution IMT is
22
significantly higher in the increased BMI group. This is in contradistinction to Weberruß et al. who did not find a relationship between BMI and IMT using semi-automated B-mode
technique [28]. RF probability distribution IMT values are however lower when compared to RF echotracking techniques in the literature (IMT=0.32-0.35 mm) versus a mean of 0.4 mm for 15 year old boys according to Engelen et al. [29]. This could be attributed to the
mathematical calculation of IMT using these algorithms.
Sex, age and possibly Tanner stage influence IMT and arterial compliance [9]. The differences in CAT and IMT between both groups prevailed after adjusting for these confounders. NIVE could then be a one-step method to measure and follow both IMT and vascular biomechanics in children at risk. IMT and CAT are independent as there is no correlation between them.
The fact that the results are in agreement with other published studies using PWV in pediatrics is encouraging. However, the fact that the normal BMI group belongs to QUALITY study might introduce a bias since all children had an obese parent. Therefore, further
prospective studies are needed to test the validity and reproducibility of our results in children. Comparison with other prevailing vascular wall imaging modalities namely PWV needs to be done. Since there are many co-variables, a larger sample is required to evaluate CAS and Max |SSE| as other potential markers. RF probability distribution IMT should be compared to other techniques to validate its accuracy knowing that we did not use electrocardiogram (ECG) guided measurements nor different isonation angles [8]. We could not calculate inter- and intra-observer variability in this analysis.
2.6 Conclusion
Discernible differences in CAT and IMT are detectable when comparing children of normal and increased BMI. NIVE is a promising non-invasive technique of axial translation
23
and IMT calculation. This study shows that NIVE could be helpful at providing two radiologic subclinical markers of early atherosclerosis in children with risk factors.
2.7 References
1) McGill HC Jr, McMahan CA, Zieske AW et al. Association of Coronary Heart Disease Risk Factors with microscopic qualities of coronary atherosclerosis in youth.
Circulation 2000; 102(4):374-379.
2) Anderson TJ. Arterial stiffness or endothelial dysfunction as a surrogate marker of vascular risk. Can J Cardiol 2006 Feb;22 Suppl. B:72B-80B.
3) McGill HC Jr, McMahan CA, Zieske AW et al. Associations of coronary heart disease risk factors with the intermediate lesion of atherosclerosis in youth. The Pathobiological Determinants of Atherosclerosis in Youth (PDAY) Research Group. Arterioscler
Thromb Vasc Biol 2000; 20(8):1998-2004.
4) Baker JL, Olsen LW, Sorensen TI. Childhood body-mass index and the risk of coronary heart disease in adulthood. N Engl J Med 2007;357(23):2329-2337.
5) Srinivasan SR, Bao W, Wattigney WA, Berenson GS. Adolescent overweight is associated with adult overweight and related multiple cardiovascular risk factors: the Bogalusa Heart Study. Metabolism 1996;45(2):235-240.
6) Raitakari OT, Juonala M, Rönnemaa T et al. Cohort profile: the cardiovascular risk in Young Finns Study. Int J Epidemiol 2008;37(6):1220-1226.
7) Silva LR, Stefanello JM, Pizzi J, Timossi LS, Leite N. Atherosclerosis subclinical and inflammatory markers in obese and nonobese children and adolescents. Rev Bras Epidemiol 2012;15(4):804-816.
24
8) Selamet Tierney ES, Gauvreau K, Jaff MR et al. Carotid artery intima-media thickness measurements in the youth: reproducibility and technical considerations. J Am Soc Echocardiogr 2015;28(3):309-316.
9) Dalla Pozza R, Ehringer-Schetitska D, Fritsch P et al. Intima media thickness measurement in children: A statement from the Association for European Paediatric Cardiology (AEPC) Working Group on Cardiovascular Prevention endorsed by the Association for European Paediatric Cardiology. Atherosclerosis 2015; 238(2):380-387. 10) Touboul PJ, Hennerici MG, Meairs S, Adams H, Amarenco P, Bornstein N, Csiba L,
Desvarieux M, Ebrahim S, Hernandez Hernandez R, Jaff M, Kownator S, Naqvi T, Prati P, Rundek T, Sitzer M, Schminke U, Tardif JC, Taylor A, Vicaut E, Woo KS. Mannheim carotid intima-media thickness and plaque consensus (2004-2006-2011): An update on behalf of the advisory board of the 3rd and 4th watching the risk symposium 13th and 15th European Stroke Conferences, Mannheim, Germany, 2004, and Brussels, Belgium, 2011. Cerebrovasc Dis. 2012;34(4):290-6.
11) De Korte CL, Hansen HH, van der Steen AF. Vascular ultrasound for atherosclerosis imaging. Interface Focus 2011; 1(4):565-575.
12) Lim HS, Lip GY. Arterial stiffness: beyond pulse wave velocity and its measurement. J Hum Hypertens 2008;22(10):656-658.
13) Reusz GS, Cseprekal O, Temmar M et al. Reference values of pulse wave velocity in healthy children and teenagers. Hypertension 2010;56(2):217-224.
14) Mercure E, Cloutier G, Schmitt C, Maurice RL. Performance evaluation of different implementations of the Lagrangian speckle model estimator for non-invasive vascular ultrasound elastography. Med Phys 2008;35(7):3116-3126
15) Mercure E, Destrempes F, Roy Cardinal MH et al. A local angle compensation method based on kinematics constraints for non-invasive vascular axial strain computations on human carotid arteries. Comput Med Imaging Graph 2014; 38(2):123-136.
25
16) Maurice RL, Soulez G, Giroux MF, Cloutier G. Non-invasive vascular elastography for carotid artery characterization on subjects without previous history of atherosclerosis. Med Phys 2008; 35(8):3436-3443.
17) Lambert M, Van Hulst A, O’Loughlin J et al. Cohort profile: The Quebec adipose and lifestyle investigation in youth cohort. Int J Epidemiol 2012; 41(6):1533-1544.
18) Paradis G, Lambert M, O'Loughlin J et al. The Québec Child and Adolescent Health and Social Survey: design and methods of a cardiovascular risk factor survey for youth. Can J Cardiol 2003; 19(5):523-531.
19) Destrempes F, Meunier J, Giroux MF, Soulez G, Cloutier G. Segmentation in ultrasonic B-mode images of healthy carotid arteries using mixtures of Nakagami distributions and stochastic optimization. IEEE Trans Med Imaging 2009; 28(2):215-229.
20) Destrempes F, Meunier J, Giroux MF, Soulez G, Cloutier G. Segmentation of plaques in sequences of ultrasonic B-mode images of carotid arteries based on motion
estimation and a Bayesian model. IEEE Trans Biomed Eng 2011; 58(8):2202-2211. 21) Hudson LD, Rapala A, Khan T, Williams B, Viner RM. Evidence for contemporary
arterial stiffening in obese children and adolescents using pulse wave velocity: A systematic review and meta-analysis. Atherosclerosis 2015 Aug; 241(2):376-86. 22) Cote AT, Phillips AA, Harris KC et al. Obesity and arterial stiffness in children:
systematic review and meta-analysis. Arterioscler Thromb Vasc Biol 2015; 35(4):1038-1044.
23) Naim C, Cloutier G, Mercure E et al. Characterisation of carotid plaques with ultrasound elastography: feasibility and correlation with high-resolution magnetic resonance imaging. Eur Radiol. 2013;23(7):2030-2041.
24) Urbina EM, Williams RV, Alpert BS, et al. Non-invasive assessment of subclinical atherosclerosis in children and adolescents : recommendations for standard assessment for clinical research: a scientific statement from the American Heart Association Hypertension 2009 Nov;54(5):919-50.
26
25) Ozcetin M, Celikyay ZR, Celik A, Yilmaz R, Yerli Y, Erkorkmaz U. The importance of carotid artery stiffness and increased intima-media thickness in obese children. S Afr Med J 2012 Mar 8;102(5):295-9.
26) Johnson HM, Douglas PS, Srinivasan SR et al. Predictors of carotid intima-media thickness progression in young adults: the Bogalusa Heart Study. Stroke 2007; 38(3):900-905.
27) Lorenz MW, Markus HS, Bots ML, Rosvall M, Sitzer M. Prediction of clinical
cardiovascular events with carotid intima-media thickness: a systemic review and meta-analysis. Circulation 2007 Jan 30;115(4):459-67.
28) Weberruß H, Pirzer R, Böhm B, Dalla Pozza R, Netz H, Oberhoffer R. Intima-media thickness and arterial function in obese and non-obese children. BMC Obes 2016 Jan 9;3:2.
29) Engelen L, Ferreira I, Stehouwer CD, Boutouyrie P, Laurent S; Reference Values for Arterial Measurements Collaboration. Reference intervals for common carotid intima-media thickness measured with echotracking: relation with risk factors. Eur Heart J 2013 Aug;34(30):2368-80.
27 Tableau I.
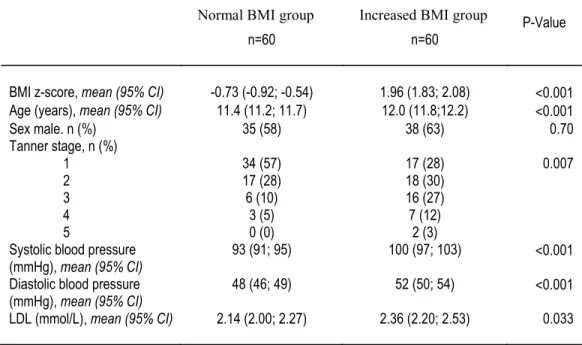
Table 1: Group comparison of BMI z- score, age, sex, Tanner stage, blood pressure and LDL
Non Obese Group
n=60 Overweight/Obese Group n=60 P-Value BMI z-score, mean (95% CI) -0.73 (-0.92; -0.54) 1.96 (1.83; 2.08) <0.001 Age (years), mean (95% CI) 11.4 (11.2; 11.7) 12.0 (11.8;12.2) <0.001
Sex male. n (%) 35 (58) 38 (63) 0.70 Tanner stage, n (%) 1 2 3 4 5 34 (57) 17 (28) 6 (10) 3 (5) 0 (0) 17 (28) 18 (30) 16 (27) 7 (12) 2 (3) 0.007
Systolic blood pressure (mmHg), mean (95% CI)
93 (91; 95) 100 (97; 103) <0.001 Diastolic blood pressure
(mmHg), mean (95% CI) 48 (46; 49) 52 (50; 54) <0.001 LDL (mmol/L), mean (95% CI) 2.14 (2.00; 2.27) 2.36 (2.20; 2.53) 0.033
Threshold for statistical significance was set at p<0.05. BMI: Body Mass Index
28
Tableau II. Pearson correlation coefficients and p values for blood pressure and outcomes in both groups of children with normal and increased BMI
CAS CAT Max |SSE| IMT probability
distribution Normal
BMI Increased BMI Normal BMI Increased BMI Normal BMI Increased BMI Normal BMI Increased BMI Systolic blood pressure r = 0.01 p = 0.94 r = 0.11 p = 0.40 r = 0.05 p = 0.66 r = 0.112 p = 0.39 r = 0.31 p = 0.013 r = 0.11 p = 0.37 r = 0.150 p = 0.25 r = 0.01 p = 0.95 Diastolic blood pressure r = 0.06 p = 0.63 r = -0.16 p = 0.20 r = -0.17 p = 0.19 r = 0.097 p = 0.45 r = 0.14 p = 0.25 r = 0.01 p = 0.90 r = 0.120 p = 0.35 r = 0.01 p = 0.94 Pulse pressure r = -0.04 p = 0.76 r = 0.24 p = 0.06 r = 0.20 p = 0.12 r = 0.174 p = 0.18 r = 0.25 p = 0.045 r = -0.01 p = 0.88 r = 0.082 p = 0.52 r = 0.01 p = 0.93
29
Tableau III. Adjusted and unadjusted ANOVA analysis comparing the six outcomes between the two groups of children with normal and increased BMI
30
Figure 3. Flow chart of visit 2 of the QUALITY study among which the 120 children were randomly selected.
Figure 4. Static ultrasound image obtained from the RF video sequence. Ultrasound beam impacted from above. The far carotid wall was utilized for analysis. The axial deformation is graded by the different colors; red being positive, i.e. dilation during diastole, and blue being negative, indicating compression during systole. The lateral position reflects the wave of movement along the long axis of the vessel secondary to
31 Figure 5.
A- Graph showing axial strain curves provided by the spatially averaged strain within the segmented area of the carotid artery from every elastogram during systole and diastole. Four cardiac cycles are displayed in this example. The green curve represents the instantaneous axial strain computed between two successive RF images, whereas the blue curve is the cumulated strain. The parameter CAS indicates the magnitude of the cumulated strain averaged over all cycles. A negative strain indicates vascular tissue compression and hence luminal enlargement (systole), and a positive value corresponds to vascular tissue relaxation and hence luminal diameter reduction (diastole). B- Graph of the instantaneous and cumulated axial translation or displacement of the vessel wall. The parameter CAT corresponds to the magnitude of the cumulated translation
32 A
B
33
Figure 6. ROC graph of logistic regression analysis of both CAT and IMT plotted against increased BMI as outcome. Sensitivity was calculated at 73.6% to discern children with normal BMI from those with increased BMI.
34
I am the main author of the following article entitled Carotid artery intima-media thickness measurements in children with normal and increased BMI: A comparison of three techniques. I did the literature review, data collection, statistics, tables and figures. Dr. Josée Dubois and Dr. Gilles Soulez were implicated in the study design. Dr. Mélanie Henderson, Guy Cloutier and Chantale Lapierre reviewed the manuscript.
35
Chapter 3: Carotid artery intima-media thickness
measurement in children with normal and increased BMI:
A comparison of three techniques
Ramy El Jalbout1, Guy Cloutier2, Mélanie Henderson3, Chantale Lapierre1, Gilles Soulez4, Josée Dubois1
1 University of Montreal, Department of Radiology, Sainte-Justine University Health Center, Montreal, Quebec, Canada
2 Laboratory of biorheology and Medical Ultrasonics, University of Montreal Hospital Research Center (CRCHUM), Montreal, Quebec, Canada
3 University of Montreal, Department of Pediatrics, Sainte-Justine University Health Center, Montreal, Quebec, Canada
4 Department of Radiology, University of Montreal hospital (CHUM), Montreal, Quebec, Canada
Article to be submitted to Pediatric Radiology
3.1 Abstract
Background: Common carotid artery intima-media thickness (IMT) is a marker of subclinical
atherosclerosis. In children, increased IMT is associated with obesity and risk of cardiovascular events in adulthood.
Objective: To compare IMT measurements using B-mode ultrasound, radiofrequency (RF)
echotracking, and RF speckle probability distribution. Secondary objective: to compare IMT in children with normal body mass index (BMI) vs. increased BMI using the three techniques.
36
Materials and methods: We measured IMT in 120 children randomly selected from two
groups of a longitudinal cohort: normal BMI and increased BMI, defined by BMI ≥ 85th percentile for age and sex. We followed Mannheim recommendations, measuring the far wall of the common carotid artery. We used M'Ath-Std for automated B-mode imaging; M-line processing of RF signal amplitude for RF echotracking; and RF signal segmentation and averaging using probability distributions defining image speckle. Statistical analysis included t-tests and intra-class correlation coefficient (ICC).
Results: Children were 10-13 years old (mean 11.7); 61% were boys. The mean age was 11.4
years for the normal BMI group and 12 years for the increased BMI group. The normal BMI group included 58% boys and the increased BMI group 63% boys. Techniques were only weakly correlated: ICC 0.34 (95% confidence interval (CI): 0.27-0.39). Regardless of
technique, IMT was significantly higher in the increased BMI than normal BMI group. Mean differences between weight groups were: B-mode, 0.020 mm (95% CI: 0.002 to 0.037); RF echotracking, 0.031 mm (95% CI: 0.006 to 0.056); and RF speckle probability distribution, 0.035 mm (95% CI: 0.016 to 0.054).
Conclusion: Though techniques are not interchangeable, all showed increased IMT in
children with increased BMI. For patient follow-up and cohort comparisons, the same technique should be used throughout.
Keywords: Carotid artery, intima-media thickness, atherosclerosis, childhood obesity,
37
3.2 Introduction
Common carotid artery intima-media thickness (IMT) is a reliable marker of
subclinical atherosclerosis [1]. In children, increased IMT is associated with obesity and risk of cardiovascular events in adulthood [1, 2]. The use of IMT in risk stratification, however, is limited by two factors. The first is a lack of standardization in the acquisition and analysis of IMT measures. The second is a lack of reproducibility and validated age- and sex-specific normative values against which to compare patient results. The Association for European Paediatric Cardiology (AEPC) recognized the need for standardized normative data in its recommendations for the measurement, analysis and interpretation of IMT in children [3].
There are presently two main methods for measuring common carotid artery IMT: ultrasound B-mode images (manual, semi-automated, or automated) and radiofrequency (RF) multiple M-line analysis (using echotracking of RF amplitude). In adults, the two methods correlate well [4]. Automated B-mode imaging with dedicated software (M'Ath-Std) was validated for IMT measurement and showed excellent reproducibility in the PARC study [5]. In pediatrics, studies used either ultrasound [6] or echotracking [7]. To our knowledge, there are no studies comparing B-mode and RF in children and few published normative values using either technique [3, 6, 7]. B-mode ultrasound has nonetheless demonstrated increased IMT in obese children [8].
The primary objective of this study was therefore to compare common carotid artery IMT measurements in children, using B-mode ultrasound, RF echotracking, and segmentation of the vessel wall using RF speckle probability distribution. Our secondary objective was to compare IMT in children with normal body mass index (BMI) vs. increased BMI using each of the three techniques.
38
3.3 Materials and methods
3.3.1 Study design and patient population
This is a prospective study between 2005 and 2011. Among families who completed the second visit two to three years later, 120 children were chosen among two groups of normal and increased BMI from the QUebec Adipose and Lifestyle Investigation in Youth (QUALITY) cohort. Increased BMI is defined as ≥85th percentile for age and sex. QUALITY study is approved by the Ethics Review Board of the Sainte-Justine University Health Center and Quebec Heart and Lung Institute. Written informed consent was obtained from caregivers. QUALITY study aims at evaluating the natural history of obesity and cardiometabolic
consequences in children who have at least one obese parent defined as BMI>30 kg/m2. The other inclusion criteria were as follows: Caucasian, age between 8 and 10 years (at time of entry into the original cohort) and healthy. Exclusion criteria were as follows: mother of child pregnant or breastfeeding, families planning to leave the province, children with cognitive challenge, on restricted diet or taking anti-hypertensive medication or corticosteroids [9, 10].
3.3.2 Data analysis
Primary endpoints were IMT measured by B-mode, RF echotracking and RF speckle probability distribution. The independent variables include BMI, age and sex. All information was collected during the same visit. Weight was measured twice on an electronic scale to the nearest 0.1kg. Height was measured twice to the nearest 0.1 cm. BMI was calculated
according to the formula weight (kg)/height (m)2. We defined overweight and obesity according to the Centers for Disease Control age and sex adjusted z-score for weight and height.