Analysis of 22 Elements in Milk, Feed, and Water of Dairy Cow,
Goat, and Buffalo from Different Regions of China
Xuewei Zhou1,2&Xueyin Qu1,2&Shengguo Zhao1,2&Jiaqi Wang1,2&Songli Li1,2& Nan Zheng1,2
Received: 5 June 2016 / Accepted: 8 August 2016 / Published online: 22 August 2016 # Springer Science+Business Media New York 2016
Abstract The objectives of this study were to measure the concentrations of elements in raw milk by inductively coupled plasma-mass spectrometry (ICP-MS) and evaluate differences in element concentrations among animal species and regions of China. Furthermore, drinking water and feed samples were analyzed to investigate whether the element concentrations in raw milk are correlated with those in water and feed. All samples were analyzed by ICP-MS following microwave-assisted acid digestion. The mean recovery of the elements was 98.7 % from milk, 103.7 % from water, and 93.3 % from a certified reference material (cabbage). Principal component analysis results revealed that element concentrations differed among animal species and regions. Correlation analysis showed that trace elements Mn, Fe, Ni, Ga, Se, Sr, Cs, U in water and Co, Ni, Cu, Se, U in feed were significantly corre-lated with those in milk (p < 0.05). Toxic and potential toxic elements Cr, As, Cd, Tl, Pb in water and Al, Cr, As, Hg, Tl in feed were significantly correlated with those in milk (p < 0.05). Results of correlation analysis revealed that ele-ments in water and feed might contribute to the eleele-ments in milk.
Keywords Milk . Cow . Goat . Buffalo . Trace elements . ICP-MS
Introduction
Milk and milk products represent an important source of mac-ro and micmac-ronutrients, including minerals. Trace elements such as iron (Fe), zinc (Zn), copper (Cu), and selenium (Se) are essential in human metabolism, growth, and development [1], while toxic elements such as lead (Pb) and cadmium (Cd) induce mental retardation and cardiovascular diseases [2,3]. Therefore, element concentration in milk and milk products are indicative of their safety and nutritional value.
The concentrations of trace and toxic elements in raw cow milk vary significantly by region [4–6]. For example, Pb, Cd, and Cu concentrations are 47.45, 1.68, and 890.15μg/L, re-spectively, in raw milk from Croatia [7], and 5.23, 0.40, and 51.8 μg/L, respectively, in raw milk from Spain [8]. Additionally, element concentration in milk varies by animal species [3,9,10]. Najarnezhad et al. have studied the concen-tration of Pb and Cd in ewe and cow milk; the results showed that Pb and Cd in ewe milk were significantly higher than those in cow milk [10]. Lin Bo [11] reported that the concen-trations of Fe and Zn in buffalo milk were higher than those in cow milk.
The concentrations of elements in raw milk are also affected by animal forage, feed, and water [12–14]. Concentrations of health-beneficial elements, e.g., cobalt (Co), Fe, Zn, in milk are dependent on the animal species, feed, milk sample collection time, environmental condi-tions, and manufacturing processes [15, 16]. Arsenic (As) and Fe in cow milk are possibly related to a higher consumption of concentration feed [6]. Potortì et al. have reported that elements in donkey milk were related with
Xuewei Zhou and Xueyin Qu contributed equally to this work. * Nan Zheng
[email protected] Xuewei Zhou
1
Ministry of Agriculture Laboratory of Quality & Safety Risk Assessment for Dairy Products, Institute of Animal Science, Chinese Academy of Agricultural Sciences, Beijing 100193, People’s Republic of China
2 State Key Laboratory of Animal Nutrition, Institute of Animal
Science, Chinese Academy of Agricultural Sciences, Beijing 100193, People’s Republic of China DOI 10.1007/s12011-016-0819-8
those in feed and water [17]. Cu levels in milk are attrib-uted to feed Cu concentrations [18].
In China, cattle represents a vital part of the economy. Cattle breeding stock reached 14.9 million in 2012, con-tributing to approximately 38.75 million tonne of cow milk [19]. In 2014, the population of dairy goats was ap-proximately 1.2 million, and goat milk was the second most important type of milk in China [20]. Buffalo milk, which represents an important source of income in south-ern China, had a yield of approximately 33,000 t in Guangxi province in 2012 [21].
There is little information on the concentrations of trace, potentially toxic, and toxic elements in goat and buffalo milk in China. The correlations of elements content between milk and feed, drinking water are also little. Therefore, the objec-tives of this study were to measure the concentrations of ele-ments in raw milk by inductively coupled plasma-mass (ICP-MS) and evaluate differences in element concentrations among animal species and regions. Furthermore, drinking wa-ter and feed samples were analyzed to investigate whether the element concentrations in milk are correlated with those in drinking water and feed.
Materials and Methods
Instrumentation
Vanadium (V), manganese (Mn), Fe, Co, nickel (Ni), Cu, Zn, gallium (Ga), Se, rubidium (Rb), strontium (Sr), silver (Ag), caesium (Cs), barium (Ba), uranium (U), aluminum (Al), chromium (Cr), As, Cd, mercury (Hg), thallium (Tl), and Pb were measured by ICP-MS (7700x, Agilent, USA), which was equipped with a quadrupole hyperboloid, Scott double pass spray chamber, concentric nebulizer, and high matrix introduction (HMI) sample introduction system. A microwave dissolver (CEM Corporation, USA) with PTFE tubes was used for milk and feed sample digestion; the operating condi-tions of ICP-MS are presented in Table1. Vessels used in the digestion were previously immersed in 20 % HNO3(v/v) for at least 12 h and rinsed with ultrapure water.
Preparation of Standard Solutions
A mercury calibration solution was prepared from 10 mg/ L mercury standard solution (SPEX, USA), while the cal-ibration solutions of the other 21 elements were prepared from 10 mg/L multi-element stock standard solution (SPEX). An internal standard solution was an aqueous multi-element standard solution containing 100 mg/L of Li, Sc, Ge, Rh, In, Tb, Lu, and Bi (SPEX). The internal stock standard solution was further diluted and used to correct any fluctuations of the instrument due to the
matrix. Cabbage certified reference material (CRM) was obtained from the National Institute of Metrology (GBW10014, China). Nitric acid (65 %, Sigma, USA) and hydrogen peroxide (30 %, Merck, Germany) were used in sample digestion. To maintain the same percentage of acid in the samples, the calibration solutions were di-luted with 6 % (v/v) HNO3for milk, 10 % (v/v) HNO3for feed, and 1 % (v/v) HNO3for water.
Sample Collection and Digestion
A total of 299 samples were analyzed, including 100 milk samples (20 cow milk samples from Shandong, 20 cow milk samples from Shaanxi, 20 goat milk samples from Shandong, 20 goat milk samples from Shaanxi, and 20 buffalo milk samples from Guangxi), 100 feed samples, and 99 water samples (feed and water samples were col-lected from the same sites as the milk samples). Feed samples were total mixed ration (TMR) and collected from where the animal feeding. All samples were collected in April and July of 2014.
Milk and water samples were stored in 200 mL polypro-pylene bottles at −20 °C. Water samples were preserved by acidification with 2 mL HNO3. Feed samples were oven dried at 65 °C for 48 h and ground to a particle size of 1 mm.
Milk (1 mL) was digested with 3 mL HNO3(65 %) and 4 mL H2O2(30 %) in polytetrefluoethylene (PTFE) tubes. Feed (0.5 g) was first added with 1 mL of ultrapure water, then digested with 5 mL HNO3 (65 %) and 2 mL H2O2 (30 %). Water was mixed with 1 %v/v HNO3prior to ICP-MS analysis. Sample digestion was performed at room tem-perature in open vessels.
A MARS 6 microwave sample digestion system (MARS 6, CEM Corporation, USA) with a power of 1600 W was used
Table 1 Operating conditions and measurement parameters for the ICP-MS
Parameter
Nebulizer Concentric nebulizer Spray chamber Dual channel Scott type Mass analizator Quadruple
RF power 1550 W Ar gas flow rates
Plasma 15 L/min Auxiliary 1.10 L/min Lens voltage 12.2 V Scanning mode Peak hopping Dwell time 45 s Sample uptake rate 0.15 mL/min
for the digestion of milk and feed samples. The milk samples were digested according to the following program: (1) ramp time 5 min, temperature 90 °C, hold time 5 min; (2) ramp time 5 min, temperature 150 °C, hold time 10 min; and (3) ramp time 5 min, temperature 180 °C, hold time 20 min. The feed samples were digested according to the following program: (1) ramp time 5 min, temperature 90 °C, hold time 5 min; (2) ramp time 5 min, temperature 150 °C, hold time 10 min; and (3) ramp time 5 min, temperature 200 °C, hold time 20 min. Digested samples were allowed to cool to room temperature, transferred to polypropylene tubes (Corning, USA), and dilut-ed to 50 mL with ultrapure water. Blanks, devoid of samples, were subjected to similar digestion procedures.
Quality Assurance
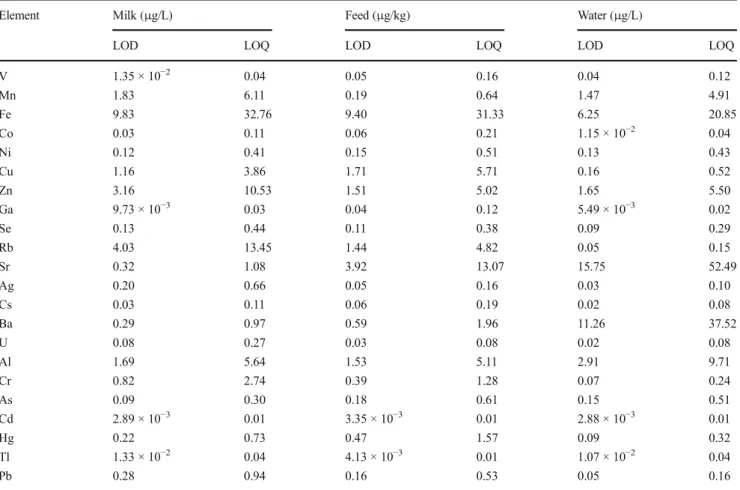
Limit of detection (LOD) and limit of quantification (LOQ) were calculated from three and 10 times, respectively, the standard deviation of the sample blank relative to the slope of the analytical curve. The digestion procedures were differ-ent for milk, water, and feed samples; therefore, LOD and LOQ were calculated separately. The digested milk, feed,
and water samples were used in the calculation of LOD and LOQ [22], as shown in Table2.
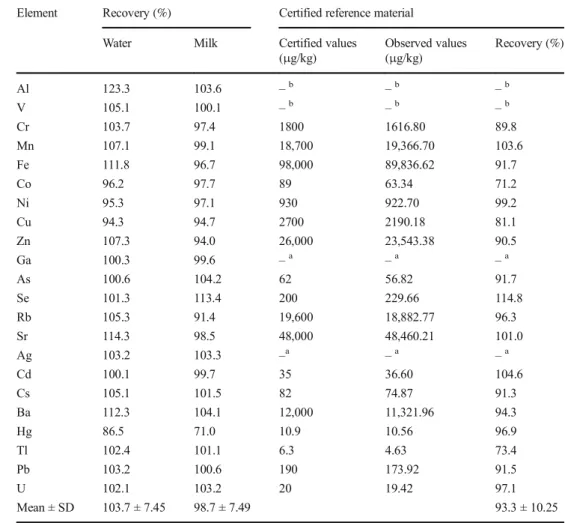
To assess the accuracy of the method, cabbage CRM and spiked samples were analyzed. The recovery of the elements from cabbage CRM and spiked samples is shown in Table3. The recovery of 22 elements in water and milk samples was 94.3–123.3 % and 91.4–113.4 %, respective-ly, except for Hg (86.5 % in water and 71.0 % in milk). For cabbage CRM, the recovery of 18 elements was 71.2– 114.8 %. The results of recovery accord with precision of quantitative methods [23].
Statistical Analysis
Element concentrations below LOD were replaced by half the value of the respective detection limits. The data were not normally distributed; therefore, non-parametric test was used in the analysis. Spearman rank correlation was used to determine the magnitude of the correlation among elements in milk, water, and feed samples. Data analyses were performed using SPSS 17.0 (IBM, USA). Statistical significance was set at p < 0.05. Principal component analysis (PCA) was performed with Canoco 5.0.
Table 2 Detection limits of 22 elements in milk, feed, and water
Element Milk (μg/L) Feed (μg/kg) Water (μg/L)
LOD LOQ LOD LOQ LOD LOQ
V 1.35 × 10⁻² 0.04 0.05 0.16 0.04 0.12 Mn 1.83 6.11 0.19 0.64 1.47 4.91 Fe 9.83 32.76 9.40 31.33 6.25 20.85 Co 0.03 0.11 0.06 0.21 1.15 × 10⁻² 0.04 Ni 0.12 0.41 0.15 0.51 0.13 0.43 Cu 1.16 3.86 1.71 5.71 0.16 0.52 Zn 3.16 10.53 1.51 5.02 1.65 5.50 Ga 9.73 × 10⁻³ 0.03 0.04 0.12 5.49 × 10⁻³ 0.02 Se 0.13 0.44 0.11 0.38 0.09 0.29 Rb 4.03 13.45 1.44 4.82 0.05 0.15 Sr 0.32 1.08 3.92 13.07 15.75 52.49 Ag 0.20 0.66 0.05 0.16 0.03 0.10 Cs 0.03 0.11 0.06 0.19 0.02 0.08 Ba 0.29 0.97 0.59 1.96 11.26 37.52 U 0.08 0.27 0.03 0.08 0.02 0.08 Al 1.69 5.64 1.53 5.11 2.91 9.71 Cr 0.82 2.74 0.39 1.28 0.07 0.24 As 0.09 0.30 0.18 0.61 0.15 0.51 Cd 2.89 × 10⁻³ 0.01 3.35 × 10⁻³ 0.01 2.88 × 10⁻³ 0.01 Hg 0.22 0.73 0.47 1.57 0.09 0.32 Tl 1.33 × 10⁻² 0.04 4.13 × 10⁻³ 0.01 1.07 × 10⁻² 0.04 Pb 0.28 0.94 0.16 0.53 0.05 0.16
Results and Discussion
Concentrations of Trace Elements in Milk Samples
Mn, Fe, Cu, Zn, Se, Rb, Sr, Cs, and Ba were present in all milk samples (positive rate 100.0 %). In buffalo milk, Ga had a positive rate of 100.0 % (Table4). V was present in 50–
100 % of all milk samples, and Ga and U were present in 50–100 % of cow and goat milk samples (Table 4). Other elements had lower positive rates: Ni, Co, and U were present in 10.0 to 50.0 % of all milk samples, goat milk, and buffalo milk, respectively. Ag had positive rate was lower than 10.0 % in all milk samples. As a result of the large percentage range, the mean values were affected by the high concentrations of the elements, which contributed to mean values that were higher than the median values.
Mean values were compared with those previously re-ported. Values above LOD were used for mean value cal-culation. Fe and Zn concentrations in our cow milk sam-ples were similar to those reported in cow milk from Northern Spain [6], but lower than those reported from
Turkey [24]. In this study, Zn concentrations in cow milk were similar to those in cow milk from Silesia [14] and higher than those from Pakistan [25]. Mostly, Cu, Co, and Mn concentrations were lower than those previously re-ported. In our study, Cu and Co concentrations were lower than those measured in cow milk from Northern Spain [6] and Turkey [14]. Similarly, Cu concentrations in cow milk from Croatia and Pakistan [7,25], and Mn concentrations in cow milk from South Africa [2] were higher than those obtained in our study (Table 4). On the other hand, Mn concentrations were comparable to those obtained in cow milk from Northern Spain [6].
The trace elements in goat milk were lower than those previously reported (Table4). Fe, Cu, and Zn concentrations in our goat milk samples were lower than those from Turkey [26] and Saudi Arabia [12]. Additionally, the concentrations of most elements in goat milk were higher than those in cow milk (Table4), as previously reported [27–29]. In the present study, Zn concentration in buffalo milk was five times higher than that in buffalo milk from India, while Fe concentrations were similar between the two studies [30].
Table 3 Spike recovery and quality control of certified reference material, cabbage
Element Recovery (%) Certified reference material Water Milk Certified values
(μg/kg) Observed values (μg/kg) Recovery (%) Al 123.3 103.6 –b –b –b V 105.1 100.1 –b –b –b Cr 103.7 97.4 1800 1616.80 89.8 Mn 107.1 99.1 18,700 19,366.70 103.6 Fe 111.8 96.7 98,000 89,836.62 91.7 Co 96.2 97.7 89 63.34 71.2 Ni 95.3 97.1 930 922.70 99.2 Cu 94.3 94.7 2700 2190.18 81.1 Zn 107.3 94.0 26,000 23,543.38 90.5 Ga 100.3 99.6 –a –a –a As 100.6 104.2 62 56.82 91.7 Se 101.3 113.4 200 229.66 114.8 Rb 105.3 91.4 19,600 18,882.77 96.3 Sr 114.3 98.5 48,000 48,460.21 101.0 Ag 103.2 103.3 –a –a –a Cd 100.1 99.7 35 36.60 104.6 Cs 105.1 101.5 82 74.87 91.3 Ba 112.3 104.1 12,000 11,321.96 94.3 Hg 86.5 71.0 10.9 10.56 96.9 Tl 102.4 101.1 6.3 4.63 73.4 Pb 103.2 100.6 190 173.92 91.5 U 102.1 103.2 20 19.42 97.1 Mean ± SD 103.7 ± 7.45 98.7 ± 7.49 93.3 ± 10.25
aCertified value not available b
Ta b le 4 C o n ce n tr at io no f2 2e le m en tsi n raw milk from dif ferent species El ement Cow (n = 40) Goat (n = 40) Buf falo (n =2 0 ) Pos iti ve ra te Me dian p75 Mea n Posi tive rat e M edian p75 Mean Positive rate Median p75 Mean V 7 5 .0 0 .1 20 .3 20 .2 98 0 .0 0 .2 10 .5 80 .3 97 5 .0 0 .1 50 .3 00 .2 6 Mn 100.0 20.58 27.10 23.35 100.0 33.78 40.26 36.32 100.0 56.30 61.29 51.4 9 Fe 100.0 230.15 329.80 352.08 100.0 361.15 525.1 9 462.96 100.0 497.60 567.47 421.33 C o 8 0 .0 0 .2 10 .3 00 .2 92 7 .5 0 .0 20 .0 40 .1 48 5 .0 0 .2 50 .5 30 .4 0 N i 2 0 .0 0 .0 60 .0 65 .7 65 0 .0 1 .7 55 .8 45 .6 01 5 .0 0 .0 60 .0 61 .0 5 Cu 100.0 25.42 32.08 32.02 100.0 81.52 113.30 84.67 100.0 32.1 1 61.89 48.4 2 Zn 100.0 3307.3 7 3623.15 3233.96 100.0 2983.43 3281.77 2953.93 100.0 4689.09 5504.16 4629.55 Ga 80.0 0.05 0.07 0.08 60.0 0.05 0.08 0.09 100.0 0.09 0.17 0.25 Se 100.0 19.50 23.53 20.72 100.0 17.67 22.23 17.34 100.0 19.59 24.69 20.2 1 Rb 100.0 1659.4 4 1861.72 1828.84 100.0 2670.54 3418.40 2982.71 100.0 2757.65 3848.80 2965.06 Sr 100.0 518.79 658.39 589.20 100.0 1242.59 1827.51 1357.31 100.0 374.35 552.25 409.82 Ag 2.5 0.10 0.10 0.23 7.5 0.10 0.10 0.45 5.0 0.10 0.10 0.55 Cs 100.0 6.57 7.61 6.74 100.0 7.04 9.87 8.43 100.0 26.15 33.73 26.7 8 Ba 100.0 34.47 57.88 60.94 100.0 92.28 132.0 9 98.06 100.0 184.30 278.53 209.55 U 8 0 .0 1 .0 31 .5 32 .0 77 5 .0 0 .7 91 .5 61 .6 04 5 .0 0 .0 40 .4 60 .6 9 Al 92.5 48.22 74.54 56.91 92.5 69.40 138.6 2 102.54 50.0 0.99 101.64 89.1 8 Cr 15.0 0.41 0.41 12.52 35.0 0.41 2.36 5.26 N D N C N C N C As 82.5 0.48 0.81 0.86 45.0 0.05 0.44 1.26 100.0 2.30 2.73 2.49 C d 3 2 .5 0 .0 00 .0 20 .0 72 7 .5 0 .0 00 .0 20 .0 5N D N C N C N C Hg 47. 5 0 .1 1 1 .7 4 5 .20 15.0 0 .1 1 0 .1 1 5 .0 7 15.0 0 .1 1 0 .1 1 0 .33 Tl 77.5 0.03 0.06 0.07 80.0 0.14 0.27 0.20 5.0 0.01 0.01 0.02 Pb 95.0 1.16 2.10 1.46 100.0 1.52 2.40 1.75 100.0 6.77 8.84 7.16 Cr and C d w ere not detected in buf falo milk. C on centrations expressed in m icrogram per liter ND not detected, NC not computable, n number o f samples
Concentrations of Trace Elements in Drinking Water and Feed Samples
The concentrations of trace elements in drinking water are presented in Table5. Buffalo drinking water had higher trace element concentrations than those of cows and goats. Buffalo drinking water samples were collected from different prov-ince; therefore, region might account for such differences [31,32]. The concentrations of V, Co, Ni, Cu, Ga, Se, Rb, and Cs in drinking water were lower than 10μg/L; Ag was not detected in any of the samples. The concentrations of Mn, Cu, and Zn in all drinking water samples were lower than those reported in northern Pakistan [32].
V, Mn, Fe, Co, Ni, Cu, Zn, Ga, Se, Rb, Sr, Cs, and Ba were present in 100 % of all feed samples. Both Ag and U had positive rates of 100 % in buffalo feed samples (Table 6). The concentrations of trace elements in feed samples were higher (tenfold) than those in drinking water (Tables5and6).
Concentrations of Toxic and Potential Toxic Elements in Raw Milk, Water, and Feed Samples
The concentrations of toxic and potentially toxic elements (Al, Cr, As, Cd, Hg, Pb, and Tl) in milk samples are presented in Table 4. In cow milk, Pb had the highest positive rate (95.0 %), followed by Al, As, and Tl. Cr, Cd, and Hg had positive rates less than 50.0 %. In goat milk, Pb had the highest rate, followed by Al and Tl, for Cr, Cd, As, and Hg had the positive rate less than 50 %. In buffalo milk, Pb and As were detected in all samples (100.0 %), Al, Hg, and Tl were detected in less than 50 % of the samples, and Cr and Cd were not detected.
The concentrations of toxic and potentially toxic elements in water and feed samples are presented in Tables5and6, respec-tively. Cr was detected in all drinking water samples, and Hg was not detected. Tl had the lowest positive rate in cow and goat drinking water. The positive rate of the other elements in cow and goat drinking water was 47.5–87.5 %. Al, Pb, and Cd were present in 100.0 % of buffalo water samples. For feed samples, Al, Cr, As, Cd, and Pb showed the highest positive rates. Tl had the highest positive rate in buffalo feed.
The results in Table4showed that Cd, Cr, and Pb concen-trations in our cow milk samples were lower than those re-ported in Pakistan and Turkey, whereas As concentrations in our cow milk samples were higher than that reported in Turkey [24,25,33]. There were higher Cd concentrations in our cow milk samples than those reported in cow milk from South Africa [2]. Additionally, the concentrations of Al, Cd, Cr, and Pb in goat milk were lower than those reported by Coni [15]. The concentrations of As in all drinking water samples were lower than those reported in Argentina [34]. Most of the toxic and potentially toxic elements detected in
our samples were lower than those from other regions. Concentrations of Pb, Cr, Hg, and As in all milk samples were below MRL established by China and the European Union (EU) [35]. Therefore, the raw milk samples used in this study had no health risks.
Difference Analysis by Principal Component Analysis
Figure1showed principal component 1 × principal compo-nent 2 plots, where loadings and scores were simultaneously represented. PCA allowed the reduction of 17 variables to four PCs, which explained 68.12 % of the total variance. The sam-ples were collected from different animal species and regions. Element concentrations in milk and drinking water were ana-lyzed by PCA to evaluate the effect of animal species and regions on raw milk element concentration.
The PCA results revealed that the concentrations of elements differed among animal species and regions (Fig. 1b), in agreement with the findings of Rahimi [3]. Similar results were obtained with drinking water. Element concentrations in water samples differed among regions. Element concentrations in buffalo water samples were dif-ferent to those in cow and goat water samples, with no significant differences between cow and goat water sam-ples (Fig. 1a). These results might be attributed to the location of sample collection. Cow and goat drinking wa-ter samples were collected from the same provinces, while buffalo water samples were collected from another distant region. The concentrations of elements in underground water from different regions are considerably different [32]. Differences in element concentrations in under-ground water might contribute to differences in element concentration in milk, water, and feed. PCA for feed sam-ples revealed no significant differences among animal spe-cies or regions (data not shown).
Correlation Analysis of Milk, Water, and Feed
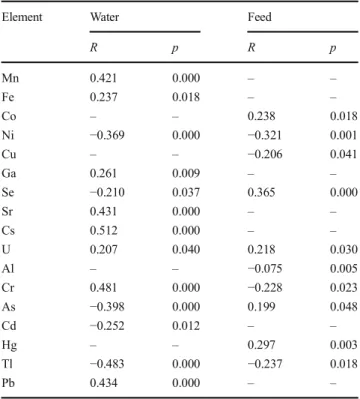
Trace elements Mn, Fe, Ni, Ga, Se, Sr, Cs, and U in milk were significantly correlated with those in drinking water, while Co, Ni, Cu, Se, and U were significantly correlated (p < 0.05) with those in feed (Table7). Similarly, toxic and potentially toxic elements in milk were significantly correlated (p < 0.05) with those in water and feed. Cr, As, Cd, Tl, and Pb in milk had significant correlations with those in drinking water, while Al, Cr, As, Hg, and Tl in milk samples were significantly correlated with those in feed samples (p < 0.05, Table7).
Therefore, elements in drinking water and feed might con-tribute to the elements in milk. This result was consistent with previously reported correlations between elemental mass frac-tions in milk and ingested feed and water [16]. Fe contamina-tion in drinking water may directly affect cow milk Fe
Ta b le 5 C o n ce n tr at io no f2 2e le m en tsi n d ri nking water from dif ferent species El ement C ow (n = 40) Goat (n = 39) Buf falo (n = 20) P o siti ve ra te M edi an p75 M ean P o siti ve ra te M edi an p75 M ea n Pos itive rat e M ed ia n p75 Me an V 100 .0 2.05 7.61 4.26 100 .0 3.86 7.67 5 .12 80.0 0.0 9 0.16 0.2 6 Mn 17.5 0.74 0.74 5.30 30.8 0.74 2.27 1 6.50 100.0 16.85 98.47 69.09 Fe 80.0 7 .24 28.58 93.98 79.5 1 1.12 25.61 5 4.45 95.0 18.93 53.55 37.95 Co 85.0 0.02 0.06 0.06 100 .0 0.07 0.12 0 .1 1 100.0 0.5 1 3.17 1.8 9 Ni 35.0 0.06 0.19 0.44 61.5 0.18 0.30 0 .69 100.0 0.7 2 3.1 1 1.7 8 Cu 40. 0 0 .0 8 0 .30 1 .1 9 71. 8 0 .2 4 0 .60 1 .81 95. 0 1 .0 4 2 .93 1 .8 2 Zn 65.0 2.44 4.64 9.54 71.8 2.59 6.88 1 7.07 95.0 7.4 4 10.52 8.5 2 Ga 27. 5 0 .0 0 0 .00 0 .0 1 23. 1 0 .0 0 0 .00 0 .02 90. 0 0 .0 2 0 .28 0 .6 2 Se 95.0 0.90 3.06 2.07 100 .0 0.99 3.40 4 .85 100.0 0.1 8 0.50 0.7 4 Rb 100 .0 0.43 0.54 1.02 100 .0 0.48 0.89 1 .29 100.0 4.9 8 8.53 6.1 5 Sr 100 .0 512 .63 1517.1 1 1 159.69 100 .0 813 .77 1428.4 4 1 096.84 45.0 7.8 7 18.15 24.73 Ag N D N C NC NC N D N C NC N C ND NC NC NC Cs 15. 0 0 .0 1 0 .01 0 .3 8 10. 3 0 .0 1 0 .01 0 .12 95. 0 0 .1 8 0 .55 0 .4 1 Ba 90.0 20.1 1 32.10 31.87 89.7 28.50 40.19 4 3.30 65.0 23.14 52.34 47.1 1 U 100 .0 2.50 18.96 9.24 100 .0 7.95 14.95 1 7.20 45.0 0.0 2 0.04 0.2 3 Al 57.5 3.18 5.36 9.61 61.5 3.69 7.24 2 0.17 100.0 17.75 45.93 139.88 Cr 100 .0 9.60 83.03 45.34 100 .0 1.55 28.54 2 2.63 100.0 0.2 5 0.40 0.4 5 As 77. 5 0 .5 2 2 .47 1 .7 6 87. 2 1 .0 3 2 .64 1 .65 70. 0 0 .2 7 0 .50 0 .6 9 Cd 55.0 0.00 0.01 0.01 76.9 0.01 0.01 0 .03 100.0 0.0 3 0.06 0.0 5 Hg N D N C NC NC N D N C NC N C ND NC NC NC Tl 7.5 0.01 0.01 0.02 2.6 0.01 0.01 0 .02 95.0 0.0 3 0.1 1 0.0 8 Pb 47.5 0.02 0.09 0.10 71.8 0.10 0.17 0 .24 100.0 0.4 8 1.23 2.9 3 One w ater samples o f goat is m is sed, the correspond ing m ilk an d feed sample was u sed w hen calculated m ean v alues, w hile dropped w hen correlation tes t. A g and H g w er e not dete cte d in wa te r sa m pl es. Conc entr at ions expr ess ed in m ic rogra m per lite r ND not detected, NC not computable, n number o f samples
Ta b le 6 Co ncent ra tion o f 2 2 el ements in fee d from d if fe re nt spe cie s El ement Cow (n = 40) Goat (n = 40) Bu ff alo (n = 20) Posi tive rat e M edi an p 75 Mea n Posit ive ra te Median p75 Mean P ositive rate Median p75 Mean V 100.0 1.00 1.45 1.26 100.0 1.01 1.97 1.37 100.0 0.29 0.9 9 0.97 Mn 100.0 1 0 2 .74 1 28.30 1 17.96 100.0 97. 39 139.82 1 15.77 100.0 123.15 176.7 7 124.37 Fe 100.0 5 7 3 .35 8 02.76 664.16 100.0 428. 06 791.66 687.38 100.0 387.67 574.8 0 624.28 Co 100.0 0.56 1.00 0.84 100.0 0.37 0.62 0.53 100.0 0.18 0.9 7 0.45 Ni 100.0 1.06 1.40 1.18 100.0 1.20 1.65 1.44 100.0 1.1 1 1.4 2 1.29 Cu 100.0 1 5.57 18.26 19.52 100.0 7.91 12.62 10.68 100.0 6.83 17.5 7 10.85 Zn 100.0 7 7.85 92.27 98.42 100.0 45.90 67.65 58.75 100.0 45.54 1 10.6 4 70.00 Ga 100.0 0.12 0.17 0.14 100.0 0.14 0.25 0.19 100.0 0.07 0.0 8 0.12 Se 100.0 0.33 0.42 1.50 100.0 0.18 0.33 0.25 100.0 0.12 0.3 6 0.21 Rb 100.0 8.98 10.75 9.16 100.0 7.98 10.45 9.01 100.0 18.48 30.9 8 21.04 Sr 100.0 3 1.57 41.73 34.28 100.0 16.43 55.57 38.60 100.0 9.29 12.4 9 10.46 Ag 50.0 0.00 0.00 0.01 77.5 0.00 0.01 0.01 100.0 0.00 0.0 1 0.01 Cs 100.0 0.12 0.14 0.12 100.0 0.1 1 0.17 0.12 100.0 0.09 0.1 2 0.13 Ba 100.0 1 1.22 14.14 10.99 100.0 8.59 26.95 15.84 100.0 8.63 13.2 2 13.53 U 97.5 0.05 0.1 1 0.08 82.5 0.03 0.12 0.10 100.0 0.02 0.0 5 0.03 Al 100.0 4 5 3 .19 6 63.61 492.00 100.0 474. 10 798.54 626.34 100.0 266.59 381.4 2 454.08 Cr 100.0 3.16 6.34 5.23 100.0 1.30 5.13 6.89 100.0 1.48 4.4 5 6.19 As 100.0 0.29 0.38 0.34 100.0 0.21 0.45 0.34 100.0 0.22 0.3 7 0.33 Cd 100.0 0.05 0.06 0.06 100.0 0.05 0.18 0.15 100.0 0.10 0.1 3 0.1 1 Hg 75.0 0 .01 0 .01 0 .01 85.0 0 .0 0 0 .0 1 0 .0 1 90. 0 0 .01 0 .0 1 0 .0 1 Tl 97.5 0.01 0.01 0.01 92.5 0.01 0.02 0.02 100.0 0.01 0.0 2 0.02 Pb 100.0 0.87 1.27 0.99 100.0 0.72 1.34 1.08 100.0 0.85 1.3 2 1.26 Concentrations express ed in m illigram per kilogram n number o f samp les
concentrations [36]. Deka [37] reported that Cr concentrations in milk is increased by adding Cr to the feed; however, As in drinking water showed a low biological transference to cow milk [34]. Compared to water, fewer elements in feed were significantly correlated with those in milk (Table7). The feed of dairy animals is more likely to be collected from different regions rather than locally produced. On the other hand, drink-ing water is usually local.
Conclusion
There were differences in element concentrations based on animal species and regions. Drinking water samples from dif-ferent regions had difdif-ferent element concentrations. On the other hand, there were no significant differences in element concentrations in feed samples among animal species or re-gions. Correlation analysis revealed that the concentrations of elements in water and feed might contribute to those in milk. From the correlation results, toxic and potentially toxic ele-ments in raw milk were associated with those in feed and drinking water, which emphasizes the importance of element control in the feed and drinking water of dairy animals. However, further longitudinal studies are requires to clarify the way that element in drinking water and feed secreted into milk, especially toxic elements.
Acknowledgments This study was supported by the Special Fund for Agro-scientific Research in the Public Interest (201403071), the Modern Agro-Industry Technology Research System of the PR China (nycytx-04-01), and the Agricultural Science and Technology Innovation Program (ASTIP-IAS12).
Compliance with Ethical Standards
Conflict of Interest All authors have approved the submission and none of the author declares any conflict of interest in the work performed or in the submission of the manuscript.
References
1. Stawarz R, Formicki G, Massányi P (2007) Daily fluctuations and distribution of xenobiotics, nutritional and biogenic elements in human milk in Southern Poland. Journal of Environmental Science and Health, Part A: Toxic/Hazardous Substances and Environmental Engineering 42(8):1169–1175
Fig. 1 The result of difference analysis by PCA for milk and water.SD Shandong province, SX Shaanxi province,GX Guangxi province.X-axis is principal component 1 andY-axis is principal component 2. a The result of PCA for water samples. b The result of PCA for milk samples. Variables used in the principal component analysis were V, Se, Ni, Ga, Rb, Sr, Ag, Cs, Ba, U, Al, Cr, As, Cd, Hg, Tl, and Pb in water and milk samples
Table 7 Correlation analysis of elements in milk with that in drinking water and feed
Element Water Feed
R p R p Mn 0.421 0.000 – – Fe 0.237 0.018 – – Co – – 0.238 0.018 Ni −0.369 0.000 −0.321 0.001 Cu – – −0.206 0.041 Ga 0.261 0.009 – – Se −0.210 0.037 0.365 0.000 Sr 0.431 0.000 – – Cs 0.512 0.000 – – U 0.207 0.040 0.218 0.030 Al – – −0.075 0.005 Cr 0.481 0.000 −0.228 0.023 As −0.398 0.000 0.199 0.048 Cd −0.252 0.012 – – Hg – – 0.297 0.003 Tl −0.483 0.000 −0.237 0.018 Pb 0.434 0.000 – – R correlation coefficient p statistically significant at p < 0.05
2. Ataro A, McCrindle RI, Botha BM, McCrindle CME, Ndibewu PP (2008) Quantification of trace elements in raw cow’s milk by in-ductively coupled plasma mass spectrometry (ICP-MS). Food Chem 111(1):243–248
3. Rahimi E (2013) Lead and cadmium concentrations in goat, cow, sheep, and buffalo milks from different regions of Iran. Food Chem 136(2):389–391
4. Król J, Litwiñczuk Z, Brodziak A, Kêdzierska-Matysek M (2012) Content of selected essential and potentially toxic trace elements in milk of cows maintained in Eastern Poland. Journal of Elemntology 17(4):597–608
5. Pilarczyk R, Wójcik J, Czerniak P, Sablik P, Pilarczyk B (2013) Concentrations of toxic heavy metals and trace elements in raw milk of Simmental and Holstein-Friesian cows from organic farm. Environ Monit Assess 185(10):8383–8392
6. Rey-Crespo F, Miranda M, López-Alonso M (2013) Essential trace and toxic element concentrations in organic and conventional milk in NW Spain. Food Chem Toxicol 55:513–518
7. Bilandžić N, Đokić M, Sedak M, Solomun B, Varenina I, Knežević Z, Benić M (2011) Trace element levels in raw milk from northern and southern regions of Croatia. Food Chem 127(1):63–66 8. Sola-Larrañaga C, Navarro-Blasco I (2009) Chemometric analysis
of minerals and trace elements in raw cow milk from the commu-nity of Navarra, Spain. Food Chem 112(1):189–196
9. Al-Awadi FM, Srikumar TS (2001) Trace elements and their distri-bution in protein fractions of camel milk in comparison to other commonly consumed milks. J Dairy Res 68:463–469
10. Najarnezhad V, Akbarabadi M (2013) Heavy metals in raw cow and ewe milk from north-east Iran. Food Additives & Contaminants Part B-Surveillance 6(3):158–162
11. Lin B, Li Y, Li L, Du HC, Tang Y, Nong HR, Zeng QK (2014) Analysis and comparation of minerals content in buffalo milk from different breeds. China Dairy Industry 42(3):15–17
12. Al-Wabel NA (2008) Mineral contents of milk of cattle, camels, goats and sheep in the central region of Saudi Arabia. Asian Journal of Biochemistry 3(6):373–375
13. Müller T, Feichtinger H, Berger H, Müller W (1996) Endemic tyro-lean infantile cirrhosis an ecogenetic disorder. Lancet 347:877–880 14. Dobrzański Z, Kołacz R, Górecka H, Chojnacka K, Bartkowiak A
(2005) The content of microelements and trace elements in raw milk from cows in the Silesian region. Pol J Environ Stud 14(5):685–689 15. Coni E, Bocca A, Coppolelli P, Caroli S, Cavallucci C, Marinucci MT (1996) Minor and trace element content in sheep and goat milk and dairy products. Food Chem 57(2):253–260
16. Herwig N, Stephan K, Panne U, Pritzkow W, Vogl J (2011) Multi-element screening in milk and feed by SF-ICP-MS. Food Chem 124(3):1223–1230
17. Potortì AG, Bella GD, Turco VL, Rando R, Dugo G (2013) Non-toxic and potentially Non-toxic elements in Italian donkey milk by ICP-MS and multivariate analysis. J Food Compos Anal 31(1):161–172 18. Havemose MS, Weisbjerg MR, Bredie WLP, Poulsen HD, Nielsen JH (2006) Oxidative stability of milk influenced by fatty acids, antioxidants, and Cu derived from feed. J Dairy Sci 89:1970–1980 19. China, D.A.O (2014) 2014 China dairy statistical summary. Dairy
Association of China, Beijing
20. Zhao S, Li Z, Dong Y, Gu X, Deng L, Guo C, Wang Y, Zhang S (2014) Strategy research on goats industry development and goat milk quality and safety condition in China. Quality and Safety of Agro-Products 6:12–15
21. Tang S (2014) Dairy buffalo industry developmental current situa-tion and considerasitua-tions in Guangxi. Journal of Guangxi Agriculture 29(1):50–55
22. D'Ilio S, Petrucci F, D'Amato M, Di Gregorio M, Senofonte O, Violante N (2008) Method validation for determination of arsenic, cadmium, chromium and lead in milk by means of dynamic reac-tion cell inductively coupled plasma mass spectrometry. Anal Chim Acta 624(1):59–67
23. EU. (2002). 2002/657/EC. Implementing Council Directive 96/23/ EC concerning the performance of analytical methods and the in-terpretation of results
24. Temiz H, Soylu A (2012) Heavy metal concentrations in raw milk collected from different regions of Samsun, Turkey. Int J Dairy Technol 65(4):516–522
25. Khan N, Jeong IS, Hwang IM, Kim JS, Choi SH, Nho EY, Choi JY, Park KS, Kim KS (2014) Analysis of minor and trace elements in milk and yogurts by inductively coupled plasma-mass spectrometry (ICP-MS). Food Chem 147:220–224
26. Güler Z (2007) Levels of 24 minerals in local goat milk, its strained yoghurt and salted yoghurt. Small Rumin Res 71:130–137 27. Jan FA, Ishaq M, Khan S, Shakirullah M, Asim SM, Ahmad I
(2011) Bioaccumulation of metals in human blood in industrially contaminated area. J Environ Sci 23(12):2069–2077
28. Khan ZI, Ashraf M, Hussain A, McDowell LR, Ashraf MY (2006) Concentrations of minerals in milk of sheep and goats grazing sim-ilar pastures in a semiarid region of Pakistan. Small Rumin Res 65(3):274–278
29. Nestares T, Díaz-Castro J, Alférez MJM, López-Aliaga I, Barrionuevo M, Campos MS (2008) Calcium-enriched goat milk, in comparison with similarly enriched cow milk, favours magne-sium bioavailability in rats with nutritional ferropenic anaemia. J Sci Food Agric 88(2):319–327
30. Shailaja M, Reddy YS, Kalakumar BD, Brinda SA, Manohar G, Kumar BD (2014) Lead and trace element levels in milk and blood of buffaloes (Bubalus bubalis) from Hyderabad, India. Bull Environ Contam Toxicol 92:698–702
31. Khan K, Khan H, Lu Y, Ihsanullah I, Nawab J, Khan S, Shah NS, Shamshad I, Maryam A (2014) Evaluation of toxicological risk of foodstuffs contaminated with heavy metals in Swat, Pakistan. Ecotoxicol Environ Saf 108:224–232
32. Khan K, Lu Y, Khan H, Zakir S, Ihsanullah, Khan S, Khan AA, Wei L, Wang T (2013) Health risks associated with heavy metals in the drinking water of Swat, north Pakistan. J Environ Sci 25(10): 2003–2013
33. Kazi TG, Jalbani N, Baig JA, Kandhro GA, Afridi HI, Arain MB, Jamali MK, Shah AQ (2009) Assessment of toxic metals in raw and processed milk samples using electrothermal atomic absorption spectrophotometer. Food Chem Toxicol 47:2163–2169
34. Mirna S, Horacio B, Rosa Repetti M (2010) Evaluation of the influence of arsenical livestock drinking waters on total arsenic levels in cow’s raw milk from Argentinean dairy farms. Food Chem 121(2):487–491
35. EC. (2002). European commission decision (EC). 2002/32/EC of the European parliament and of the council of 7 May 2002 on undesirable substances in animal feed: European Journal of Communication
36. Mann GR, Duncan SE, Knowlton KF, Dietrich AD, O'Keefe SF (2013) Effects of mineral content of bovine drinking water: does iron content affect milk quality? J Dairy Sci 96(12):7478–7489 37. Deka RS, Mani V, Kumar M, Shiwajirao ZS, Kaur H (2015)
Chromium supplements in the feed for lactating Murrah buffa-loes (Bubalus bubalis): influence on nutrient utilization, lacta-tion performance, and metabolic responses. Biol Trace Elem Res 168:362–371