Finance & Development March 2017 7
As populations
in richer nations
get older,
GDP growth
slows, support
costs rise, and
government
budgets feel
pressure
A
N aging population and slowerlabor force growth affect economies in many ways—the growth of GDP slows, working-age people pay more to support the elderly, and public budgets strain under the burden of the higher total cost of health and retirement programs for old people.
Yet an aging population may raise the amount of capital per worker, which would boost wages and output per hour worked (productivity) and reduce interest rates as higher wages lower the return on capital. Alternatively, population aging and slowing labor force growth could lead to secular stag-nation if firms are discouraged from investing abundant loanable funds.
Economic growth is slowing in advanced economies at least in part because the end of the baby boom led to a decline in popula-tion and labor force growth—despite immi-gration. Many empirical studies have found that GDP growth slows roughly one to one with declines in labor force and population growth—a disquieting prospect for both the United States and Europe.
In the United States, during the 40 years from 1975 to 2015, the 20- to 64-year-old population grew 1.24 percent a year, but is projected at only 0.29 percent for the next 40 years. That should lead to a corresponding decline in the growth
rate of GDP and aggregate consumption. Many advanced economies already have a declining working-age population—in Europe it will fall more than 20 percent between 2015 and 2055, with an attendant decline in GDP growth. Per capita output matters
But individual well-being depends not on aggregate, but on per capita, growth. Standard growth models predict that slower population growth also leads to rising output and wages per worker. The underlying ques-tion is whether this higher output per worker will translate into higher per capita income. That will depend on how much, as the popu-lation ages, increased productivity offsets the rise in the number of dependents (old and young) per worker.
To answer that question, we look more closely at how economic activity varies by age, drawing on national transfer accounts, which measure how people at various ages produce, consume, and save resources (NTAccounts.org; Lee and Mason 2011; United Nations 2013).
Children consume more than they pro-duce, and the same is true on average for the elderly. Consumption by children and to some degree by the old is covered by prime-age adults—those roughly 25 to 59—who
Ronald Lee and Andrew Mason
Cost of Aging
Card players in Naples, Italy.
8 Finance & Development March 2017
An aging population puts
budgetary pressure on society
as a whole.
produce more than they consume (see Chart 1). As a popu-lation ages, the proportion of workers declines, while the proportion of high-consuming elderly rises. In some coun-tries, such as Japan, Sweden, and the United States, relative consumption by old people is much higher than the average depicted in Chart 1; in others, such as Austria and Spain, the relative increase is much smaller. Greater consumption by the elderly may be partially offset by a smaller propor-tion of children in the populapropor-tion. But if fertility rates begin to recover from current low levels, the proportion of chil-dren and old people in the population may increase, boost-ing pressure on prime-age workers.
An aging population puts budgetary pressure on society as a whole because the number of workers declines relative to the number of consumers. This phenomenon is quantified by the support ratio of the total number of workers to consumers (which includes everyone—young, prime age, and elderly).
The lower the support ratio, the fewer workers there are to finance consumers, so either consumption must be reduced or labor supply increased—for example, through later retire-ment. Between 2015 and 2050 the support ratio will drop 0.26 percent a year in the United States, 0.40 percent in other high-income nations, and 0.82 percent in China (see Chart 2). This means that by 2050, unless the labor supply increases, consumption must drop by 25 percent in China, 9 percent in the United States, and 13 percent in other high-income countries. The age patterns of consumption and earning, like those shown in Chart 1, will have to be adjusted to accommodate new demographic realities.
Paying for elderly consumption
The elderly pay for consumption in a variety of ways. Besides what they may earn from continuing to work, older consumers rely in part on their assets—including farms and businesses, housing, and savings and investments. Another part comes from the government in the form of cash such as pensions and in-kind public transfers such as health care and long-term care. These public transfers are paid for by taxes, mostly those paid by the prime-age adult population. Some consump-tion may come through net support (support received minus support given) from younger family members. The elderly in east Asia get more support from their families than they give. But in much of the rest of Asia (including Japan and Korea), Europe, and the Americas, older people on average give more to their younger family members than they receive.
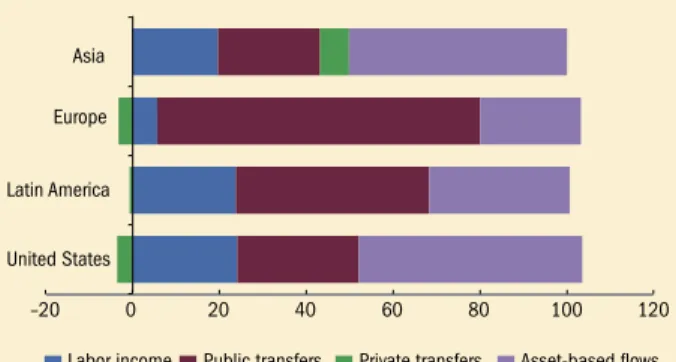
In general, the higher the proportion of consumption the elderly pay for themselves, the less cost falls on prime-age adults as higher taxes (see Chart 3). Europe stands out for its heavy reliance on public sector transfers to pay for elder con-sumption. When older people contribute little to their own consumption—either through asset income or continuing to work—it is a recipe for heavy costs as the population ages. The reverse is true in the United States, where people gener-ally retire later and rely more on their own assets in old age. Latin America is between the two, and Asia resembles the United States.
Public sector transfers for pensions, health care, and long-term care are a particular problem as populations age, because these payments, even after subtracting the portion funded by tax payments from the elderly, absorb a large por-tion of public budgets. Projecpor-tions indicate that typically these programs will be unsustainable unless taxes are raised or benefits reduced or both.
Fiscal support ratios are a way to look at the problem. They are constructed like support ratios, except they relate taxpay-ers to beneficiaries rather than worktaxpay-ers to consumtaxpay-ers. In the United States, the fiscal support ratio will drop 11 percent
Lee, corrected 1/27/2017
Chart 1
Earning and eating
Prime-age adults, ages 25 to 59, earn more than they consume, while the young and elderly do the opposite.
(average per capita value, index, 1 = average labor income of ages 30–49)
Source: Mason, Lee, and others, forthcoming.
Note: The data cover the 24 countries classified as high income by the World Bank. Labor income includes earnings, benefits, labor income of the self-employed, and an estimate of the value of labor supplied by unpaid family workers. Consumption is based on household expenditures imputed to individuals plus in-kind public transfers received by people at each age.
0 0.2 0.4 0.6 0.8 1.0 1.2 0 10 20 30 40 50 60 70 80 90 100 Labor income Consumption Age Lee, corrected 2/10/2017 Chart 2 Burden sharing
The number of workers supporting consumers (young, prime age, and elderly) will decline between now and 2050.
(support ratio, 2015 = 100)
Source: Mason, Lee, and others, forthcoming.
Note: Other high income = the 24 countries classified as high income by the World Bank, excluding the United States. The support ratio is the number of workers divided by the total number of consumers (that is, everyone).
60 70 80 90 100 110 120 1980 90 2000 10 20 30 40 50
Finance & Development March 2017 9 between 2010 and 2050 from population aging. This means
that to balance tax revenues and expenditures in the public budget (federal, state, and local combined) in 2050, tax rev-enues will have to be 11 percent higher or expenditures 11 percent lower, or some combination of the two, just to offset the increased costs from the aging population. For European countries, the corresponding number is between 14 percent and 28 percent, and for Japan it is 26 percent. These fig-ures refer to the total government budget, not just the social welfare component. Some governments are attempting the politically difficult task of restructuring their public trans-fer programs to address these issues—such as by raising the retirement age and linking the level of benefits more closely to the availability of tax revenues.
Productivity gains
If the overall saving rate remains the same while growth of the labor force slows, then the per capita amount of capital (such as machines, roads, and office equipment involved in the pro-duction of goods and services) would rise, boosting productiv-ity and wages and reducing interest rates. In the United States, the 1 percent a year decline in productivity during 2015–55 compared with 1975–2015 implies a substantial increase in capital per worker. In the United States and most other coun-tries, the elderly are net savers (Lee and Mason 2011) and hold more assets than younger adults. Longer lives and lower fertil-ity raise saving rates, reinforcing private saving.
But in some scenarios capital per worker may not increase. If population aging forces governments to borrow more to pay benefits, funds for private capital investment may be crowded out. Or if capital per worker does begin to rise and push down interest rates, adults may choose to save less, ultimately reduc-ing the increase in capital. A third possibility is that those with money to invest will seek higher returns in foreign
capi-tal markets, particularly in developing regions and emerging economies, where populations are younger and rates of return may be higher. In this case, domestic workers will not benefit through rising wages and higher productivity, although returns on the foreign investments would still raise national income. A long-term slowdown
Firms may choose to cut investment in the domestic econ-omy substantially, even as interest rates fall, if they think output and consumption growth will slow in response to a declining population and labor force, and perhaps lower total factor productivity (the portion of economic growth not explained by increases in capital and labor inputs and that reflects such underlying factors as technology). Should firms become pessimistic, even if central banks drive interest rates below zero, the economy could remain stagnant, with high unemployment for many years—a condition some call secu-lar stagnation (see “Sluggish Future” and “Whither Economic Growth?” both in this issue of F&D). Some economists inter-pret Japan’s virtually flat economic growth in recent decades and Europe’s failure to recover from the global financial crisis in these terms (Teulings and Baldwin 2014).
As populations age and grow more slowly, GDP and national income growth will most certainly slow down, but the effect on individuals—as measured by per capita income and consumption—may be quite different. A graying popula-tion will mean more old-age dependency, to the extent that these people do not support themselves by relying on assets or their own labor. But it may also bring more capital per worker and rising productivity and wages, particularly if government debt does not crowd out investment in capital (Lee 2016). Whether population aging is good or bad for the economy defies simple answers. The extent of the problem will depend on the severity of population aging and how well public policy adjusts to new demographic realities.
■
Ronald Lee is a Professor of the Graduate School of the Univer-sity of California, Berkeley, and Andrew Mason is a Profes-sor of Economics at the University of Hawaii, Manoa, and a Senior Fellow at the East-West Center.
References:
Lee, Ronald. 2016. “Macroeconomics, Aging and Growth.” In
Handbook of the Economics of Population Aging, edited by John Piggott
and Alan Woodland. Amsterdam: Elsevier, 59–118.
———, and Andrew Mason. 2011. Population Aging and the
Generational Economy: A Global Perspective. Cheltenham, United
Kingdom: Edward Elgar.
Mason, Andrew, Ronald Lee, and others. Forthcoming. “Support Ratios and Demographic Dividends: Estimates for the World.” United Nations Population Division Technical Report, New York.
Teulings, Coen, and Richard Baldwin, eds. 2014. Secular Stagnation:
Facts, Causes and Cures. VoxEU.org eBook, London: Centre for Economic
Policy Research.
United Nations. 2013. National Transfer Accounts Manual:
Measuring and Analysing the Generational Economy. Department of
Economic and Social Affairs, Population Division, New York.
Lee, corrected 2/9/2017
Chart 3
Old-age wallets
The sources of support for elderly consumption vary by region.
(percent of consumption)
Source: National Transfer Accounts: www.ntaccounts.org.
Note: Asia = Australia, Cambodia, China, India, Japan, Korea, Lao P.D.R., the Philippines, Taiwan Province of China, Thailand. Europe = Austria, Finland, France, Germany, Hungary, Italy, Slovenia, Spain, Sweden, the United Kingdom. Latin America = Brazil, Chile, Colombia, Costa Rica, Ecuador, El Salvador, Jamaica, Mexico, Uruguay. Labor income includes earnings, benefits, labor income of the self-employed, and an estimate of the value of labor supplied by unpaid family workers. Public and private transfers are net (transfers received minus transfers provided). Asset-based flows are defined as asset income minus interest expense minus saving.
Figure 1: Trust has declined sharply in the United States
–20 0 20 40 60 80 100 120
Labor income Public transfers Private transfers Asset-based flows
Asia
Asia Europe Latin America United States