Synergies Valuation in M&A
Practical Application in Financial Institutions
Acquisition BNP Paribas - Fortis Bank
Master Thesis HEC Paris
August 2017
Julien BOUSQUET
Student at HEC Paris – Major in Finance – Grande Ecole
Nicolas NAILLON – Thesis Supervisor
TABLE OF CONTENTS
EXECUTIVE SUMMARY ... 2
INTRODUCTION ... 4
PART 1 – LITERATURE OVERVIEW ... 5
1. Rationale of M&A deals – Introduction ... 5
2. Definition of Synergies ... 7
3. Breakdown of Synergies by Source Type ... 10
4. Negative Synergies or Cost to Achieve Synergies ... 15
5. Issues related to Synergies – Conclusion ... 17
PART 2 – VALUATION OF SYNERGIES ... 21
1. Methods of Valuation – Introduction ... 21
2. Synergies Estimation with the Multiples Approach ... 21
3. Synergy Valuation with the DCF Approach ... 23
4. Discussion around Value Creation – Conclusion ... 27
PART 3 – CASE STUDY ... 36
1. Presentation of the Case Study – Introduction ... 36
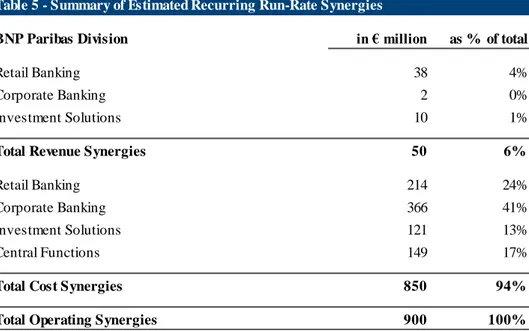
2. Synergies Plan ... 41
3. Synergies Estimation – Practical Application ... 46
4. Synergies Valuation – Practical Application ... 52
5. Discussions on Findings – Conclusion... 54
CONCLUSION ... 58
ACKNOLEWDGMENTS ... 59
APPENDICES... 60
Appendix A – Bibliography Book ... 60
EXECUTIVE SUMMARY
Presentation and problematic:
The objective of this research paper is to better understand the concept of synergies in the context of mergers and acquisitions. We start by the observation that synergies are often cited by corporates as both a primary reason for contemplating external growth as well as a major cause of M&A failure.
In such a context, we try to answer the problematic on how to properly value the synergies deriving from a merger or an acquisition. With equal importance, we intend to appreciate the link, or more probably the gap, between theory and practice around the concept of synergies.
Work and methodology:
The methodology adopted in the research paper combines review on financial literature, analysis on recent transactions, as well as interviews with professionals relevant to the topic of synergies. This methodology was shaped in order to comprehensively embrace the challenges mentioned above.
In order to address the different objectives, the research paper is divided in three distinct sections.
The first section provides a global overview about synergies on a theoretical standpoint: we identify the different sources of synergies and discuss the possible difficulties encountered by merging companies. The second section presents the possible methods to value synergies: we engage a technical investigation
about the role of synergies in value creation in the context of mergers and acquisitions.
The third section applies the theoretical findings to a practical case study: we apply the discussed topics on synergies on acquisition of Fortis Bank by BNP Paribas that occurred in 2008-2009.
Conclusion of the first section: Literature Overview
Companies contemplate M&A deals primarily for strategic growth opportunities, the synergies being a materialization of potential incremental cash flow deriving from expansionary offensive M&A
The control premium the buying company usually pay in acquisitions is only justified by the existence of potential synergies out of the combination with the target company
The potential synergies from the transaction can take two different forms for the buyer company: Operating: revenue enhancement & cost reduction
Financial: capital flexibility & tax efficiency
The operating synergies however are the only form of synergies pursued by the combined entity while financial synergies appear to be questionable and negligible
Synergies are one of the major cause for M&A failures because buying companies usually make mistakes when estimating the operating synergies from the combination
Conclusion of the second section: Valuation of Synergies
The first part of the valuation process is the synergy estimation. Buying companies will internally identify and estimate the possible synergies from a transaction involving different teams in the estimation process. The synergy estimation may also involve the computation of multiples in order to check the estimations with industry benchmarks using similar past transactions.
The second part of the valuation process involves the proper synergy valuation. Since synergies can be identified as streams of cash flows for the merged entity, the traditional DCF approach can be applied to value synergies but some specificities around the synergistic cash flows have to be considered (time horizon, implementation phasing, high uncertainty, line effect).
We also discussed the effects of synergies on value creation. Since acquisitions can be identified as investments, we showed that the merged entity will extract value creation from the deal only when the ROIC of the acquisition (return on investment) remains higher than the WACC of the target (risk associated with the investment). The shareholders of the merged group may experience short-term impacts on communicating around estimated and realized synergies, as markets positively reward transparency. However, value creation will be achievable only if the realized level of synergy is sufficient enough to justify the invested amount and risk associated with the acquisition.
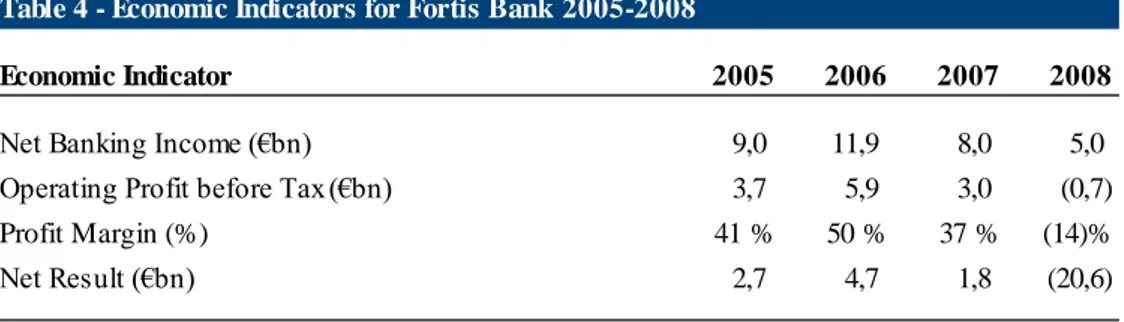
Conclusion of the third section: Case Study - BNP Paribas acquisition of Fortis Bank
Using the valuation methods described in the previous section, we value the synergies of the BNP Paribas Fortis Bank deal up to € 4.5 billion for a ROIC the acquisition of 23%.
This transaction was carried out in times of crisis and allowed BNP Paribas to fairly recover from the great financial crisis when looking at its current situation in Europe.
This transaction is a perfect illustration of the key implications for large acquisitions – some drivers may play against each other (growth opportunity vs. value creation - large restructuring / ring fencing vs. large synergies) and require the buyer to make important choices when such opportunities knock at the door. Tracking the synergies appears as a critical engagement for merging companies if they want to fully benefit
from the positive effects of identified synergies. We may conclude that the synergies valuation will be all the more important if two factors are reunited: the two merging companies have strong synergy opportunities (adjacencies) and the merged group implements a rigorous synergy tracking during the integration phase with a dedicated team (synergy team). This second requirement may be where synergies bring additional value creation in M&A deals.
INTRODUCTION
Synergy or an intriguing concept in the world of mergers and acquisitions. The word resonates steep when spoke out by a financial corporate or an investment banker. This concept itself arises both interest and curiosity for many buyers contemplating external growth. Synergies are indeed commonly cited by corporate investors as a major driver for takeovers but also point as a major pitfall for M&A deals.
Are synergies the carrot and the stick that will decide for transactions to succeed or to fail? Are synergies a valid justification for paying high price to acquire another adjacent company? More innocently, are synergies really accessible?
The main objective of this research paper is to better understand the myth around synergies. We try to answer the problematic on how to properly value the synergies deriving from a merger or an acquisition. With equal importance, we intend to appreciate the link – or probably the gap – between theory and practice around the concept of synergies.
The methodology adopted in the research paper combines review on financial literature, analysis on recent transactions, as well as interviews with professionals relevant to the topic of synergies. This methodology was shaped in order to comprehensively embrace the challenges mentioned above.
In order to address the different inquires raised in the first place as well as the objectives derived from these preliminary observations, the research paper is divided in three distinct sections.
The first part provides a global overview about synergies on a theoretical standpoint. In particular, we identify the different sources of synergies and discuss the importance and difficulty for merged entities to catch them. The second section represents the core of this master thesis by discussing the possible methods to value synergies. We engage a technical investigation about the role of synergies in value creation in the context of mergers and acquisitions.
The third and last chapter follows the step open by the previous developments with a practical case study. We apply the discussed topics on synergies on the BNP Paribas’ acquisition of Fortis Bank that occurred in 2008-2009. The practical application intents to reconcile, or more modestly, to highlight the existing discrepancies between theory and practice.
“Synergies is better than my way or your way. It is our way” Stephen Covey – The Seven Habits of Highly Effective People
PART 1 – LITERATURE OVERVIEW
The first part of the research paper explores the theoretical perspectives around synergies in M&A by providing an overview of financial literature. This first section is crucial before diving into technical valuation methods and applying the theoretical findings to a practical case study. The section appears as a comprehensive summary about synergies and is based on the review of finance books, company reports, academic papers, press articles as well as the completion of interviews with professionals.
1. Rationale of M&A deals – Introduction
Before getting into the detail of synergies, it seems important to understand the rationale of M&A deals and then infer how synergies derive from such strategic considerations. The objective of this introductive section is to understand why companies carry out mergers and acquisitions.
1.1 - Surveys on drivers of M&A
The two following graphs present the main drivers for M&A transactions according to top executives of different companies. The first graph relates a survey carried out in 2012 by BCG /UBS while the second graph summarizes a latest survey released in 2016 by KPMG;
Even if carried out in two different times, the two surveys show the same outcome: the main driver for M&A deals can be clustered under the terms of “growth opportunities”.
This idea of growth embraces the following elements:
expand product or service offering (59%) / enter into new lines of business (37%) enter new region (36%) / expand geographic reach (36%)
access new customers or distribution channels (35%) / expand customer base (37%)
Graph 1 – Drivers of M&A Transactions in 2012
Source – BCG / UBS – A Survey of European Companies on M&A Plans – 2012
8 9 12 13 15 19 28 35 36 59 0 10 20 30 40 50 60 70 Access to resources Restructure and refocus Respond to changing industry consolidation Increase earnings per share Balance business portfolio Access intellectual property, R&D, or brand Achieve cost economies Access new customers or distribution channels Enter new region Expand product or service offering
Growth Profitability Strategic
Graph 2 – Drivers of M&A Transactions in 2016
Source – KPMG – US Executives Survey on M&A – 2016
As a summary for the two surveys, M&A motivations can be clustered into three strategic categories, each corresponding to a strategic rationale for the two merging companies:
1. Growth Opportunity 2. Profitability Enhancement 3. Strategic Position
To add on this finding, investor presentations and meetings with investment bankers allow to say that there is first and foremost a strategic rationale under M&A deals. Two companies decide to merge because they have a strategic interest to do so. In particular, investor presentations appear very clear on this point, and start by highlighting the strategic rationale behind the deal, as mentioned by the following examples:
Bayer is acquiring Monsanto “to create a global leader in agriculture” (June 2016) Shire is merging with Baxalta “to create the global leader in rare diseases” (August 2015)
Tesla is acquiring Solarcity “to create the world leading sustainable energy company” (August 2016)
Such examples could be multiplied over and over but give an interesting intuition: if a large number of companies enter into M&A looking for growth, synergies should be a consequence of this offensive strategic move. Are there synergies for defensive M&A – that is merging in order not to be acquired or overwhelmed by competitors? Are there synergies for restructuring M&A – that is divest a business unity or a subsidiary to another company in order to refocus on core business or profitable business lines? For the sake of simplicity and consistence, we will consider in this research paper synergies only in the case of expansionary offensive M&A (that is ignoring defensive restructuring deals).
7 13 16 20 25 34 36 37 37 0 5 10 15 20 25 30 35 40
Defend against competition Responding to activist investors Acquiring additional elements of the supply chain Financial buyer looking for profitable operations Opportunistic - target becomes available Enhance intellectual property or acquire technology Expand geographic reach Expand customer base Enter into new lines of business
Growth Profitability Strategic
1.2 - Scope of the Research Paper
Before specifying and identifying the sources of synergies, we can now better define the scope of the research paper – taking for granted that M&A belongs to the category of external growth. Contrary to intrinsic growth, which derives from operational strategies implemented by corporates in order to internally maximize cash flow from invested capital, organic growth relates to the complex moves of acquiring, merging, and splitting assets, activities or companies.
From here, mergers and acquisitions belong to the category that we will call “expansionary M&A” which is nothing but the idea of maximizing cash flow from invested capital through external strategies. Divestitures (regrouping spin-off or carve-out) belong to the category of “restructuring M&A” whose idea is to maximize corporate clarity and focus on core business.
From this distinction, we would consider in this research paper only expansionary offensive M&A deals when speaking about synergies – that is mergers and acquisitions where growth is the main rationale lying behind the takeover. In the next section and in some efforts to define synergies, we would indeed assume now that synergies will derive from growth opportunities of M&A deals.
2. Definition of Synergies
2.1 - Definition
If synergy is a concept widely used in corporate finance – especially in M&A talks – the term originates from physics by referring to “the types of reactions that occur when two substances or factors combine to produce
a greater effect together than that which the sum of the two operating independently could account for”. From
this perspective, synergy can be naively considered as the natural phenomenon by which 1 + 1 > 2.
From the corporate finance point of view, synergy can be defined as “the positive incremental net gain
associated with the combination of two firms through a merger or an acquisition”. Therefore, synergy is the
positive difference between the value of the combined firm and the sum of values of the firms as separate entities. Otherwise stated, synergies refer to the fact that a corporate combination can be more valuable than the individual parts of the firms before the acquisition or the merger.
We would consider now that synergies relate to the financial concept under which the value of the combined companies – in expansionary offensive M&A deals – result to be greater than the sum of the separate individual firms.
2.2 - Synergies and Acquisition Premium
As we saw previously, if the main rationale for M&A is the strategic consideration of bringing “growth opportunities” under a combined entity, the synergies are one materialization, among others, deriving from this strategic outlook.
However, one common feature of acquisitions is the concept of acquisition premium or control premium. The acquisition premium is the excess amount a buyer will pay, as part of the acquisition price, for acquiring the target company in order to benefit from the right to control the company (and shape its future business orientations). The acquisition premium is not a free gift to the target shareholders but an anticipation of the future value of the takeover so that buyer shareholders will benefit from future higher earnings. This concept only applies in the case of acquisitions and remains absent when speaking about mergers.
The acquisition premium can be calculated as follow:
Acquisition Premium = Final Acquisition Price − Market Value of the Target (Eq. 1)
This is here where synergies are cited as the reason to justify acquisition premium: “the presence of acquisition
premium can only be justified by the fact that the new acquirer will get more value from the company than the former shareholders. The acquisition premium is only explained by the synergies that the new acquirer hopes to capture” [Pierre Vernimmen – Corporate Finance – Paragraph 35.47].
The buyer anticipates that the synergies performed under the combined entity largely offset the upfront payment of a premium to acquire the target company. This acquisition premium can be seen as an investment in which the buyer retrocedes one part of the value of the deal in order to receive future cash flows. Considered as an investment, the acquisition premium would turn to be a profitable investment for the acquirer only if:
Acquisition Premium < NPV of Synergies (Eq. 2)
In addition, the acquisition premium can bring some difficulties for the success of the deal. From a negotiating point of view, it can be inferred that the higher number of bidders to acquire a target, the higher the premium to be paid, so the higher amount of synergies left on the way. Therefore, sometimes the justification of the acquisition premium is not only determined by the expected level of synergies from the buyer but also the conditions of the deal (auction or market conditions) or the attractiveness of the target (scarce desired asset).
From a financial and strategic point of view, the acquisition premium may put some pressure under the management of the combined entity in a sense that the synergistic gains of the acquisition are very uncertain cash flows (uncertain amount or uncertain timeframe) and imply costs of implementation (negative cash flows) to achieve these synergies.
2.3 - Mathematical Approach
The synergies deriving from M&A, as positive incremental net gain, may generally lead to a positive “Net Acquisition Value” (NAV), given by the following equation:
NAV of Synergies = [VAB− (VA+ VB)] − [P + E] (Eq. 3)
Using the following notations:
𝑉𝐴𝐵 is the value of the combined firms A and B
𝑉𝐴 is the value of the standalone firm A
𝑉𝐵 is the value of the standalone firm B
𝑃 is the premium paid for the acquisition
𝐸 is the amount of expenses engaged in the acquisition process
If we focus now on the first part of the equation – which is the part from which synergies will source out – and assume that the “Net Present Value” (NPV) of synergies is the difference between the value of the combined firms and the sum of the two separate firms, we get the subsequent equation:
NPV of Synergies = VAB− (VA+ VB) (Eq. 4)
Considering the NPV formula of synergies in the previous equation, it seems possible to derive the potential sources of synergies by identifying the incremental cash flows induced from external growth operations. These incremental cash flows can be simply identified as the cash flows of the combined firms less the sum of the cash flows of the separate firms:
∆CF (Synergies) = CFAB− (CFA+ CFB) (Eq. 5)
Using the following notations:
𝐶𝐹𝐴𝐵 is the amount of cash flows of the combined firms A and B
𝐶𝐹𝐴 is the amount of cash flows of the standalone firm A
𝐶𝐹𝐵 is the amount of cash flows of the standalone firm B
If we apply now the standard definition of Free Cash Flows to determine the incremental cash flows from the combination considering the combined entity directly, we derive the following equations:
∆𝐶𝐹 = [∆𝐸𝐵𝐼𝑇 + ∆𝐷𝑒𝑝𝑟𝑒𝑐𝑖𝑎𝑡𝑖𝑜𝑛] − [∆𝑇𝑎𝑥 + ∆𝐶𝑎𝑝𝑖𝑡𝑎𝑙 𝑅𝑒𝑞𝑢𝑖𝑟𝑒𝑚𝑒𝑛𝑡𝑠] ∆𝐶𝐹 = [∆ 𝑂𝑝𝑒𝑟𝑎𝑡𝑖𝑛𝑔 𝑃𝑟𝑜𝑓𝑖𝑡] − [∆ 𝐹𝑖𝑛𝑎𝑛𝑐𝑖𝑎𝑙 𝐹𝑙𝑒𝑥𝑖𝑏𝑙𝑖𝑡𝑦]
∆𝐶𝐹 = [∆𝑅𝑒𝑣𝑒𝑛𝑢𝑒 + ∆𝐶𝑜𝑠𝑡] + [∆𝑇𝑎𝑥 + ∆𝐶𝑎𝑝𝑖𝑡𝑎𝑙]
From the last equation, we conclude that the incremental cash flows from the combined entity following the merger or the acquisition fall into two main sources: operating (higher revenues – lower costs) and financial (lower taxes – higher capital flexibility).
As an intermediary conclusion, we can identify two main sources of synergies: operating synergies and financial synergies. We will breakdown more precisely these two sources of synergies in the next section.
3. Breakdown of Synergies by Source Type
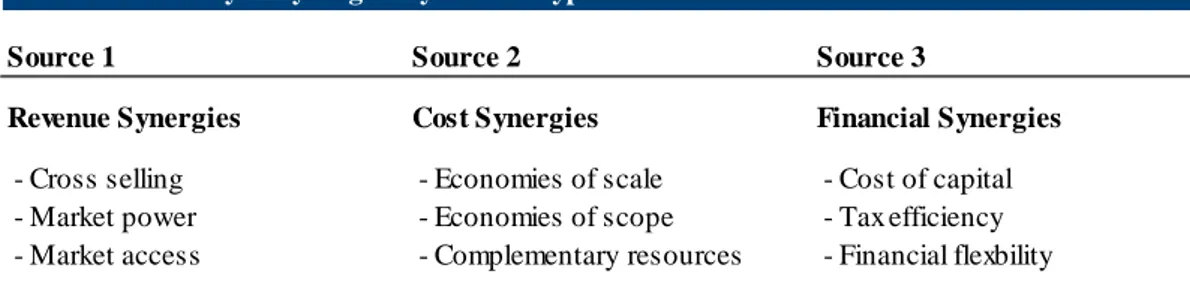
Synergies can be broken down according to their specific impact on cash flows, allowing to make the distinction between operating and financial synergies. The table below summarizes the synergies by source type that we will detail further in this section:
Source – Summary of Literature Review
3.1 - Operating Synergies
Operating synergies can be defined as “synergies that allow firms to increase their operating income from
existing assets, increase growth or both”. In other words, operating synergies are synergies that derive from
revenue enhancements or cost reductions induced by the merger or the acquisition.
3.1.1 - Cost Synergies
Cost synergies correspond to the incremental gains related to operating cost reduction of the combined entity compared to its previous forms as separate companies. Cost synergies are often associated with the disposal of redundant processes (manufacturing, employees, administration …). Even if mergers and acquisitions often involve staff reduction, it would be really reductive to confine cost synergies just as layoffs. As detailed below, cost synergies can take more precise forms and come from various sources.
Economies of scale: economies of scale is the cost advantage that results from the increased volume of production. The higher the quantity of goods produced, the lower the cost per unit of the production. Indeed, economies of scale allow to spread out fixed costs over a larger number of units produced. This is also known under the notion of “spreading overhead”, that is dividing total costs (fixed + variable costs) as the number of units produced increases. The economies of scale will be all the more efficient for capital intensive companies with large fixed costs.
Economies of scope: economies of scope is the cost advantage that results from the combination of supporting activities for a given range of products or services. The most common economies of scope that we think about is combining the sales, marketing, distribution activities to improve the selling process of the product or service line. The economies of scope will find most potential for companies likely to have a large range of products and services.
Table 1 - Summary of Synergies by Source Type
Source 1 Source 2 Source 3
Revenue Synergies Cost Synergies Financial Synergies
- Cross selling - Economies of scale - Cost of capital - Market power - Economies of scope - Tax efficiency - Market access - Complementary resources - Financial flexbility
Complementary resources: economies of scale and economies of scope are types of cost synergies that allow firms to naturally decrease their per-unit cost as their size induce better dispersion of total costs. On the contrary, complementary resources refer to the cost synergies that arise from improvements and efficiencies on the production process itself. Operational efficiencies will allow firms to reduce their variable costs thanks to the combination of resources (closing overlapping activities) or the mutualisation of expertise (transferring best-practices). We can break-down the complementary resources into different categories related to different functions (administrative, IT, management …).
Cost synergies may be seen as the main source of operating synergies since they can derive directly from removing overlapping functions of the two merged companies. They represent production improvements or organization rationalization as result of the combination of the two assets of the merged companies. 3.1.2 - Revenue Synergies
Revenue synergies correspond to the incremental gains related to operating earnings enhancement of the combined entity compared to its previous forms as separate companies. Revenue synergies can be viewed as all the growth opportunities – in terms of sales, market share, market access, and customer retention – unlocked by the merger of the two companies that were not available before. The details below intent to describe the main forms of revenue synergies.
Cross selling: cross-selling is the phenomenon by which a company can sell a complementary or additional product or service to an existing customer. The objectives of cross-selling are either to increase sales or to improve customer retention. Merging companies can largely benefit from cross-selling opportunities in different ways. They can build better product mix or design new product-service offering based on combining complementary sales resources or distinct marketing strengths. Cross-selling opportunities will be likely to arise for companies acting in complementary areas across the value chain or the business position.
Market power: market power relates to the fact that merging or acquiring competitors allow the company to reduce competition within the sector and thereby drive profitability. This is also known as “monopoly effect” such that reduced competition gives the leading companies a higher pricing power over customers. The market power will be all the more powerful as the two merging companies dilute competition or become bigger, under the condition that antitrust regulation do not restrict the takeover.
Market access: market access is the synergy form by which a company acquires a new opportunity or an option to generate future growth. This opportunity can take the form of entering a new geography, designing a new product, securing a new distribution network. For market access, the term “beach-head acquisition” is also used to account for an offensive move to establish an entry point for future growth opportunities (usually by acquiring minority interest in the target company).
Revenue synergies may come out from many potential sources after a deal is settled. They represent growth opportunities as result of the combination of the two merged companies. Potential revenue synergies vary widely across deals and industries and might be much more difficult to identify for companies.
3.1.3 – Timeline of Operating Synergies
If revenue and cost synergies fall into the same category of operating synergies, they widely differ regarding their possible materialization. Cost synergies inherently show up when the two companies start to implement the integration plant, while revenue synergies largely require more efforts from the management to arise.
The graph below eminently shows the operating synergies (revenue and cost) in a double scale by positioning the time required and the probability of success of achieving the synergies.
Graph 3 – Timeline of Operating Synergies
Source – Franck Ceddaha – Mergers, Acquisitions, Divestitures
Unsurprisingly, cost and revenue synergies hugely differ in terms of timing and likelihood. Cost synergies are positioned on the lower left part of the graph, meaning that the time required to achieve the cost synergies is short and the probability of success is strong. On the contrary, revenue synergies are located on the higher right part of the graph, indicating that the time required to achieve the revenue synergies is longer and the probability of success is limited. This major finding makes sense when considering that merging entities will quickly contemplate the benefits of removing overlapping functions while the design of cross-selling strategies will require more time and efforts.
3.2 - Financial Synergies
Financial synergies can be defined as “synergies whose payoff can take the form of either higher cash flows or a lower cost of capital (discount rate) or both”. They refer to the positive impact of a merger or an acquisition to the combined entity in terms of cash flows (lower taxes or lower capital requirements) or in terms of cost of capital (lower cost of capital).
Diving now into the sources of financial synergies, it can be inferred that financial synergies derive from increased size, increased diversity, better credit profile and market access to financing.
According to a report released by J.P. Morgan in 2009, financial synergies are turning relatively more important since the great financial crisis (2008) in terms of value creation. Financial synergies are becoming more valid in times of credit crisis, which implies restricted capital market access and higher cost of capital.
3.2.1 - Breakdown of Financial Synergies
Cost of capital: cost of capital (WACC) is the weighted average of the cost of equity (shareholders) and the after-tax cost of debt (debtholders) – representing the cost of funds provided by both shareholders and debtholders to finance the activity of the company.
Financial synergies can take the form of a lower cost of capital for the company, meaning a lower overall cost of financing. A bigger firm may indeed have a lower cost of capital thanks to its increased size and induced lower risk of bankruptcy (cheaper financing). This firm may also see lower volatility in generating future cash flows, reducing the required rate of returns from all fund providers (lower operational risk). In addition, the bigger firm may be more capable to find its optimal capital structure (optimal gearing).
The sources of cost of capital synergies can be summarized in 3 forms for a bigger company: cheaper financing access (better credit rating or higher debt capacity)
lower operational risk (lower cash flow volatility)
capability to find the optimal gearing (optimal debt/equity ratio)
The graph below shows the evolution of the cost of capital curve according to the different credit ratings by comparing June 2007 (pre financial crisis) with May 2009 (post financial crisis). The cost of capital curve is built by estimating the WACC of a firm at different capital structures (proportion of equity and debt in financing the business) which corresponds to different credit rating levels.
Graph 4 – Illustration of the Cost of Capital Synergy
Source – J.P. Morgan – A shifting landscape for synergies – 2009
The graph shows first that as the firm levers up (higher debt/equity ratio), the cost of capital of the company tends to increase. The lower cost of capital is achieved at the highest credit ratings.
6% 7% 8% 9% 10% 11% A+ A A- BBB+ BBB BBB- BB+ BB
WACC June 07 WACC May 09
More interestingly, the graph highlights two discoveries:
the cost of capital has increased after the great financial crisis (from an average 8% to 10%) the cost of capital structure is more sensitive since the great financial crisis
The higher steepness of the cost of capital curve around BB rating implies that companies can achieve a substantial cost of capital benefit if they successfully upgrade from non-investment grade (BBB to BB) to investment-grade (A+ to BBB) rating. Concretely, when two merging firms achieve this credit upgrading, the benefit in terms of cost of capital (up to 1% according to the curve) is a financial synergy. It is also important to notice that the credit rating where the cost of capital is minimized does not necessarily correspond to the optimal capital structure. Anyhow merging companies can benefit from financial synergies as the form of higher debt capacity, lower cash flow volatility, and improved capacity to strike the optimal gearing.
Tax efficiency: tax efficiency refers to the financial synergies under which merging companies would benefit from tax reductions in different ways:
tax shield
tax loss carry forward asset step up / asset write up
The tax efficiency can firstly take the form of “tax shield” that is tax deduction on debt payments. The merging company can benefit from higher debt capacity and therefore encounter tax savings on the higher amount of debt issued. The tax efficiency can secondly take the form of “tax loss carry forward”. The merging company can offset or shelter the taxable profit of one company with the net operating losses of the other company. This tax efficiency can thirdly take the form of “asset step up”. The merging company can see the assets of the target company re-evaluated, resulting in tax savings from increased depreciation and amortization.
Financial flexibility: financial flexibility accounts for all the financial synergies that allow a merging company to enhance its certainty of financial market access as well as to reduce its liquidity and bankruptcy risks. Larger firms may encounter the ability to source capital from diversified markets and reduce liquidity crunch or solvency risk. For example, commercial papers are only accessible for investment grade companies such that stronger merged companies will have access to cheaper forms of financing under commercial papers. These examples could be multiplied for many different financial instruments. In addition, merged companies may benefit from unlocking unused cash, as part of financial flexibility synergy, to finance future profitable investment projects.
3.2.2 - Validity of Financial Synergies
The main takeaway around financial synergies is that there are some reasons to believe that they do exist – and may be relevant when the combined firm can achieve a better credit rating through the merger (allowing to move on the cost of capital curve). Financial flexibility refers to the increased size of the merged entity while tax efficiency arises from tax opportunities in the takeover.
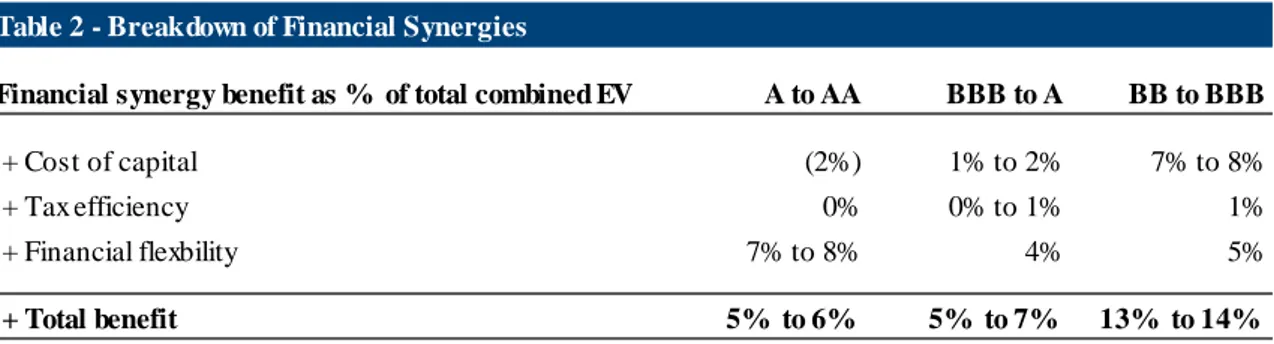
The table below summarizes the synergetic effects of financial synergies (as % of total combined enterprise value) on takeovers for companies moving from one credit rating to another.
Source – J.P. Morgan – A shifting landscape for synergies – 2009
Among financial synergies, financial flexibility appears as the most valuable financial gains for merging companies while the tax efficiency is negligible whatever the credit rating improvement. Besides, the total financial synergies remain the most valuable for merging companies moving from the credit rating BB to BBB, driven by a higher cost of capital benefit for this credit rating range.
However, after having identified and described the sources of financial synergies, it remains important to notice three facts. First, the positive impact of financial synergies in terms of cash flows or capital structure could be really negligible regarding other gains from the takeover. Second, corporate finance theory debates on the validity of the cost of capital effect, and more broadly on the financial synergies, from a merger or an acquisition. Third, financial synergies – if they exist – do not, and by no means, comply with growth opportunities as the rationale of expansionary offensive M&A.
In the next sections of the research paper, we will not consider financial synergies anymore since they are usually not taken into account when performing synergy valuation for the reasons mentioned just above.
4. Negative Synergies or Cost to Achieve Synergies
If synergies were previously defined as the positive incremental net gain from combining two or several firms through a merger or an acquisition, some cash flows resulting from the combination will distinctly be negative. Negative synergies – or equivalently costs to achieve synergies – refer to the negative cash flows that will occur from the combination, apart from the acquisition premium and the transaction costs which are part of the invested capital of the buyer.
As for operating and financial synergies, negative synergies can take several forms and come from different sources, some being more recurring than others. The idea of this section is to embrace the comprehensive background of synergies by providing common examples of negative synergies merging entities may face.
Table 2 - Breakdown of Financial Synergies
Financial synergy benefit as % of total combined EV A to AA BBB to A BB to BBB
+ Cost of capital (2%) 1% to 2% 7% to 8%
+ Tax efficiency 0% 0% to 1% 1%
+ Financial flexbility 7% to 8% 4% 5%
Market cannibalization: market cannibalization or cannibalization of sales can be identified as the contrary effect of cross-selling. This happens when a company launches a new product that will damage the sales performance of other existing products from the same company. In case of a merger or an acquisition, the combined entity may face redundancy or competition on the products of the two separate companies, and therefore need to repackage its offer accordingly to avoid drop in sales. Market cannibalization will be all the more prominent when the two separate entities are offering the same type of products or services, and positioned on the same customer segments or market geographies.
Operational complexity: after considering financial flexibility as a potential synergy resulting from a takeover, it seems crucial to discuss about the opposite effect of operational complexity. Indeed, if a bigger company may enjoy better financing solutions or lower capital requirements, the same bigger company will be shorted on costs associated with its new size. Large companies may lack of operational flexibility compared to smaller companies when it comes to react quickly to changes in the business environment or to implement new measures.
Removing overlapping functions cannot be done without implementation costs: breaking a leasing contract to close a rented office
building a new plant or a new headquarter
terminating employment contracts in case of layoff shipping the material resources to a new place
There are many examples... Operational complexity can definitively be seen as the burden of growing bigger, incurring implementation costs during and after the post-merger integration process.
Culture clash: culture clash is a common phenomenon in large M&A deals when two combining companies show really different identities. In terms of negative synergies, the most frequent expression of culture clash is the leakage of human talent. After a merger or an acquisition, some employees may want to leave the company, especially in case of new working site or new management, because they no longer fit with the DNA of the new combined entity.
Client leakage: if takeovers allow new growth opportunities, they may also induce negative effects such as a leakage of clients or suppliers. On the client side, some customers may stop buying products or services from the combined entity. On the supplier side, some may want to diversify their customer base so not to rely on one single powerful client created after the merger or the acquisition.
Negative synergies or implementation costs are not literature but do exist. They need to be taken into account by the buyer when contemplating M&A as part of the synergies resulting from the deal. These negative synergies will certainly be included in the valuation process of synergies.
5. Issues related to Synergies – Conclusion
5.1 - Implication of Synergies in M&A Failure
Unfortunately in life, things do not always turn as expected. This is the same story in corporate finance and especially in M&A. Discussions with investment bankers pointed out that estimated synergies is not an exact science. If the main objective of M&A is strategic growth, the realization of synergies would be the icing on the cake.
According to surveys carried out by consulting firms involved in post-merger integration processes, synergy estimations are often wrong because synergy implementations are always difficult and these difficulties are usually underestimated. In a report released by Bain & Company in 2014, the consulting firm presented the results of a survey carried out on 350 executives and 150 mergers worldwide. The graph below presents the main drivers of failure in M&A deals according to global executives of different companies across the globe.
Graph 5 – Drivers of M&A Failures
Source – Bain & Company – Why some merging companies become synergies overachievers – 2014
As stated in the report, “the open secret about M&A is that most deals fail to generate the synergies
companies expect when they announce a merger”. Overestimated synergies from combining the companies
(55%) appears as the second root cause for M&A disappointment, right after the due diligence failing to highlight critical issues (59%). This finding is critical in a sense that the buyer – by making a mistake in estimating the possible synergies out of the target – will be likely to overpay the acquisition through the control premium.
5.2 - Pitfalls in Synergies Estimation
In another survey carried out by McKinsey & Company in 20004, the consulting firm showed through the analysis of 160 mergers that “when companies merge, most of the shareholder value created is likely to go
not to the buyer but to the seller – it is known as the winner’s curse”.
46 46 49 55 59 0 10 20 30 40 50 60 70
Hit problems integrating management teams Failed to access cultural fit
during due diligence Faild to recognize insufficient strategic fit Overestimated synergies
from combination Due diligence failed to highlight critical issues
They also point out that the “winner’s curse” is the consequence of two main pitfalls: The lack of information and data around the context of the deal or the target The lack of experience and wisdom when estimating the synergies
As for the absence of access to information, buyers usually have little data on the target when it comes to assess the level of synergies they can expected from the merger. In particular, buyers need to deal with really limited access to the managers, suppliers, customers, or contracts of the target company. Even investment banks, as transaction advisers, cannot evaluate synergies with the required granular level mainly because of data privacy and lack of time.
Most buyers lack of experience in the complex exercise of estimating synergies. Only few companies are involved in recurring external growth strategies – and would therefore be familiar with synergies. A fewer number of companies can demonstrate a competitive advantage in integrating companies and realizing full synergies. This leads buyers to make some considerable mistakes when estimating synergies:
overestimate of revenue and cost synergies
underestimate (or avoidance) of negative synergies or implementation costs inconsistency with business standards and company benchmarks
overconfidence on the synergies timeline
5.3 - Importance of Synergies Failure
The direct consequence of these pitfalls is that M&A deals are likely to destroy value for the shareholders of the combined entity in numerous cases. The same report from Bain & Company shows that about 70% of companies will fail to realize the synergies announced in a merger. It is important to mention that this result remains consistent across the different surveys on such post-deal analysis – with an estimation of 60% to 70% of synergies estimation failure.
Graph 6 – Evidence of Synergies Overestimation
Source – Bain & Company – Why some merging companies become synergies overachievers – 2014
88% 79% 72% 68% 66% 47% 12% 21% 28% 32% 34% 53% 0% 20% 40% 60% 80% 100% Banking Insurance Industrials Chemicals Pharma Healthcare High Technology Consumer Retail Media Telecoms
The graph breaks down the synergies overestimation (blue rectangle) by industrial sectors. The grey rectangles give the proportion of the companies that correctly estimate or underestimate the synergies before the deal. The analysis of the graph allows to conclude that indeed 70% of merging companies – all business sectors included – fail to achieve the amount of expected synergies from the takeover.
The major limit of this analysis is the absence of data regarding the difference between the synergies announced and the synergies realized. If it is accepted that 60% to 70% of takeovers are bound to synergies issues, by how much do companies fail to achieve the expected level of synergies?
Graph 7 – Overestimation of Cost Synergies
Source – McKinsey & Company – Where mergers go wrong – 2004
In the same report from McKinsey & Company, the detailed failure on cost synergies gives some clue about the level of mistakes that buyers may communicate on synergies. When remembering that buyers do not communicate around revenue synergies – since they are highly uncertain and picky to estimate – it can be assumed that the graph above provides an accurate guess on the error spread between estimations and realizations.
So the results from the survey show that approximately: 36% of takeovers capture 100% of anticipated synergies
38% of takeovers capture between 80% to 100% of anticipated synergies 26% of takeovers capture less than 80% of anticipated synergies
3% 6% 1% 4% 12% 13% 25% 36% 0% 5% 10% 15% 20% 25% 30% 35% 40% <30 30-50 51-60 61-70 71-80 81-90 91-100 >100
5.4 - Intermediary Conclusion
In this first section, we started to define the synergies from a theoretical point of view. We showed the following aspects about synergies:
Companies contemplate M&A deals primarily for “growth opportunities”, the synergies being a materialization of potential incremental cash flow deriving from expansionary offensive M&A
The control premium the buying company usually pay in acquisitions is only justified by the existence of potential synergies out of the combination with the target company
The potential synergies from the transaction can take two different forms for the buyer company: Operating: revenue enhancement & cost reduction
Financial: capital flexibility & tax efficiency
The operating synergies however are the only form of synergies pursued by the combined entity while financial synergies appear to be questionable and negligible
Synergies are one of the major cause for M&A failures because buying companies usually make mistakes when estimating the operating synergies from the combination
In the next section, we will present the different valuation methods that can be used in theory and in practice to compute the net present value of potential synergies for the buyer. If the different approaches are commonly used in corporate finance, the valuation of synergies involves some specificities. The last objective of the next section is to provide a better understanding of the link between synergies and value creation in M&A.
PART 2 – VALUATION OF SYNERGIES
After the identification of the possible sources of synergies, this second part presents the different valuation techniques applicable to synergies. The objective of synergies valuation can be broken down into two categories, corresponding to two different steps in the valuation process. The first step is the synergies estimation and the second step comprises the synergies valuation itself. When carrying out these two steps, the buyer will be able to compute the Net Present Value of synergies taken out of the transaction, and more importantly the possible value creation from the deal. In this section, we provide details on the synergies valuation techniques before discussing the financial impact on value creation.
1. Methods of Valuation – Introduction
Before presenting some valuation techniques relative to synergies, it seems important to bring some precisions about the key features on synergies valuation.
First, we are dealing in this section with the valuation of synergies before the merger or the acquisition, and by extension before the integration of the combined firms. This precision remains important since the valuation of synergies relates to the preliminary estimation of the future synergies that will derive from the takeover. It appears crucial to highlight the fact that the valuation will be therefore based on assumptions and subject to some margin errors – as it this the case when valuing a company whatever the method adopted.
Second, revenue and cost synergies do not follow the same patterns in terms of estimation since revenue synergies are much more difficult to estimate and to quantify than cost synergies. In addition, revenue synergies prove to be more uncertain in most cases compared to cost synergies, so that the valuation process will need to take this difference into account.
2. Synergies Estimation with the Multiples Approach
2.1 - Presentation of the Multiple Approach
The valuation by multiple is a relative valuation method relying on a sample of comparable aggregates or peers to value the company. The basic idea of the multiple approach is to assume that peers with similar characteristics should have the same value as the observed company to be valued.
Here is a brief summary of the multiple approach. The effectiveness of the relative valuation will largely depend on the quality of the comparable attributes of the selected peers sample. We do not discuss here the relevancy of the different operating metrics.
(1) Peers Sample: The sample of comparable companies needs to be built based on peers with similar characteristics as the observed company. These similar characteristics comprise the business sector (products, geographies, customers), the size of the company (market capitalization, sales, assets), the positioning of the company (margins, growth, capital expenditures) and the capital structure (debt level, credit rating).
(2) Multiple Calculation: The evaluator needs to compute the multiple for the selected comparable metric among the peers sample. For instance, among a sample of companies operating in the solar energy industry, the average EV/EBITDA multiple is equal to 10x. The comparable metric may be different according to the sector in which the observed company operates.
(3) Multiple Valuation: The multiple valuation is simply obtained by applying the computed multiple of the most comparable peer within the sample to the aggregate of the observed company. For instance, if the observed company operating in the solar energy industry has an EBIT of €10m and the comparable EV/EBITDA is 10x, then its EV is equal to €100m based on the valuation process.
NPV (Multiple Valuation) = Target Aggregate × Comparable Multiple (Eq. 6) 2.2 - Application to Synergy Estimation
The multiple approach applies to the estimation of synergies as similar transactions in a sector give an overview of the possible synergies realized through recent mergers. The objective of the synergies estimation is to provide a bracket of potential synergies for the buyer – especially a reasonable upper limit – as well as an anchor for the synergies valuation with the DCF approach.
(1) Sample of comparable transactions: As for relying on comparable companies, synergies estimation relies on a sample of comparable transactions. Ideally, these comparable transactions occurred in the same business industry, the same geographies, the same years and for comparable companies that communicated on the synergies realized from the deals.
(2) Calculation of the synergies multiple: Different multiples are available to estimate the possible synergies from a deal based on comparable transactions. While in the traditional multiple approach, the transaction or trading multiples are split into two main categories depending on the metric they allow to compute (even the Enterprise Value or the Equity Value), the synergy multiples rely on the single metric that we call “Recurring Run-Rate Pre-Tax Synergies”.
This metric corresponds to the amount of operating (revenue & cost) synergies taken out from the deal on a pre-tax basis, when these synergies can be considered as permanent (“recurring”) and realized at full potential (“run-rate”). The recurring run-rate pre-tax synergies usually corresponds to the amount of synergies communicated by companies around the deal.
The most common Synergy Multiples that can be encountered are listed below: recurring run-rate pre-tax synergies / target sales (usually for revenue synergies) recurring run-rate pre-tax synergies / combined sales
recurring run-rate pre-tax synergies / target operating expenses (usually for cost synergies) recurring run-rate pre-tax synergies / combined operating expenses
recurring run-rate pre-tax synergies / acquisition premium (also called PE of Synergies) recurring run-rate pre-tax synergies / target market capitalization
(3) Estimation of the synergies for the observed transaction: Similar to the traditional multiple approach, the synergies estimation is simply derived when applying the selected relevant multiple to the observed transaction. For instance, if for the observed transaction, the buyer paid an acquisition premium of 20% for a deal valued at €100m – that is an acquisition premium of €20m – while the comparable multiple Recurring Run-Rate Pre-Tax Synergies / Acquisition Premium is 10x for the current business industry, then the recurring run-rate pre-tax synergies out of the deal can be fairly estimated around €200m based on the multiple approach.
Recurring Run Rate Pre Tax Synergies = Aggregate × Comparable Synergies Multiple (Eq. 7)
3. Synergy Valuation with the DCF Approach
3.1 - Presentation of the DCF Approach
The DCF approach (Discounted Cash Flows) is the referral valuation technique for intrinsic method. This valuation technique simply consists in computing the present value of the projected free cash flows of the company discounted at its cost of capital.
Here is a brief summary of the DCF methodology. We do not discuss here the advantages or disadvantages of this valuation method but just give the necessary background to be applied to synergies valuation.
(1) Free Cash Flows: The evaluator needs to forecast the future free cash flows that will need to be taken into account in the DCF valuation, with some assumptions.
FCF = EBIT − Tax + D&A − Capex − ∆WCR (Eq. 8)
(2) Discount Rate: The discount rate used in the company valuation with the DCF approach is the WACC (Weighted Average Cost of Capital) of the valued company.
WACC = Ke × E
D+E+ Kd × (1 − Tax) × D
D+E (Eq. 9)
(3) Terminal Value: The terminal value represents the value captured by the company beyond the explicit forecasted period of the business plan. The terminal value (TV) can be computed with the perpetuity growth (g) or the terminal multiple.
TV = 𝐹𝐶𝐹𝑁𝑜𝑟𝑚𝑎𝑡𝑖𝑣𝑒
𝑊𝐴𝐶𝐶−𝑔 (Eq.10)
(4) DCF Calculation: The DCF calculation can be broken down into two parts, the first part being the discounted FCF under the forecasted period and the discounted TV beyond the forecasted period.
NPV (DCF Valuation) = ∑ FCFi (1+WACC)i ∞ i=1 = ∑ FCFi (1+WACC)i n i=1 + TV (1+WACC)n (Eq. 11)
3.2 - Application to Synergy Valuation
The DCF approach perfectly applies to the valuation of synergies since synergies can be identified as future cash flows for the combined firm. The DCF valuation of synergies relies on the previous estimation of the amount of Recurring Run-Rate Pre-Tax Synergies. However though, synergistic cash flows may address some specifies that should be taken into account when practicing the valuation.
(1) Identification of the synergies: The first step of the synergies valuation through the DCF method includes the identification of the sources of synergies from the transaction. This step is crucial as the two sources of synergies will have significantly different impacts on the free cash flows.
The revenue synergies translate as additional sales and will have a direct impact on the top line of the DCF model. However, for calculating the free cash flow, the EBIT impact of revenue synergies needs to be computed, usually based on the current EBIT margin of the company. The cost synergies, as improvements of operating expenses, directly impact the EBIT of the buying company.
(2) Phasing of the synergies: The second step involves to take into account the time of implementation of the synergies. The merging companies need time to set up the post-merger integration as well as the required actions to implement the potential synergies identified. The DCF valuation requires the synergies phasing to be taken into account for sake of accuracy. In most cases, the synergies are fully phased (“recurring run-rate pre-tax synergies”) during the third year following the acquisition.
(3) Implementation of the synergies: The third steps involves to take into account the cost of implementation of the synergies. Also called restructuring costs, these negative cash flows can be identified as capital expenditures in the Free Cash Flow formula for the DCF valuation. Again, the merging companies need some investments in order to extract the potential synergies identified, and the DCF valuation has to consider the costs of implementation for the synergies to materialize.
(4) DCF Valuation: The next steps of the synergies valuation remain consistent with the traditional DCF approach, for both the horizon of the business plan and the perpetual value.
The synergies valuation can however present some specificities because synergistic cash flows occurring from M&A deals may differ from the traditional free cash flows resulting from the intrinsic operational activities of the company. In the following lines, we consider an example with fake numbers to show these specificities.
In the assumptions table below, we provide all the assumptions and figures to illustrate the synergies DCF valuation. We usually apply a risk premium (1% here) to the WACC (9% here) because the synergistic cash flows are highly uncertain. In our example, we consider revenue and cost synergies respectively as percentages of target sales (5%) and target operating expenses (10%).
When computing the synergistic cash flows, as for the traditional DCF method, we may consider two timelines, one corresponding to the business plan and the other to the terminal value. In our example, we consider that the buyer will extract perpetual synergies from the takeover – that is the combined entity will benefit from advantages from its competitors over an infinite timeframe. This strong consideration is acceptable as long as we consider that a merger will sharply transform the market and sustainably strengthen the position of the combined entity on this market. Otherwise, a degraded synergistic cash flow representing the permanent synergies (usually the revenue synergies) of the merged entity can be shaped as for the terminal value. Alternatively, a finished time horizon can be adopted (hence no terminal value) for the synergies valuation.
Regarding the effects of revenue and cost synergies on the final free cash flow line, some differentiation may be considered as the two cash flows affect different lines. As top-line inflow, the revenue synergies have to be contemplated as EBIT impact applying the current EBIT margin of the buying company while cost synergies directly pour into operating result.
Some other parameters need to be integrated such as the phasing of synergies and the implementation costs required to benefit from the positive effects of operating synergies. As a rule of thumb, the implementation phasing is such that 1/3 of full effect of synergies is obtained after one year, 2/3 after 2 years and 100% after the third year (this is the recurring run-rate synergies).
Assumptions Summary
Assumption Value
Transaction Date EoY 2016
WACC (%) 9,0 %
Risk Premium (%) 1,0 %
Discount Rate (%) 10,0 %
Perpetual Growth Rate (%)
-Revenue Synergies as % of Target Sales 5,0 %
In the end, the Net Present Value of synergies is obtained by summing the discounted free cash flow
from both the business plan and the terminal value (if considered as applicable). Sensitivity analysis around key assumptions can be performed in order to get a value range and see how sensitive is the NPV compared to key parameters (such as the discount rate, revenue synergies compared to target sales and cost synergies relative to target expenses).
DCF Synergies Valuation
m€ 2016A 2017E 2018E 2019E 2020E 2021E 2022E TV
Target Sales 1 200
Target Operating Expenses 900
Revenue Synergies 60 60 60 60 60 60 60
EBIT Margin 10 % 10 % 10 % 10 % 10 % 10 % 10 %
EBIT Impact of Revenue Synergies 6 6 6 6 6 6 6
Cost Synergies 90 90 90 90 90 90 90
Total Gross Operating Synergies 96 96 96 96 96 96 96
Implementation Phasing (%) 30 % 60 % 100 % 100 % 100 % 100 % 100 %
Total Gross Synergies Phased 29 58 96 96 96 96 96
Implementation Costs (96) (48) (19) - - -
-(as % of total gross operating synergies) 100 % 50 % 20 % - - -
-Pre-Tax Net Synergies (67) 10 77 96 96 96 96
Effective Tax Rate (%) 30 % 30 % 30 % 30 % 30 % 30 % 30 %
Post-Tax Net Synergies (47) 7 54 67 67 67 67
(+) Depreciation & Amortization - - -
-(-) Change in Working Capital - - -
-(-) CAPEX - - -
-Free Cash Flow (47) 7 54 67 67 67 67
Year Account 1 2 3 4 5 6 6
Discounted FCF (43) 6 40 46 42 38 421
Sensitivity Analysis
Discount Rate / Revenue Synergies (as % of target sales) Discount Rate / Cost Synergies (as % of target expenses)
Discount Rate Discount Rate
550 8% 9% 10% 11% 12% 550 8% 9% 10% 11% 12% 3% 598 566 536 509 482 8% 498 472 447 424 402 4% 605 573 543 515 489 9% 555 526 499 473 448 5% 613 581 550 522 495 10% 613 581 550 522 495 6% 621 588 557 528 501 11% 670 635 602 571 541 7% 628 595 564 535 507 12% 728 689 653 619 588
4. Discussion around Value Creation – Conclusion
4.1 - Synergies to Breakeven for EPS
Usually, investors perform analysis on Earnings Per Share (EPS) when a deal is settled in order to assess the impact of the transaction on the return for the shareholders of the buyer company. EPS is an indicator of how much money the shareholder will receive for every share held in the company. EPS is popular among investors and shareholders for its simplicity.
As part of the transaction, EPS analysis relies on accretion / dilution calculation – that is the change between the EPS of the buyer pre-transaction and the EPS of the merged group post-transaction.
EPS Accretion / Dilution is measured (in %) by the following formula:
Accretion (Dilution) =EPSCombined
EPSAcquirer − 1 (Eq. 12)
If the EPS of the merged group is higher than the EPS of the buyer pre-transaction then the deal is said to be accretive. On the contrary, if the EPS of the merged group is lower than the EPS of the buyer pre-transaction then the deal is said to be dilutive. In case of an EPS dilutive transaction, investment bankers usually calculate the synergies to breakeven – that is the additional amount of pre-tax synergies required for the transaction to be EPS neutral (neither accretive nor dilutive). The formula of synergies to breakeven in EPS consideration is given below:
Synergies to Breakeven = (EPSAcquirer− EPSCombined)×Combined Shares
1−Acquirer Tax Rate (Eq. 13)
In addition, the investment banker may produce a sensitivity analysis on the EPS accretion / dilution to see how the synergies to breakeven amount fluctuates according to the acquisition premium paid and the mix of financing (cash, share or mixed offer deal). From this sensitivity analysis, the buyer will get an idea if the required level of additional synergies is reasonable to avoid EPS dilution.
EPS is commonly used in M&A for its simplicity and because it allows to track the implementation of operating synergies. As an indicator, EPS is supposed to indirectly grasp the value creation. Nevertheless, EPS is not an indicator of value creation, essentially for its lack of consideration on the risk of the company to achieve the profitability. We will keep that EPS is a useful tool for tracking the implementation of the announced synergies.
4.2 - Synergies Sharing
Another analysis to perform on a transaction is to compare the NPV of synergies to the acquisition premium
(as referenced in Eq. 2). It seems important here to make a distinction on the different mixes of financing
(cash, share or mixed offer deal) in order to carry out this analysis. For sake of simplicity, we will consider here the two cases of all cash deal and share for share deal.
In the case of all cash deals, the comparison between the NPV of synergies and the acquisition premium will be an indicator on whether the buyer overpaid or underpaid the transaction regarding the value that can be extracted for acquiring the target company.
Graph 8 – Synergies Sharing in All Cash Deal
The first bridge above is an illustration of synergies sharing in all cash deals. In this example, the buyer acquires the target for a total consideration including the acquisition premium (530). The control premium (80) reflects the amount of synergies given up by the buyer to the target (only 120 is kept). The target EV for the buyer (650) represents the value of the target according to a specific buyer taking into account operating synergies (300) as well as transaction and integration costs (150).
In the case of share deal, the comparison between the NPV of synergies and the acquisition premium will be an indicator on the proportion of the value of synergies shared between the buyer shareholders and the ex-target shareholders.
Graph 9 – Synergies Sharing in Share Deal
650 500 (50) 100 200 (100) Target EV standalone Transaction Costs Revenue Synergies Cost Synergies Restructuring Costs Target EV for the Buyer
450 80 120 Synergies Sharing Illustrative amounts 650 500 (50) 100 200 (100) Target EV standalone Transaction Costs Revenue Synergies Cost Synergies Restructuring Costs Target EV for the Buyer
450 80 48 72 Synergies Sharing Illustrative amounts