Exchange Rates and Order Flow in the Long Run
15
0
0
Texte intégral
(2) CIRANO Le CIRANO est un organisme sans but lucratif constitué en vertu de la Loi des compagnies du Québec. Le financement de son infrastructure et de ses activités de recherche provient des cotisations de ses organisations-membres, d’une subvention d’infrastructure du Ministère du Développement économique et régional et de la Recherche, de même que des subventions et mandats obtenus par ses équipes de recherche. CIRANO is a private non-profit organization incorporated under the Québec Companies Act. Its infrastructure and research activities are funded through fees paid by member organizations, an infrastructure grant from the Ministère du Développement économique et régional et de la Recherche, and grants and research mandates obtained by its research teams. Les partenaires / The Partners Partenaire majeur Ministère du Développement économique, de l’Innovation et de l’Exportation Entreprises partenaires Alcan inc. Banque du Canada Banque Laurentienne du Canada Banque Nationale du Canada Banque Royale du Canada Bell Canada BMO Groupe financier Bombardier Bourse de Montréal Caisse de dépôt et placement du Québec Fédération des caisses Desjardins du Québec Gaz Métro Hydro-Québec Pratt & Whitney Canada Raymond Chabot Grant Thornton Autres partenaires gouvernementaux Industrie Canada Ministère des Finances du Québec Ville de Montréal Partenaires universitaires École Polytechnique de Montréal HEC Montréal McGill University Université Concordia Université de Montréal Université de Sherbrooke Université du Québec Université du Québec à Montréal Université Laval Le CIRANO collabore avec de nombreux centres et chaires de recherche universitaires dont on peut consulter la liste sur son site web. Les cahiers de la série scientifique (CS) visent à rendre accessibles des résultats de recherche effectuée au CIRANO afin de susciter échanges et commentaires. Ces cahiers sont écrits dans le style des publications scientifiques. Les idées et les opinions émises sont sous l’unique responsabilité des auteurs et ne représentent pas nécessairement les positions du CIRANO ou de ses partenaires. This paper presents research carried out at CIRANO and aims at encouraging discussion and comment. The observations and viewpoints expressed are the sole responsibility of the authors. They do not necessarily represent positions of CIRANO or its partners.. ISSN 1198-8177.
(3) Exchange Rates and Order Flow * in the Long Run M. Martin Boyer†, Simon Van Norden ‡ Résumé / Abstract Plusieurs études récentes ont souligné l’importance de la microstructure des marchés pour la compréhension des comportements des taux de change en documentant les relations stables à long terme entre les flux des commandes cumulées et les taux de change courants. Les résultats contrastent avec ceux de nombreuses études sur l’échec des taux de change de se conformer au comportement à long terme que supposent les modèles macroéconomiques « conventionnels » et sont conformes à la prédiction des modèles microstructurels. Nous réexaminons l’évidence de relations stables à long terme et constatons que celle-ci n’existe que dans un petit nombre des taux de change étudiés et qu’elle est fragile du point de vue statistique. Nous concluons que l’implication des modèles microstructurels ne correspond pas aux données aussi bien que des études précédentes laissent supposer. Mots clés : cointégration, flux de commandes, microstructure, taux de change. Several recent papers have underlined the importance of the microstructure effects in understanding exchange rate behavior by documenting stable long-run relationships between cumulated order flows and spot exchange rates. This stands in contrast to the widely-studied failure of exchange rates to conform to the long-run behavior implied by “conventional” macroeconomic models and is consistent with the prediction of micro-structure models. We reexamine the evidence for stable long-run relationships. We find that such evidence exists only for a small number of the major currencies we examine and that is it statistically fragile. We conclude that this implication of microstructure models does not fit the data as well as previous studies suggest. Keywords: cointegration, foreign exchange rates, order flow, microstructure Codes JEL : F31, G15. *. We would like to thank Rich Lyons and Martin Evans for sharing their data, and participants at HEC Summer Research Seminar for their comments. This research benefited from the research support of HEC Montréal, SSHRC-Canada and FQRSC, as well as the continuing financial support of CIRANO. † CEFA Associate Professor of Finance, HEC Montréal, Université de Montréal, 3000 chemin de la Côte-SainteCatherine, Montréal, QC H3T 2A7 and Fellow, CIRANO, 2020 rue University, Montréal, Québec, H3A 2A5; [email protected]. ‡ Associate Professor of International Business, HEC Montréal, 3000 chemin de la Côte-Sainte-Catherine, Montréal, Québec, H3T 2A7, and Fellow, CIRANO, 2020 rue University, Montréal, Québec, H3A 2A5; [email protected]..
(4) 1. Introduction. What moves exchange rates? The failure of "conventional" macroeconomic models to explain exchange rate behaviour in the long run has been widely-studied. Recent papers have underlined the importance of the market microstructure in part by documenting statistical relationships between order flows and spot exchange rates. For example, Evans and Lyons (2002) study the DEM/USD market and find that they can explain 50% of the exchange rate movement between the Deutch mark and the US dollar using only the variation in the order flow on that market. They estimate that a demand side imbalance (a positive order flow) of one billion USD increases the value of the USD by 0.5%. Research in market microstructure focuses its attention on order flow because it carries more news than volume, price, the bid-ask spread or other variables. The information associated with the order flow is of two types.1 First, order flows are a signal of to the future expected value of the cash flows generated by the financial asset being exchanged. In the case of the foreign exchange market, these cash flows are associated with the interest rate differential between the two currencies involved. Second, order flows provide information about the equilibrium market discount rate. Put in terms of the formula for the present value of the cashflows generated by a financial asset (i.e., t) ), the first type of information is associated with the numerator while the second is V = Σt E(CF (1+r )t t. related to the denominator. A central implication of the news-transmission role that order flow plays in most mircrostructure models is that order flows should permanently affect market prices. Bjonnes and Rime (2005), Killeen et al (2006) and Rime (2001) note that this implies that the spot exchange rate should be cointegrated with the cumulated order flow. All three of these papers test for and present evidence of such cointegration. We think the claim of cointegration between cumulated order flow and spot exchange rates deserves careful reconsideration. Although these papers stress the importance of this prediction in many theoretical models of price formation, the evidence they present for cointegration is often selective (they present results only for currencies where cointegration is found) and sometime statistically weak. In addition, the tests they use for cointegration are known to suffer from size distortion in small samples, which tends to produce spurious evidence of cointegation.2 This distortion is know to increase with the number of variables in the system, the number of lags, and may also be affected by the covariance matrix of the residuals. For reliable inference, the conventional 1. For a more detailed taxonomy see Lyons (1995), Ito et al. (1998), Cheung and Wong (2000) and Evans (2002). Seminal contributions in this field include the work of Reinsel and Ahn (1992), Cheung and Lai (1993) and Toda (1994, 1995). Godbout and van Norden (1997) provide a discussion of the problem and its application in international finance. 2. 2.
(5) asymptotic critical values used with cointegration tests need to be adjusted. This is typically done via a simulation or bootstrap experiment to determine the appropriate distribution of the test statistics in a particular application under the null hypothesis of no cointegration. We perform the cointegration tests on a commonly-used data set for nine exchange rates and adjust for these small-sample problems. Our results are striking: we find that there is relatively little evidence that of a stable permanent relationship between order flows and exchange rates. The results are fairly robust to different specifications of the test and choices of currency. Moreover, even when we do not correct the tests for small-sample problems, we find no significant evidence of cointegration for most currencies. In the next section, we review the literature on cointegration between exchange rates and cumulated order flow. Thereafter we present the data and the methodology we use to re-examine this evidence. Section four discusses our finding and the final section presents our conclusions.. 2. Literature Survey. Because cointegration between cumulated order flow and asset prices is an implication of most market microstructure models, the existence of such relationships has been examined in several papers. The first of these is Rimes (2001), who examines 222 weekly observations on spot, forward and futures market trades by the 36 largest market participants in the US. Of the five exchange rates for which he has data, he tests for and finds evidence for cointegration for three of them (the DEM/USD, GBP/USD and CHF/USD rates) using single-equation residual-based tests.3 Bjonnes and Rime (2005) examine tick-by-tick data for 4 dealers at a major Scandinavian bank for the week March 2-6 1998 and measure order-flow simply as the "cumulative flow of directions.[p. 591]" Again, they test only a subset of their exchange rates for cointegration, this time using the systembased Maximum Likelihood (Johansen) approach. They find weak evidence of cointegration for the NOK/DEM rate and stronger evidence for the DEM/USD rate.4 Finally, Killen et. al (2006) have data on the daily value of purchases and sales in the FRF/DEM market from January to May 1 (4 months) in the brokered interdealer market from EBS. (They estimate that this covers 21% of the total market volume in this exchange rate.) Significant evidence of cointegration is found using both of the above testing approaches. 3. Although Rimes (2001) labels his test results as significant at the 5% level, asymptotic critical values for the cointegrating regression ADF t-statistic suggest that many are only significant at the 10% level. 4 Bjonnes and Rimes (2005) note that "There was a jump in the DEM\USD from Thursday to Friday which we have removed. [p. 591]". 3.
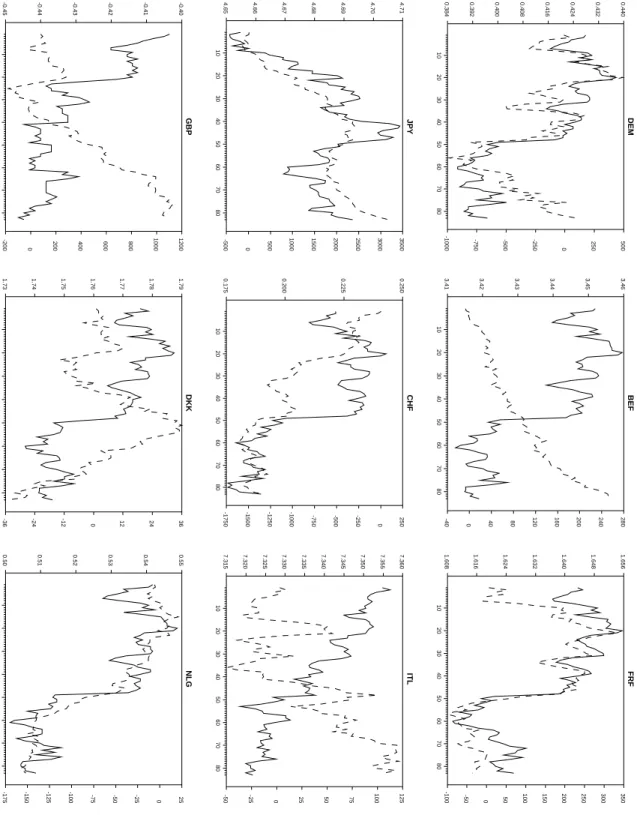
(6) 3. Data and Methodology. The data we use to re-exaimine the evidence of cointegration are those used in Evans and Lyons (2002, 2002a). These are matched spot exchange rates and daily inter-dealer order flows from the Reuters 2000-1 system for nine currencies against the USD over a period of 83 business days spanning four months in mid-1996.5 Evans and Lyons (2002a) cite a claim by Reuters that this trading system accounted for 90% of direct interdealer order flows at the time, or a bit less than 1/3 of total trading volume in FX markets.6 They also note that their indicator of order flows takes no account of the volume of currency traded, but is simply the difference between the number of seller-initiated and buyer-initiated trades.7 The relationship between the spot rates and the cumulated order flow is shown in Figure 1.8 Both series are highly persistent and we confirmed that unit-root tests are unable to reject the null hypothesis that any of the spot exchange rate or cumulated order flow series are I(1). The question at issue is whether there is a stable long-run relationship within each pair of series. Visual inspection of Figure 1 suggests that the evidence may vary considerably from currency to currency. For our analysis of cointegration results, we focus on the maximum likelihood test for cointegration proposed by Johansen (1988) and Johansen and Juselius (1990).9 In addition to its optimality properties, it is among the best-known and most widely-used tests for null hypothesis of no cointegration and was used in two of the three studies of FX order flow cited above. Application of the test requires a choice of lag length and a comparison of the resulting λMax or λT race statistics to their critical values. For asymptotic critical values, we used the tabulations in MacKinnon, Haug and Michelis (1999).10 Because the existing statistical literature notes the potential importance of lag length for test performance, we use two common methods to determine the correct number of lags to be included in our test for cointegration; a likelihood-ratio test for the lag order and the Akaike Information Criterion (AIC).11 The former tended to produce much longer lag lengths while the latter almost always selected the minimum number of lags possible. We report results for both. To avoid spurious evidence of cointegration, we need to replace the usual asymptotic critical 5. A more detailed discussion of the data set and trading environment may be found in Evans and Lyons (2002a). Evans and Lyons’ make this and other microstructure data sets publically available; we analyse this set since it covers by far the largest number and most commonly traded currencies, and because it covers a relatively large proportion of the total market volume. 6 Evans and Lyons (2002a), p. 817. 7 Ibid. As mentioned above, this is the same measure of order flow used by Bjonnes and Rime (2005). 8 All figures and tables are in the paper’s appendix. 9 Specifically, we include a constant but no deterministic trends in the VECM representation of our system; this corresponds to case 1 in the notation of MacKinnon, Haug and Michelis (1999). 10 As they note, the asymptotic critical values provided by Osterwald-Lenum (1992) and widely used in this literature are inaccurate, although this problem is relatively minor relative to the finite sample problems we document below. 11 We also examined the Schwarz Bayesian Criterion; it gave results almost identical to the AIC.. 4.
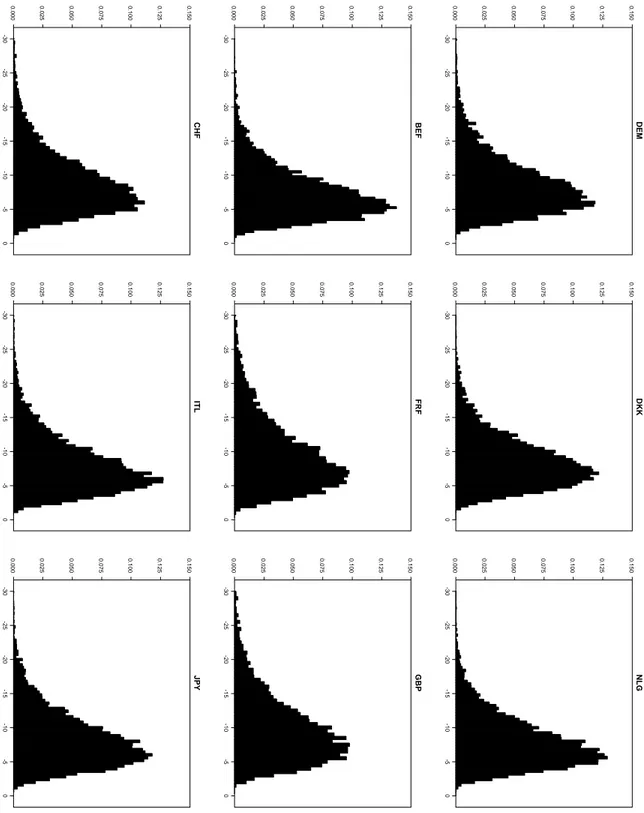
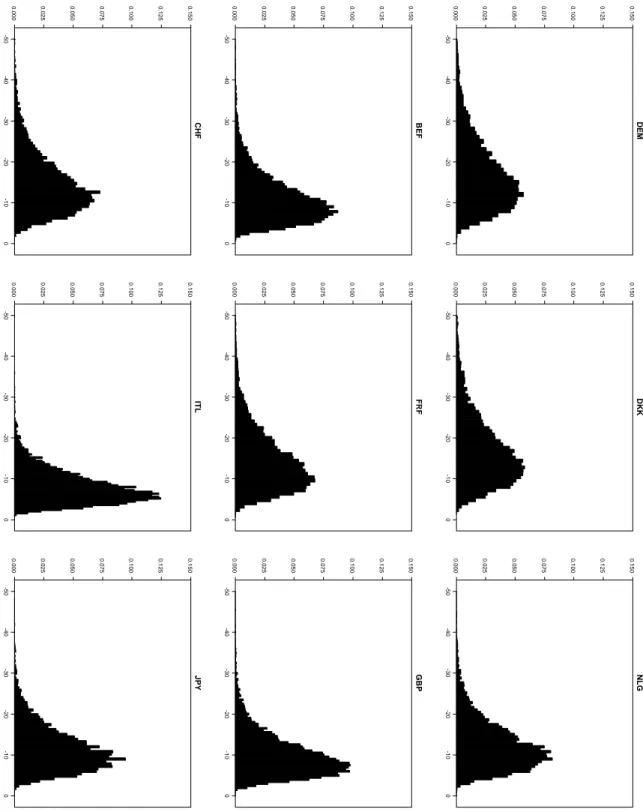
(7) values for the λMax or λT race statistics in order to better reflect their behaviour in small samples. To do so, we used a simple bootstrap approach: 1. We estimated a VAR model for the change in the log exchange rate and the (uncumulated) order flow for each currency.12 Both of these series are I(0). 2. For each estimated VAR model and its residuals, we bootstrapped 10,000 simulated series of exchange rate changes and order flows, each of the same length as our original data.13 These simulated series were then cumulated to provide 10,000 simulated pairs of spot exchange rates and cumulated order flows for each currency. Because they are generated from a VAR in first differences with independent and identically distributed errors, these simulated pairs of series are not cointegrated by construction. 3. For each simulated pair of spot rates and cumulated order flows, we estimated the λMax and λT race statistics for the null of no cointegration. This provided us with a bootstrapped simulation of the finite-sample distribution of the cointegration test statistics under the null hypothesis of no cointegratoin. These distributions are reported in Figure 2 and 3 for the λMax and λT race statistics. 4. We then calculated the λMax and λT race statistics for each pair of series in the Evans and Lyons (2002a) data set and compared them to their bootstrap distribution for that currency. Table 1 reports the bootstrapped p-values for these test statistics and compares them to MacKinnon et al. (1999)’s asymptotic p-values. Table 2 reports the λT race test statistics. Their results are very similar. For that reason, we focus our discussion on the former.. 4. Discussion of Results. Figures 2 and 3 provide an approximate check on the reliability of the cointegration test in small samples. A necessary condition for a reliable test is that the bootstrapped distributions are similar across all currencies, particularly in the left tail of the distribution used to determine critical values. Using the short lag lengths suggested by AIC, Figure 2 shows that all nine distributions are indeed quite similar. With the longer lag lengths suggested by LR tests, however, Figure 3 documents much more variation in the bootstrap distributions across currencies. In particular, currencies where large number of lags are required (such as the DEM, CHF, DKK and NLG - see Table 1) 12 13. Lag lengths for the VAR were determined by the AIC and LR criteria mentioned above. For each simulated series, the VAR was initialized with a random draw from the observed series.. 5.
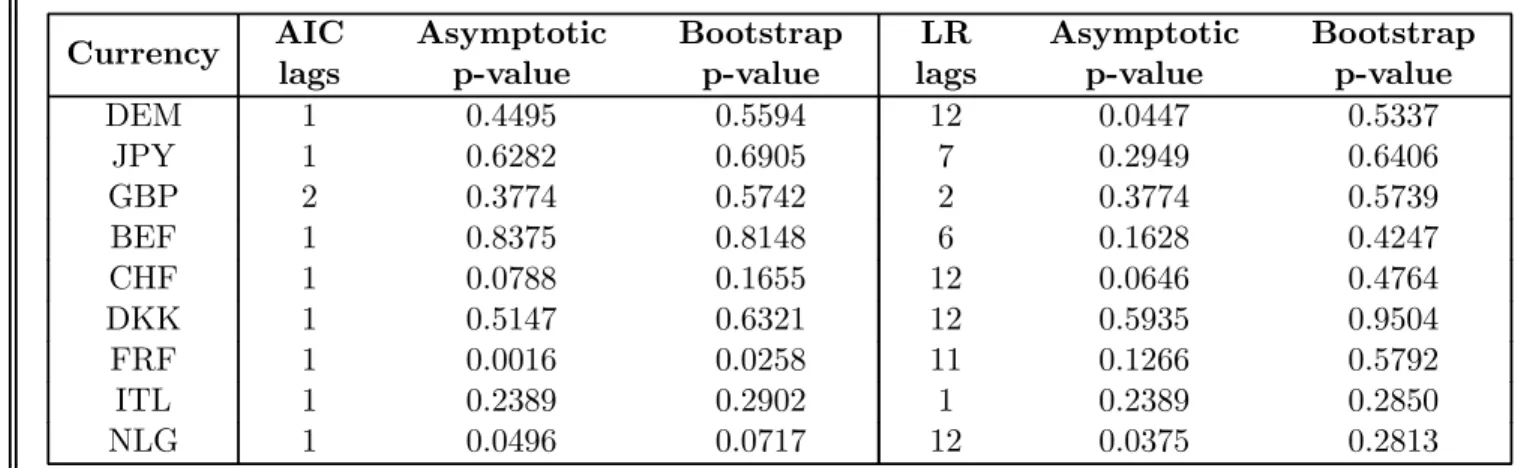
(8) show distributions that are much less peaked and are shifted to the left relative to currencies with few lags (such as the ITL.) This is consistent with the predictions of the literature on distortion in cointegration tests and suggests that the use of conventional critical values will often lead to spurious evidence of cointegration for these currencies. Table 1 compares the asymptotic and bootstrapped p-values of λMax test statistics for cointegration. Beginning with the AIC-determined lags, we see that the bootstrapped p-values are (almost) always higher than their asymptotic counterparts, indicating that correcting for the small sample behavior of the test weakens evidence of cointegration. We also see that there is relatively little significant evidence of cointegration using even the asymptotic critical values; of the nine currencies, one has evidence of cointegration which appears to be significant at the 1% level, one more at the 5% level and one more at the 10% level. This evidence is weaker still after the bootstrap correction; now only one currency (FRF) has evidence of cointegration that is significant at the 5% level, and one more (NLG) at the 10% level. This evidence becomes still weaker when using the LR-determined lag lengths. Now only one currency has evidence of cointegration that is significant at the 5% level (two currencies at the 10% level) using asymptotic p-values. However, after the bootstrap correction, none are significant at even the 20% level. This confirms our impression from Figures 2 and 3 that the degree of size distortion increases with lag length. It also implies that statistical evidence of cointegration is relatively scarce, and that it is fragile to reasonable alternative methods for lag length selection. The results we present in Table 2 with respect to the asymptotic and bootstrapped p-values of λT race test statistics for cointegration are similar to the results we presented in Table 1. Again we see that the bootstrapped p-values are always higher than their asymptotic counterparts, indicating that correcting for the small sample weakens evidence of cointegration. We also see even if there was evidence of cointegration using even the asymptotic critical values (one currency has evidence of cointegration which appears to be significant at the 1% level, two at the 5% level and one more at the 10% level), no evidence survives at even the 20% level when we apply the bootstrap correction.. 5. Conclusion. The goal of this research was to reconsider the evidence of a stable long-run relationship between spot exchange rates and order flow. Using a commonly studied data set, we find evidence of such a relationship for only a small number of major currencies. We further found that some of this evidence appears to be due to problems with cointegration tests; using corrected p-values weakened the evidence further still. At best, there is some evidence of a long-run relationship for two currencies (FRF and NLG) that no longer exist. However, this result was fragile and depends 6.
(9) critically on assuming very short-lived dynamics; using longer lags as some tests suggested left no even weakly significant evidence of a stable long-run relationship for any of the nine major currencies we examine. To be sure, the failure to detect a relationship does not imply that the relationship does not exist; it is possible that longer data sets might have more power to reject the null hypothesis. However, it appears that evidence supporting this implication of market microstructure models is weaker than has been previously believed.. 6. References 1. Bjonnes, G.H. and D. Rime (2005) ‘Dealer Behavior and Trading Systems in Foreign Exchange Markets’ Journal of Financial Economics 75:571-6005. 2. Bjonnes, G.H., D. Rime and H.O.A. Solheim (2004) ‘Liquidity Provision in the Overnight Foreign Exchange Market’ Norges Bank Working Paper 2004-13. 3. Cheung, Y.-W. and K.S. Lai (1993) ‘Finite-Sample Sizes of Johansen’s Likelihood Ratio Tests for Cointegration,’ Oxford Bulletin of Economics and Statistics, 55:313-328. 4. Cheung, Y.-W. and C.Y.P. Wong (2000) ‘A Survey of Market Practitioners’ Views on Exchange Rate Dynamics,’ Journal of International Economics, 51:401-419. 5. Diebold, F.X., J. Gardeazabal and K. Yilmaz (1994) ‘On Cointegration and Exchange Rate Dynamics,’ Journal of Finance 49:727-735. 6. Evans, M.D.D. (2002) ‘FX Trading and Exchange Rate Dynamics,’ Journal of Finance 12:25980. 7. Evans, M.D.D. and R. K. Lyons (2002) ’Informational Integration and FX Trading’ Journal of International Money and Finance 21:807-831. 8. Evans, M.D.D. and R.K. Lyons (2002a) ‘Order Flow and Exchange Rate Dynamics,’ Journal of Political Economy 110:170-80. 9. Godbout, M.-J. and S. Van Norden (1997) ‘Reconsidering Cointegration in International Finance: Three Case Studies of Size Distortion in Finite Samples,’ Bank of Canada Working Paper 97-1.. 10. Ito, T., R.K. Lyons and M.T. Melvin (1998) ‘Is There Private Information in the FX Market?’ Journal of Finance 53:1111-30.. 7.
(10) 11. Johansen, S. (1988) ‘Statistical Analysis of Cointegration Vectors,’ Journal of Economic Dynamics and Control 12:231-54. 12. Johansen, S. (1992) ‘Cointegration in Partial Systems and the Efficiency of Single Equation Analysis,’ Journal of Econometrics 52:389-402. 13. Johansen, S., and K. Juselius (1990), ‘Maximum likelihood estimation and inference on cointegration–with applications to the demand for money’, Oxford Bulletin of Economics and Statistics, 52:169—210. 14. Killeen, W.P., R.K. Lyons and M.J. Moore (2006) ‘Fixed Versus Flexible: Lessons from EMS Order Flow,’ Journal of International Money and Finance In Press. 15. Lyons, R.K. (1995) ‘Tests of Microstructural Hypotheses in the Foreign Exchange Market,’ Journal of Financial Economics 39:321-51. 16. Lyons, R.K. (1997) ‘A Simultaneous Trade Model of the Foreign Exchange Hot Potato,’ Journal of International Economics 42:275-98. 17. MacDonald, R. and M. Taylor (1994) ‘The Monetary Model of the Exchange Rate: Long-run Relationships, Short-run Dynamics and How to Beat a Random Walk,’ Journal of International Money and Finance 13:672-94. 18. MacKinnon, J.G., A.A. Haug and L. Michelis (1999) ‘Numerical Distribution Functions of Likelihood Ratio Tests for Cointegration’ Journal of Applied Econometrics, 14:563-577. 19. Osterwald-Lenum, M. (1992), ‘A note with quantiles of the asymptotic distribution of the maximum likelihood cointegration rank test statistics’, Oxford Bulletin of Economics and Statistics, 54:461—471. 20. Rime, D (2001) ‘U.S. Exchange Rates and Currency Flows’ Working paper 4, Stockholm Institute for Financial Research, Stockholm. 21. Toda, H.Y. (1994) ‘Finite Sample Properties of Likelihood Ratio Tests for Cointegration When Linear Trends are Present,’ Review of Economics and Statistics 76:66-79. 22. Toda, H.Y. (1995) ‘Finite Sample Performance of Likelihood Ratio Tests for Cointegrating Ranks in Vector Autoregressions,’ Econometric Theory 11:1015-32. 23. Watson, M. (1995) ‘Vector autoregressions and cointegration,’ In Engle and McFadden (eds.), Handbook of Econometrics Vol. 4. 8.
(11) 7. Appendix: Tables and Figures. Table 1. λMax Cointegration test results Currency DEM JPY GBP BEF CHF DKK FRF ITL NLG. AIC lags 1 1 2 1 1 1 1 1 1. Asymptotic p-value 0.4495 0.6282 0.3774 0.8375 0.0788 0.5147 0.0016 0.2389 0.0496. Bootstrap p-value 0.5594 0.6905 0.5742 0.8148 0.1655 0.6321 0.0258 0.2902 0.0717. LR lags 12 7 2 6 12 12 11 1 12. Asymptotic p-value 0.0447 0.2949 0.3774 0.1628 0.0646 0.5935 0.1266 0.2389 0.0375. Bootstrap p-value 0.5337 0.6406 0.5739 0.4247 0.4764 0.9504 0.5792 0.2850 0.2813. Likelihood ratio test of the null hypothesis of no cointegration against the alternative of a single cointegrating relationship. The vector error-correction model tested consists of the logarithm of the spot exchange rate, the cumulated order flow, their lagged difference and a constant. Lag lengths were determined optimally using likelihood ratio tests and the AIC. Asymptotic p-values are taken from Mackinnon et al. (1999); Bootstrap p-values are based on the simulations described above.. 9.
(12) Table 2. λT race Cointegration test results AIC lags. Currency DEM JPY GBP BEF CHF DKK FRF ITL NLG. 1 1 2 1 1 1 1 1 1. Asymptotic p-value 0.3450 0.7014 0.4618 0.6152 0.0543 0.4708 0.0009 0.3069 0.0754. Bootstrap p-value 0.51770 0.77240 0.65770 0.59020 0.15910 0.65020 0.02960 0.39160 0.1231. LR lags 12 7 2 6 12 12 11 1 12. Asymptotic p-value 0.0553 0.3734 0.4618 0.0929 0.0041 0.6770 0.0125 0.3069 0.0472. Bootstrap p-value 0.6071 0.7481 0.6659 0.3550 0.2353 0.9731 0.3348 0.3782 0.3494. Likelihood ratio test of the null hypothesis of no cointegration against the alternative of a single cointegrating relationship. The vector error-correction model tested consists of the logarithm of the spot exchange rate, the cumulated order flow, their lagged difference and a constant. Lag lengths were determined optimally using likelihood ratio tests and the AIC. Asymptotic p-values are taken from Mackinnon et al. (1999); Bootstrap p-values are based on the simulations described above.. 10.
(13) 0.440. 0.432. 0.424. 0.416. 0.408. 0.400. 0.392. 0.384. 4.71. 10. 10. 10. 20. 20. 20. 30. 30. 30. DEM. 40. JPY. 40. GBP. 40. 50. 50. 50. 60. 60. 60. 70. 70. 70. 80. 80. 80. 500. 250. 0. -250. -500. -750. -1000. 3500. 3.46. 3.45. 3.44. 3.43. 3.42. 3.41. 0.250. 10. 20. 30. BEF. 40. CHF. 50. 50. 60. 60. 70. 70. 80. 80. 2000. 1500. 280. 240. 200. 160. 80. 120. 40. 0. -40. 250. -500. -750. -1000. -1250. -1750. 500. 1000 0.200. 0. 40. 3000. 30. -250. 20. 2500 0.225. 10. -1500. 0.175. DKK. 80. 0. -24. -12. 1.74. -36. 1.75. 1.76. 36. 70. 1.79. 60. 24. 50. 1.73 40. 1.78. 30. 12. 20. 1.77. 10. 0. -500. 1200. 1000. 800. 600. 400. 200. 0. -200. 1.656. 1.648. 1.640. 1.632. 1.624. 1.616. 1.608. 7.360 7.355 7.350 7.345 7.340 7.335 7.330 7.325 7.320 7.315. 0.55. 0.54. 0.53. 0.52. 0.51. 0.50. 10. 10. 10. 20. 20. 20. 30. 30. 30. FRF. 40. ITL. 40. NLG. 40. 50. 50. 50. 60. 60. 60. 70. 70. 70. 80. 80. 80. 350. 300. 250. 200. 150. 100. 0. 50. -50. -100. 125. 100. 75. 50. 25. 0. -25. -50. 0. 25. -25. -50. -75. -100. -125. -150. -175. 11. 4.70. 4.69. 4.68. 4.67. 4.66. 4.65. -0.40. -0.41. -0.42. -0.43. -0.44. -0.45. Figure 1: Spot USD exchange rates and cummulated order flow. The solid line is the log spot rate (left scale) and the dashed line is the cumulative order flow (right scale)..
(14) DEM DKK 0.150. 0.125. 0.150. 0.125. 0.150. 0.125. 0.100. 0. 0.100. -5. 0.100. -10. 0.075. -15. 0.075. -20. 0.075. -25. 0.050. -30. 0.050. 0. 0.050. -5. 0.025. -10. 0.025. -15. 0.150. 0.025. -20. 0. 0.000. -25. FRF. -5. 0.000 -30. 0.150. -10. 0.000. BEF. -15. 0.025. 0.050. 0.025. 0.050. 0.000. 0.025. 0.050. -30. -30. -30. -25. -25. -25. -20. -20. -20. NLG. -15. GBP. -15. JPY. -15. 0. 0. -5. 0. -5. -10. -5. -10. -10. 12. 0.150. -20. 0.125. -25. 0.125. -30. 0.150. 0.000. 0.125. 0. 0.100. -5. 0.100. -10. 0.100. -15. 0.075. -20. 0.075. -25. 0.075. -30. ITL. 0.125. 0.150. 0.000. CHF. 0.125. 0.150. 0.125. 0.100. 0. 0.100. -5. 0.100. -10. 0.075. -15. 0.075. -20. 0.075. -25. 0.050. -30. 0.050. 0. 0.050. -5. 0.025. -10. 0.025. -15. 0.025. -20. 0.000 -25. 0.000 -30. 0.000. Figure 2: Bootstrap distribution of the λMax statistics under the null hypothesis of no cointegration using the AIC to set lag lengths..
(15) DEM DKK. 0.125. 0.150. 0.125. 0.100. 0.150. 0.125. 0.100. 0.150. 0.100. 0. 0.075. -10. 0.075. -20. 0.075. -30. 0.050. -40. 0.050. -50. 0.050. 0. 0.025. -10. 0.025. -20. 0.025. -30. 0.150. 0.000. -40. FRF. 0.000 -50. 0.150. 0. 0.000. BEF. -10. 0.025. 0.050. 0.025. 0.050. 0.000. 0.025. 0.050. -50. -50. -50. -40. -40. -40. NLG. -30. GBP. -30. JPY. -30. 0. 0. -10. 0. -10. -20. -10. -20. -20. 13. 0.150. -20. 0.125. -30. 0.125. -40. 0.125. -50. 0.125. 0.150. 0.000. 0.100. 0. 0.100. -10. 0.100. -20. 0.075. -30. 0.075. -40. 0.075. -50. ITL. 0.125. 0.100. 0.150. 0.000. CHF. 0.125. 0.100. 0.150. 0.100. 0. 0.075. -10. 0.075. -20. 0.075. -30. 0.050. -40. 0.050. -50. 0.050. 0. 0.025. -10. 0.025. -20. 0.025. -30. 0.000 -40. 0.000 -50. 0.000. Figure 3: Bootstrap distribution of the λMax statistics under the null hypothesis of no cointegration (using LR tests to set lag lengths.).
(16)
Figure

+2
Documents relatifs
Rivara, grammairien, dans son livre traitant du «système de la comparaison», parle de comparabilité par nature (6). En d’autres termes, la question de la comparabilité ne
By exploiting the advantage of non stationary panel econometrics, we are able to determinate factors that drive real exchanges rate in the long run : the Balassa-Samuelson
In the vein of fractional Brownian models, one of the most recent and advanced models assumes that the time-varying Hurst exponent follows a stochastic process: it is
This study examines return predictability of major foreign exchange rates by testing for martingale difference hypothesis (MDH) using daily and weekly nominal exchange rates from
Abstract : The aim of this paper is to examine the effect of remittances on real effective exchange rate in MENA countries using an autoregressive distributive lag (ARDL) model and
First, at the descriptive level, we document an important and increasing margin for light consumption goods, such as wearing apparel, textiles and food products which are mainly used
In order to complete this brief presentation of the national model, we define the different variables involved in equations 10 to 16: X, represents the non-oil exports in volume; D ∗
The paper investigates if the most popular alternative to the purchasing parity power approach (PPP) to estimate equilibrium exchange rates, the fundamental
