654
Chapter 67
Lessons Learned from
Blind Individuals on
VideoDescription
Claude Chapdelaine 1, Anne Jarry 2 1 CRIM, 2 School of Optometry-University of Montreal Montreal (Quebec), Canada
ABSTRACT
Audio-visual contents are made accessible to blind individuals with added videodeseription (VD) that translate the visual information into auditory information. We interviewed ten legally blind individuals (with and without residual vision) to monitor the quantity and frequency of infonnation needed in YD. It was found that residual vision and the complexity of the content have a significant impact of the level of VD needed. This suggests that a tool for the dis semination of VD must provide a basic level of information and also offer enough flexibility to confirm some information on demand.
Keywords : Blindness and Visual Impairment, Videodescription, Verbal Protocol Analysis
I NTRO D U CTI O N
Our research is concerned by the processing of audio-visual information done by blind and visually impaircd individuals when viewing television and film for learning or entcrtailID1ent purposes. Audio-visual contcnt such as television and film arc made accessible to them by producing additional audio information which dcscribes the relevant visual information. This added information is callcd audio description or video description (VD). In the five past years, CRIM has been
655
developing tools for VD production and dissemination that aims at Immmlzmg production time while integrating a comprehensive understanding of the cognitive and memory capacities of the intended population through many users testing.
Our actual study aims to establish from a diverse population of congcnitally and late blind individuals the level of VD needed. We want to identify 1 ) what is the information needed, 2) how much and 3) when. In short, we are seeking their definition of an effective VD to achieve an understandable and enjoyable expenence.
We repOli on the method and the results of phase I of our study involving blind individuals classified as levcl 3, 4 and 5 by the World Health Organization (WHO) . In the coming year, a second group of participants of levcl 1 and 2 will be interviewed to complete the entire study with intended audience for YD.
AU D I O -V I S UAL I N F O RM AT I O N P RO C ES S I N G BY
B L I N D I N D IVI D U ALS
The WHO classifies visual deficiency into five levels. Level 1 is for degree of acuity lesser than 20170 or a field of view (FOV) less than 60 degrees after conection. Levcl 2 is for acuity lesser than 20/200 or a FOV less than 20 degrees ; level 3 i s for acuity less than 20/400 o r a FOV less then 1 0 degrees; level 4 is for acuity less than 2011 200 or FOV less then 5 degrees. Level 5 means no remaining vision (Mergier, 1 999).
Levels 1 and 2 are persons with remaining functional vision, often refened to as persons living with low vision. When it comes to maximizing the use of their remaining vision, the most important variables to adjust are illumination and contrast (Ponchillia, 1 996). As for persons in the level 3, they have a slight remaining functional vision. They have severe low vision and are sometimes classified as blind or visually impaired. For levels 1 , 2 and even more for level 3, a combination of visual, auditory and tactile system may be needed to successfully complete a task. For example, with a computer, a large screen with magnification and a voice synthesizer will often be needed depending on difrerent factors such as document length, fatib'11e level, etc. (Prcsley, 2009). For watching TV, sitting close to a high quality LCD or plasma screen, with reduced illumination and good contrast is a must for people with mild to severe vision loss. Good and easy to follow auditory content with little auditory conflicting messages is al so very useful to confirm what is partially seen for person in the level 3 category.
Levels 4 and 5 bring together persons using only auditory or tactile mechanism to access information. Level 4 means light perception and seeing forms with high contrast. Level 5 means no vision. For these two levels, a combination of auditory and tactile system may be needed to successfully complete a task. A voice synthesizer and/or a Braille display will be necessary when using a computer (Presley, 2009). For watching TV, good and easy to follow auditory content with little auditory conflicting messages is almost mandatory.
Classification based on FOV and acuity results are useful for statistical purposes. However, there is great variability within the levels since visual
656
impairment takes many forms and can be seen in many various degrees . Other factors have to be taken into account such as when the deficiency occurred if not congenital. Sadato (2002) found that individuals who lost their sight before the age of sixteen could redirect their primary visual cortex from processing visual input to tactile input.
The degree of visual residue and the adaptation of the blind individual will have a tremendous impact on his ability to process information since the human sensory system has limitations when processing quantity and quality of the information. It also have a preference, Colavita ( 1 974) found the visual dominance effect, proving that humans show a strong tendency to rely more on visual information in a multichannel environment. However, when this predominance is lost, the individual must rely on the auditory channel which is omnidirectional and transient (Wickens, 2000). This very nature of the audio modality has a huge impact on the cognitive capacities of the blind people. Research show that blindness modifies the way information is processed and that auditory, tactile and kinesthetic channel will be central (Gouzman, 2000). Rokem and Ahissar (2008) found that congenitally blind individuals have higher auditory and memory capacities than sighted people. They were more resilient to noise and bettcr at frequency discrimination which allow them to reach better spcech perception. This advantage also fosters a short-tcrm memory advantage. So, in order to make sense of the world in which we live in, individuals with little or no vision will listen carefully to auditory information and they need a form of translation for the visual information which is the role of VD.
O N C REATI N G VD
The production of VD requires that videoscripters insert description of relevant visual elements in the gaps between dialogues . This subj ects VD to complex timing constraints since it is dependent on the frequency and length of available gaps. All relevant elements cannot be described, thus a choice must be made and is usually guided by the story line or can be inspired by the existing guidelines. However, adding VD of a visual cue among an already existing audio track is not without hurdle. The VD may not be synchronized without masking other relevant sounds (such as a door opening) and not covering too much of the music to eliminate all ambiance. Furthermore, the VD should at best be synchronized with the image that is being described and this could be impossible if it occurs during a dialogue.
Scripting VD is a challenging task with only a few emerging guidelines (Of com, 2000) (ADS, 2009) (Morisset, 2008). These guidelines are often based on intuition or convention which does not provide indications why some VD may be more effective than others (Braun, 2008). Therefore, there is a need for user-oriented research to clarify guidelines. Research on VD is fairly recent and is mostly conducted on VD done by professionals seeking to understand how visual cues could be translated into words. Turner ( 1 998) proposed a VD typology to emieh film indexing and help to automate VD production (Turner, 2008). He analyzed 1 1 productions of various types and found that most of the information types given in VD are composed of action/movement, character identification, description of the surroundings, expressions of emotion, and textual infonnation included in the
6 5 7
image. Piety (2004) demonstrated how the constraints imposed on VD production create a distinctive usage of language that has its own form and function. Salway (2007) showed the linguistic relation of frequent VD words to the characters, the action and the scene. Peli ( 1 996), Pettit ( 1 996), Schmeidler (200 1 ) and Ely (2006) proved that VD is valuable and appreciated by the visually impaired. Up to now, those researches give many insights on the nature of the VD but little is known on the effectiveness of VD to convey meaning to the intended audience (Piety, 2004).
M ETHO D
In our prior work (Gagnon, 2009), the feedback of blind and visually impaired individuals to whom films with VD were presented, suggested that various VD levels must be offered to accommodate a broad range of vision problems and individual differences. In a more recent work (Chapdelaine, 2009), we presented films with two levels of VD (standard and extended) . The visually impaired and the congenitally blind individuals stated that they required less VD and preferred the standard level while the late blind individuals preferred the extended version. Furthermore, individuals with residual vision reported that they found annoying or confusing the VD when it was not synchronized with the image. Those results indicated that a more user-oriented study was needed to identify what would be an efficient VD for them.
P roced u re
We conducted a user study using verbal protocol analysis. The design scenario aimed a reproducing the context of watching television for a legally blind individual (participant) with a sighted person (experimenter). A brief synopsis of the video was read to the pat1icipants before viewing. Participants could ask questions before and during viewing. After the viewing, participants were asked to summarize what they remember as if telling the story to a friend. This was used to build the mental representation of their comprehension. If concepts were omitted, the experimenter could ask a related question to know if the concept was understood or not.
The verbal protocol was analyzed to extract all the requests made by the participants and they were classified into two groups . A first group included all requests that were made to confirm information, for example: "It is Marc speaking?" The second group included all the requests that were an inquiry on something in the content, sLich as: "Where is this happening?", "What is the man doing?" Both groups were further classified into six types of information: who, where, action, facial expression, description, explanation of sound or speech.
The summary made by participants and their answers to the questions of the experimenter were used to build a mental representation. \Ve favored the landscape model approach for which Roskos-Ewoldsen et al. (2003) confirmed its adequacy to describe the mental representation of TV series. The concepts extracted from the model of each participant were compared to the concepts collected from the models of four sighted persons (control group) who summed up what they remembered
6 5 8
from their viewing. The inter-reliability among sighted VIewers on concept identification was 94% after discrepancies were resolved.
Pa rtici pants
The individual sessions were done with ten participants divided into two groups. Group A was composed of five individuals who could be classified WHO' s levels 4 and 5 (2 congenitally blinds, 2 late blinds before than age of 1 6 and 1 late blind for more than 1 0 years). Group A was between 3 6 and 65 years old and they all rep0I1ed listening to less than five hours of television per week. All of them except one stated that they rarely watch television alone. Three of them wished that the level of VD would be less while the remaining two were satisfied with the actual level.
Group B was composed of five legally blind individuals with some residual vision (level 3 of WHO) . They reported being able to detect a human face, some of them could identify a movement done by one person but would be confused if it was a group. They all statcd that they needed to be very close to the screen and that image contrast played a very important role in their ability to identify anything. They are all between 46 and 65 years old. Three of them often watch television alone while the remaining two rarely did so alone.
Participants of both groups had experiences with VD and they all preferred VD to a human reporter. Everyone stated that the more important information that should be described in VD was: who is talking, what is the action and when relevant where is the action taking place, the facial expression of the actors and the description of specific obj ects.
Corpus
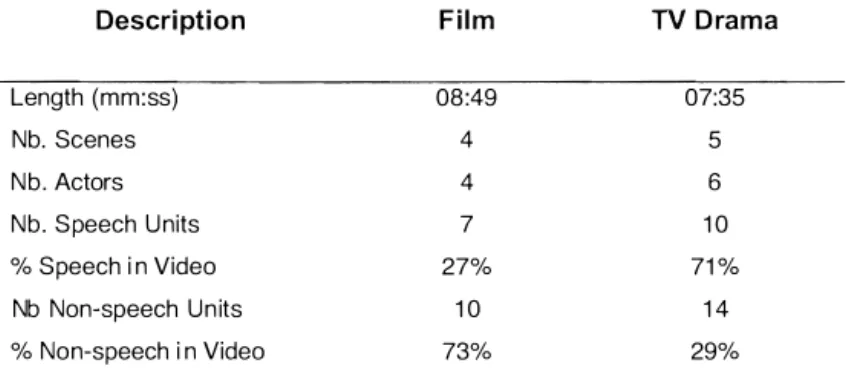
Two videos were shown to all participants. One was a short film telling the story of a man meeting a woman on a beach. The second was an excerpt of a TV drama about the life of three dooll11en.
The film had 4 main actors with no secondary actors and one scene in a public place. It contained a long scene without speech and was almost without background noise except music. In that scene, action was happening and we expected that it would be difficult for blind people to imagine the action without any residual vision. The TV drama had three main actors with four secondary actors and two scenes with a crowd. All the scenes had many dialogues often set in very nOISY enviromnents which added strong background noise. It contains very few non speech segments.
659
Table
1
Description of CorpusDescri ption F i l m TV D rama
Length (mm:ss) 08 :49 07:35 Nb. Scenes 4 5 N b . Actors 4 6 Nb. S peech U nits 7 1 0 % Speech i n Video 27% 71 % Nb Non-speech U n its 1 0 1 4 % Non-speech i n Video 73% 29%
R ES U LTS
We report on the analysis of requests made by Group A and B classified either as confirmation or as inquiry. We also present results on the distribution of these requests among the different information types. Finally, we compare the concepts found by the control group against the concepts stated by each participant.
An a l ysis of Req u ests fo r Confi rmati on versus I n q u i ry
As shown in Table 2, Group A made the maj ority of request while viewing the film (60.4%) as opposed to Group B who made only 3 9 . 6% of the request. This was a predictable outcome since the film had a long scene without speech that was expected to be less accessible to individual without residual vision. This is further confirmed by the fact that 60 .7% of the requests made by Group A were to inquire about information as opposed to the requests of Group B which were mostly to confirm information (67.3%). Indeed, a request to confirm is also an indication of a lesser need for information since the person knows but may need reassurance to avoid confusion, as opposed to an inquiry that is needed to avoid misunderstanding or being loss.
Tab l e 2 Percentage of req u ests per fi l m per gro u p
Group A G roup B
% of % to % to % of % to % to
request confi rm inquire req uest confirm inquire
Film 60A 39.3 60 .7 39.6 67.3 32.7
660
The behavior of both groups is much more similar when we look at the results obtained for the TV drama. Indeed, Group B made almost as much requests as Group A (5 1 .6% and 48 .4% respectively) . This is probably caused by the greater complexity of the vidco itself. The TV drama had more actors than the film and dialogues were long with noisy background. Also, some sccncs were happening at night which meant less contrast in the images and therefore less discriminating elements were available to Group B . This explains why Group B made as much requests to confirm as they made inquiries (49.2% and 50.8% respectively). As for Group A, they made significantly more requests (55 . 7%) to confirm information rathcr than to inquirc (44.3%) indicating that with complex content they also need more feedback.
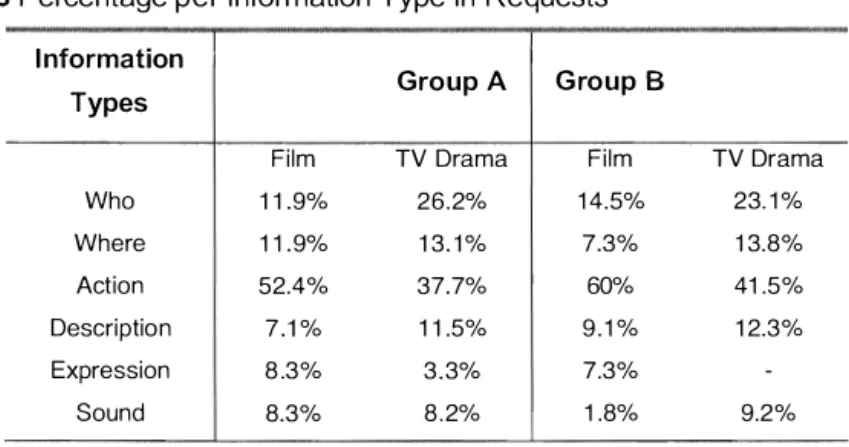
Ana l ysis of Req u ests Distri buted a mo n g I nfo rmation Types
Table 3 shows the requests perccntage made per information type. For the film, we observed that the majority of requests were about the action for both groups (Group A with 52.4% and Group B with 60%) . This indicates that for both groups, some cues help them identified the actors since this is their most desircd information. In this case, it seems the small number of actors made identification easy for individual who needed lcss indications about who was in the scene ( 1 1 .9% and 14.5%) and also where the scene was taking place ( 1 1 . 9%, 7.3%) . A more detailed analysis of the request on action revealed that for Group A, 68.2% of these were inquiries and in Group B, 66.7% were confirmation of action.
For the TV Drama, the requests on action were not as numerous as for the film (3 7.7% in Group A, 4 1 .5% in Group B). We observed that requests are distributed among the other types (by order of importance) : who, where, description and sounds. The larger number of actors in the TV Drama had a significant impact since the request for identification is more than double for Group A ( 1 1 .9% for the film versus 26.2%) and slightly less for Group B ( 1 4.5% for the film versus 23 . 1 %).
Table 3 Percentage per I nformation Type in Requests
I nformation
Types Group A G roup B
Film TV Drama Film TV Drama Who 1 1 .9% 26.2% 1 4.5% 23. 1 % Where 1 1 . 9% 1 3. 1 % 7.3% 1 3.8% Action 52.4% 37.7% 60% 41 .5% Description 7 . 1 % 1 1 .5% 9 . 1 % 1 2.3% Expression 8 .3% 3 . 3% 7.3% Sound 8.3% 8 . 2% 1 .8% 9.2%
6 6 1
The noisy background had a stronger impact o n Group B than on Group A. Indeed, requests for what has been said or to identify a sound (for example: hair dryer, opening of white cane) has been constant in Group A for both video (8.3% for the film and 8.2% for the TV Drama) . However, we observed in Group B that those requests were only of 1 . 8 % in the film but they increased significantly during the TV Drama (9.2%) . Those results indicates that Group B adopted a behavior similar to Group A when confronted to a complex content that would not provide them with discriminating visual elements they needed.
Analysis of M enta l Representations
The control group had identified 1 2 concepts for the film and 14 for the TV drama (Table 4). For both groups, we observed that stated concepts are about the same on average for both video (8.2 and 8 . 1 respectively) even if the TV Drama had two more concepts than the film. This again points to the more complex content of the TV Drama compared to the film.
Table 4 Percentage of fou n d concepts .
Film TV D rama
Control group Both Groups Group A
Total nb. of concepts Average Average 1 2 1 4 8.2 8 . 1 9.0 8.6 Group B Average 7.4 7.6
The results revealed that Group B omitted on average more concepts than Group A for both films (7.4 over 9.0 for the film and 7 . 6 over 8 . 6 for the TV Drama). To assume that this indicates that Group A had a better understanding of the video than the Group B would be a hasty interpretation of the data. Indeed, a correlation of this data with the confirmed requests done by Group B indicates that most of omitted concepts (62%) were in the confirmation request. This indicates that Group B did understand the concepts but simply did not state them in their summary. Further study is needed to understand why those concepts were omitted from their summaries, could it be that they were judge irrelevant or that they were forgotten.
On average, Group A stated more concepts that Group B and thi s could partially be explained by their better memory capacities. Indeed, as mentioned earlier (Sadato, 2002) there is evidence that suggests that congenital blinds and potentially the late blinds before the age of 1 6 could store more information in their memory than late blind after the age of 1 6. Since four of the five persons in Group A meet this criteria than these individuals would have been able to recall more concepts.
662
D I S C U SS I O N S
How much information i s enough s o that a blind individual can enj oy watching a movie or television? This is the basic qucstion this study has addressed. First, we found that the individuals without residual vision and who preferred to have less VD were the ones who asked the greater number of questions. This implies that they need a certain quantity that is more than what they expect. Thcir bctter performance in the mcntal rcpresentation analysis suggests that they have better memory capacities which probably required a lot more attention. So their claim may not be about getting less VD but more a preoccupation that VD should not require more attention and thus changing an entertainment into an ordeal .
The basic quantity of VD needed would probably be less for individuals with residual vision. However, we found that when viewing conditions are not optimal, the advantage of individuals with residual vision is quickly overturned. In this case, they will need about the same amount of information as individuals without residual vision. Another interesting outcome of our study is the high percentage of request to confirm information made by the individuals with residual vision. It demonstrates perfectly the statement of Dr. Colenbrander (2006) that a person will use his vision and remaining vision until there is no vision left. Furthermore, a request to confirm is an indication of a lesser need for information since the person has perceived or deducted the information but still is seeking reassurance to avoid confusion.
Based on those results, we concluded that any tool that would disseminate VD should not only provide a basic quantity of infonnation but also that it must offer the possibility to confirm infonnation on demand.
Our next step is to conduct other interviews with individuals with low vision that are classified level
I
and 2 by the WHO . Our aim is to gain a comprehcnsive understanding of thc cognitive and memory capacities of a large spectrum of individuals with visual impairments to assess their need for VD and to design tools that are truly accessible.R E F E RE N C ES
ADS (2009). Guidelines for audiodescription (initial draft of May 2009). http://www.adinternational.org/ad.html
Braun, Sabine (2008). Audiodescription research: state of the art and beyond. Translation Studies in the New Millennium, Vol. 6, 1 4-3 0.
Chapdelaine, c., Gagnon, L. (2009). Acccssible Videodescription On-Demand. In Eleventh Intcrnational ACM SIGACCES S (AS SETS'09) . Pittsburgh, P A, USA, October 26-2 8 .
Colavita, F.B. ( 1 974) Human sensory dominance. Perception and Psychophysics, 1 6, 409-4 1 2.
Colenbrander, A. (2006) How blind is blind? Smith-Kettlewell Eye Research Institute. http://www.mdsupport.org/presentation-howblind l lindex.html
663
Ely R., Emerson R. W., Maggiore T., O'Connell T., & Hudson L. (2006). Increased content knowledge of students with visual impairments as a result of extended descriptions. Journal of Special Education Technology, 2 1 (3), 3 1 -43 .
Gagnon L., Foucher S . , Heritier M., Lalonde M . , Byrns D., Chapdelaine c., Turner 1, Mathieu S., Laurendeau D . , Nguyen N.T., Ouellet D. (2009) Towards Computer-Vision Software Tools to Increase Production and Accessibility of Video Description to Visually-Impaired People, Universal Access in the Information Society, Springer-Verlag, Vol 8, no. 3, 1 99-2 1 8 .
Gouzman, R. and Kozulin A . (2000) Enhancing Cognitive Skills in Blind Learners. The Educator: 20-29.
Mergier, 1 ( 1 999) Le classement OMS des d6ficiences visuelles, http ://www.irrp.asso.fr/articles/aliicle007.html Davis, G.A., and Nihan, N.L. ( 1 99 1 ) , "Nonparametric regression and short-term freeway traffic forecasting." Journal o/ Tran::,portation Engineering, ASCE, 1 77(2), 1 78-1 8 8 .
Morisset L . , Gonant F. (2008). Charte d e l'audiodescription. http ://www.travail solidarite.gouv. fr/IMG/pdf/Charte _de _1_ audiodescription _300908 .pdf Of com (2000). ITC Guidance on Standards for Audiodescription.
http://www.ofcom.org.uk/tvlifi/guidance/tv _ access_serv/archive/audio _ descri ption _ stnds
Peli E., Fine E. and Labianca A. ( 1 996). Evaluating visual information provided by audio description. JVIB 90: 5 . 3 7 8 -3 8 5 .
Pettitt B . , Sharpe K . and Cooper S. ( 1 996). AUDETEL: Enhancing television for visually impaired people. BJVI 1 4:2. 48-52.
Piety, P . (2004). The language system of audio description: an investigation as a discursive process. JVIB 9 8 : 8 . 45 3 -469.
Ponchillia P.E., Ponchillia, S.V. ( 1 996) Foundations of Rehabilitation Teaching with P ersons Who Are Blind or Visually Impaired, AFB Press, 432 pp. Presley, r., D'Andrea, F.M. (2009) Assistive Technology for Students Who Are
Blind or Visually Impaired: A Guide to Assessment, AFB Press, 500 pp. Rokem, A. and Ahissar M. (2008) Interactions of cognitive and auditory abilities in
congenitally blind individuals . Neurophychologia, 47, 843-848 .
Roskos-Ewoldsen B . , Roskos-Ewoldsen D. R. and Yang M., (2003). Testing the Landscape Model of text comprehension. Paper presented at the annual meeting of the International Communication Association, San Diego, CA. Salway, Andrew. 2007. "A Corpus-based analysis of the language of Audio
Description" . In Media for All, Diaz Cintas, Jorge, Pilar Orero and Aline Remael, eds. 1 5 1 - 1 74.
Tumer, 1 , and Mathieu S . (2008) . Audio description text for indexing films. International Cataloguing and Bibliographic Control 3 7 , no. 3 (July/September), 52-5 6 .
Turner, J. ( 1 998). Some Characteristics o f Audio Description and the Corresponding Moving Image. Proceedings of 6 1 st ASIS Annual Meeting, vol. 3 5 , 1 08- 1 1 7. Medford, NJ: Information Today.
Sadato, N., Okada, T . , Honda, M., and Yonekura, Y. (2002) Critical period fro cross-modal plasticity in blind humans : A functional MRI study. Neuroimage, 1 6, 3 89-400 .
664
Schmeid1er E. and Kirchner C. (200 1 ) . Adding audio-description: docs it make a difference? JVIB 95 :4. 1 97-2 1 2 .
Wickens, C.D., Holland J.G. (2000) Engineering Psychology and Human Performance,