HAL Id: hal-01955230
https://hal.archives-ouvertes.fr/hal-01955230v1
Submitted on 14 Dec 2018 (v1), last revised 20 Feb 2019 (v2)
HAL is a multi-disciplinary open access
archive for the deposit and dissemination of
sci-entific research documents, whether they are
pub-lished or not. The documents may come from
teaching and research institutions in France or
abroad, or from public or private research centers.
L’archive ouverte pluridisciplinaire HAL, est
destinée au dépôt et à la diffusion de documents
scientifiques de niveau recherche, publiés ou non,
émanant des établissements d’enseignement et de
recherche français ou étrangers, des laboratoires
publics ou privés.
Reliability Improvement of Odour Detection Thresholds
Bibliographic Data
Pascale Montreer, Stefan Janaqi, Stéphane Cariou, Mathilde Chaignaud,
Isabelle Betremieux, Philippe Ricoux, Frédéric Picard, Sabine Sirol, Budagwa
Assumani, Jean-Louis Fanlo, et al.
To cite this version:
Pascale Montreer, Stefan Janaqi, Stéphane Cariou, Mathilde Chaignaud, Isabelle Betremieux, et al..
Reliability Improvement of Odour Detection Thresholds Bibliographic Data. IPMU 2018 17th
Inter-national Conference on Information Processing and Management of Uncertainty in Knowledge-Based
Systems., Jun 2018, Cadiz, Spain. pp.562-573, �10.1007/978-3-319-91473-2_48�. �hal-01955230v1�
Reliability Improvement of Odour Detection Thresholds
Bibliographic Data
MONTREER P.1*, JANAQI S. 2, CARIOU S. 1°, CHAIGNAUD M.3*, BETREMIEUX I.4*, RICOUX P.4°, PICARD F.5, SIROL S.6* ASSUMANI B.6°, and FANLO J.L.1,3°.
1
IMT Mines Alès, LGEI laboratory, 6 av. de Clavières, 30100 Ales, France
*[email protected]; °[email protected]
2 IMT Mines Alès, LGI2P laboratory, 6 av. de Clavières, 30100 Ales, France
3 Olentica SAS, 17 rue Charles Peguy, F-30100 Ales, France
*[email protected]; °[email protected]
4 Total S.A, 2, place Jean Millier, La Défense 6, 92078 Paris La Défense Cedex, France
*[email protected]; °[email protected]
5 Hutchinson S.A., Rue Gustave Nourry, 45120 Châlette-sur-Loing, France
6 Total Feluy, Zone industrielle Feluy C, 7181, Belgique
*[email protected]; °[email protected]
Abstract
Odour control is an important industrial and economical issue as it is a criterion in purchase and use of a material. The minimal concentration of a pure compound allowing to perceive its odour, called Odour Detection Threshold (ODT), is a key parameter of the odour control. Each compound has its own ODT. Literature is the main source to obtain ODT. Nevertheless, there are a lot of compounds with no reported ODTs and when ODTs are available, they are marred by a high var-iability. Another expensive and time-consuming way to obtain ODT is the measurement. This paper proposes a validated cleaning methodology to reduce uncertainty of available ODTs. This methodology will be consolidated by our own experimental measurements. Next, we predict missing ODTs as a function of chemical and physical variables.
The proposed cleaning methodology leads to eliminate 39% of compounds with at least one ODT while conducting 84% of positive scenarios (on 37 compounds). The missing ODTs are predicted with an error of 0.83 for the train and 1.14 for the test (on a log10 scale). Given the uncertainty of data, the model is sufficient. This approach allows working with a lower uncertainty on available ODTs and predicts missing ODTs with a satisfactory model.
Keywords: Odour Detection Thresholds (ODT), Data mining, Reliability,
1
Introduction
In the industrial environment, there is a growing need to identify compounds responsi-ble for an unpleasant odour. This identification depends firstly on the Odour Detection Threshold (ODT) of each compound. We define ODT as the minimal concentration of a pure compound allowing to perceive its odour.
The principal source of ODTs is the literature [1, 2, 3, 4, 5, 6]. But, in literature, there are a lot of compounds with no reported ODTs and when ODTs data are available, they present a high variability. This situation implies a high uncertainty of ODTs.
This variability can be illustrated with the butyl acetate example whose ODT values range from 0.030 mg/m3 to 480 mg/m3 for 14 publications [6].
The variability could potentially be explained by a set of parameters such as: difference of methods; existence and year of normalization; sample quality; environmental condi-tions, culture of authors; panel selection and their intrinsic diversity; panel correction, etc. Given all these potential sources of variability, there is a need to improve the reli-ability of these data. Unfortunately, the sparsity of these data makes most of the poten-tial interesting statistical tools unusable. This sparsity comes from non-uniformity of the information from one author to another.
Several papers have already highlighted this issue [2, 3] and have tried to compare publications [9] but usually, researchers make a subjective sorting or simply use the mean of values [3, 5]. But, in any event, even if dataset is used without cleaning, neither the mean or the geometric mean nor the density application is justified if the ODT val-ues distribution is not identified.
As a consequence, our paper aims to find relevant methodology allowing improving the reliability of these data. This improvement gathers an approach aiming to decrease the variability of available ODTs by a cleaning methodology. Next, we complete not reported compounds by a predictive modelling of ODTs as a function of chemical / physical variables. Explicative variables generated by the methodology are precise op-posed to bibliographic ODTs.
2
Methodology
2.1 Software
The ODT values from the literature are collected in an Excel sheet and the reliability improvement is realized on the R software.
2.2 Database Construction
To analyze ODT, a database is constructed (Fig. 1). This database gathers quite a few volatile and odorous compounds. These compounds constitute the rows of the database.
For each compounds, a state of art of ODTs is done to identify publications containing ODT information [6]. These publications constitute the columns.
Fig. 1. ODT values (mg/m3) database format
This database will be the support of the uncertainty reduction and prediction. To date, it contains 161 publications (columns) and 1 254 compounds (rows) including only 650 compounds with at least one ODT available.
2.3 First Step of Cleaning: Provisional Publications’ Isolation
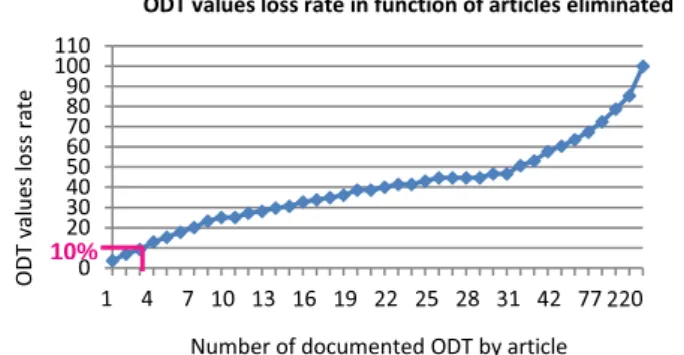
The first step consists in eliminating the least reliable studies. Ideally, it would have been relevant to consider only studies containing a reliable repeatability of measure-ments. In this way the Cochran test based on the standard deviation of each article would have been applied [11]. Unfortunately, this information is rarely available. Con-sidering only studies with available repeatability is therefore too restrictive. Conse-quently, we use the criterion of number of ODT measurements realized per study. In-deed, we have noticed that the higher the number of ODT determinations in a publica-tion, the better the technique of analysis was described, and hence the more reliable the results. It was decided to eliminate ten percent of the total values of the database and that corresponds to publications containing less than four ODT values (Fig. 2).
Fig. 2. ODT values loss rate in function of publications eliminated
ODTs (mg/m3) 1254 c o lle ct ed co m po un ds 161 Articles 0 10 20 30 40 50 60 70 80 90 100 110 O D T v al ue s lo ss r at e
Number of documented ODT by article
ODT values loss rate in function of articles eliminated
2.4 Second Step of Cleaning Methodology: ODT Outlier Elimination 2.4.1. Outliers Definition in the Context
To define an outlier in this context, the ODT values distribution has to be defined. On the basis of an expert observation on well-known molecules, the hypothesis is that for each given compound, ODTs follow a normal distribution.
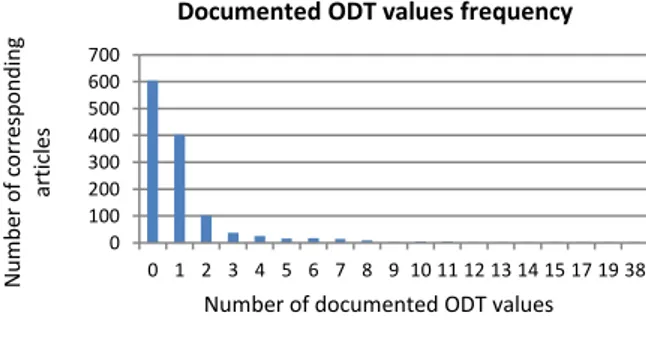
Considering the low amount of ODT values per compound (Fig. 3), the most suitable solutions to observe this distribution, are the Kernel Density Estimation (KDE) and the QQplot representation of the eleven compounds with more than ten ODT values after the first step of the cleaning.
Fig. 3. Reported ODT frequency
The KDE is calculated with the “geom_density” function and the QQplot with “qqnorm” function. The correlation coefficient (CC) of QQplot of these compounds is calculated (Fig. 4).
Fig. 4. Correlation coefficient of the QQplot of compounds with more than 10 ODT On this Fig. 4 the higher the correlation coefficient is, the more likely the distribution is normal. These results encourage applying a normal test on values to detect outliers.
0 100 200 300 400 500 600 700 0 1 2 3 4 5 6 7 8 9 10 11 12 13 14 15 17 19 38 N um be r o f c o rr esp o nd ing ar ti cl es
Number of documented ODT values Documented ODT values frequency
0,00 0,10 0,20 0,30 0,40 0,50 0,60 0,70 0,80 0,90 1,00 C C o f QQp lo t g rap h
Compounds with more than 10 ODT values CC of QQplot graph of compounds with more than 10 ODTs
The inter-laboratory reproducibility Grubbs test is applied [11]. The confidence level chosen is 95%.
2.4.2. Outliers Values Elimination According to Normal Distribution
The Grubbs test is not applicable with less than three values [12]. In this way, only compounds measured more than twice can be compared with the rest of the database. Thereafter, ODTs of these compounds are considered as the “tested” ODTs. That im-plies that some compounds’ relevance cannot be analyzed at this step.
Another rule of comparison has to be set up. This is an extension of the cleaning meth-odology to the elimination of publications outliers. This next rule was guided by the fact that, at the previous step, the eliminated ODT values often belong to the same pub-lications.
2.5 Third Step of Cleaning Methodology: Publication Outliers Elimination
At this step, the relevance of each publication is measured by the number of exclusion of that article at the second step. An index is calculated for each author: the exclusion frequency ratio in equation (1).
𝐄𝐅𝒋=
𝑁𝑂𝐷𝑇 𝑒𝑥𝑐𝑙𝑢𝑑𝑒𝑑𝑗
𝑁𝑂𝐷𝑇 𝑡𝑒𝑠𝑡𝑒𝑑𝑗 × 100
𝑬𝑭𝒋 : Exclusion frequency of the jth publication
𝑵𝑶𝑫𝑻 𝒆𝒙𝒄𝒍𝒖𝒅𝒆𝒅𝒋 : Number of ODT values of the jth publication excluded by
Grubbs test
𝑵𝑶𝑫𝑻 𝒕𝒆𝒔𝒕𝒆𝒅𝒋
: Number of ODT values tested in the jth publication
(1)
The ODT values of publications have not been compared in the same way. That’s why a “tested rate” is calculated. For each publication, this “tested rate” is defined as the percentage of tested ODTs among all of the ODTs of this publication. Indeed, the higher the “tested rate” is; the better the 𝐸𝐹’s reliability is.
First, publications with “tested rate” under 1/3 are eliminated. Then, after a Hierarchical Ascendant Classification (HAC) applied on the EF of selected publications, the Ward’s distance index [13] is used. This classification allows to statistically separate publica-tions based on EF values. The dendrogram and the SPRSQ graph are used to determine the number of groups. The group containing the lowest EF is finally retained.
2.6 Validation of the Cleaning
ODT of 44 compounds were measured experimentally in our laboratory to validate the relevance of this cleaning. These ODT were measured using the norm EN 13725 [14]. For these 44 compounds, whose ODT values have been measured experimentally, 40 were reported in the literature. For these 40 compounds, three barycenters are defined:
the one of raw ODT values of the literature (X1), the one of remaining ODT values after the cleaning methodology application (X2) and the one of our experimental ODT values (X3). And then two differences are calculated: X1-X3 (Z1) and X2-X3 (Z2). These two differences are compared. This comparison allows to observe if the cleaning methodology leads to approach the experimental result.
To state on the relevance of the cleaning the criterion to select the “ideal” case is the mean of the log10 of the confidence interval obtained thanks the repeatability level of our experimental measurements.
2.7 Completeness of the Database by Predictive Modelling
The completeness of the database is based on a Quantitative Structure-Property Rela-tionship (QSPR) approach. This approach consists in predicting a variable (Y) as a function of chemical and physical certain variables (X). Here the Y variable is the mean value of log10 values of cleaned ODTs. Explicative variables X are essentially calcu-lated from the structure of compounds (66 variables). There are compositional and constitutional indexes (the number and nature of atoms, the molecular weight, the un-saturation), topological indexes which the majority are defined in Todeschini’s publi-cation [15] and electrotopological indexes as ZEP index [16].
The model approach is then divided in 2 principal steps. The first is a reduction of the number of significative input variables by a lasso technique. To predict Y as a function of X, a classical Support Vector Machine (SVM) model was constructed. Some “bad” observations was eliminated from this learning process.The partition of the dataset be-tween the train and test sets is made in order that the train represents 75% of the dataset and reflects the variance of this one.
3
Results and Discussion
3.1 Visualization of the Proportion of Missing Values of the Database
Fig. 5. Proportion of missing ODT values in the literature (a red zone corresponds to information
presence; a white zone corresponds to a lack of information)
The total proportion of missing values is 99%. This proportion enforces the inability to use statistical classification tools and implies the necessity to implement a more reliable methodology.
3.2 Result of the First Step
For the three “data cleaning” steps, information loss is presented from three perspec-tives (Table 1): the number of publications, the number of ODT and the number of compounds with at least one ODT. This choice is made because the most important information to monitor is the number of compounds with at least one ODT. Indeed, as it was presented, we want to predict the ODT behavior of all the compounds of the database (1254) with reported ones in literature. That’s why, it’s important to keep a satisfactory proportion of reported compounds.
Table 1. Information loss after the first step
Cleaning at the first step
Before After Information loss
rate
Nos. of publications 161 72 55%
Nos. of ODT 1501 1367 9%
The first step leads to isolate 55% of the publications. Even if half of the publications have been eliminated, only 3% of compounds with at least one ODT have been elimi-nated. This proportion is acceptable. The lack of reliability on these sources justifies to reject them.
3.3 Result of the Second Step
The Grubbs test is applied on compounds which ODT have been measured at least 3 times. Results of the information loss of this step are presented in Table 2.
Table 2. Information loss after the second step by Grubbs test
Cleaning at the second step
Before After Information loss
rate
Nos. of publications 72 72 0%
Nos. of ODT values 1367 1235 10%
Nos. of compounds with at least 1 ODT 631 631 0% There is only a slight loss of information on the ODT values (10%) and the two other rates are still constant. Furthermore, among this proportion, there is an average of 1.65 values eliminated per compound (over 80 compounds). This low percentage supports the use of a normal distribution.
3.4 Result of the Third Step
A summary of ODT elimination at the second step on all the 72 publications, will allow applying the third step. The focus is made on the Exclusion Frequency (EF) defined by the equation (1) and the “tested rate” defined in the 2.5 section.
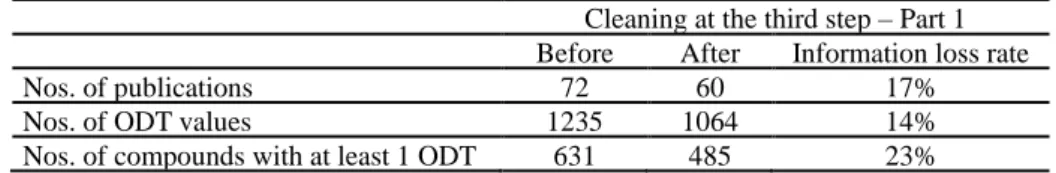
As it was mentioned in this section, publications with “tested rate” under 1/3 are eliminated. A first information loss summary is done after the elimination of these pub-lications with a “tested rate” lower than 33% (Table 3).
Table 3. Information loss after the elimination of publicationss with tested rate lower than 33%
Cleaning at the third step – Part 1
Before After Information loss rate
Nos. of publications 72 60 17%
Nos. of ODT values 1235 1064 14%
Nos. of compounds with at least 1 ODT 631 485 23%
The dendrogram of the HAC classification is applied on the EF of publications with a “tested rate” higher than 33% (Fig. 6).
Fig. 6. HAC on EF values dendrogram (red line: the optimal classification)
Thanks to the dendrogram and the SPRSQ graph, 3 groups were realized (Fig. 6). The information loss summary is done after the second part of the third step (Table 4).
Table 4. Information loss after the third step
Cleaning at the third step - Part 2
Before After Information loss
rate
Nos. of publications 60 33 45%
Nos. of ODT values 1064 701 34%
Nos. of compounds with at least 1 ODT 485 393 19% This third step is rather drastic because it eliminates 37.7 % of compounds with at least one reported ODT value in the literature.
Nevertheless, 393 reported compounds still remain, spread over 33 publications. The size of the database decreases with the increase of its reliability. Of course, we consider that it is better to work with less quantitative but more informative data.
3.5 Summary of the Cleaning Methodology
After the three cleaning methodology steps, the information loss statement is presented in Table 5.
Table 5. Information loss statement after three steps of the cleaning methodology
Total cleaning
Before After Total information loss
rate
Nos. of publications 161 33 79%
Nos. of ODT values 1501 701 53%
Nos. of compounds with at least 1 ODT 650 393 39%
C M .A. 2010b C M .A. 2008 W is e. al. 2007. M iy az aw a. al. 2009a H os hik a. al. 1993 Ahls tröm .al. 1986a Erik s s on. al. 1976 D on. 1986 St one. al. 1972 C M .A. 2010a C M .A. 2009ab R oos .al. 1985 C M .al. 2004 St one. 1963c Las k a. H uds on. 1991 C ain. al. 2007. et .2010 Z im er. al. 2000 H endrik s .1979 Geier. 1936 Goldenberg. 1967 C ain. Gent .1991 St uiv er. 1958 Sc hley .1934 Pas s y .1892abc M origuc hi. al. 1983 D rav niek s .al. 1986 N aus .1982 Z w aardem ak er. 1914. 1927 Anon. 1980 H ellm ann. Sm all. 1973. 1974 N agat a. 2003 J ung. 1936 D eadm an. Prigg. 1959 Lindell. 1991 Kös ter. 1971 Punt er. 1975. 1979 Ohm a. 1922 W illiam s .al. 1977 At anas ov a. .al. .2005 St ev ens .C ain. 1987a T em pelaar. 1913 H all. Anders on. 1983 Punt er. 1983 Am oore. 1977 D alt on. al. 2007 Van. Anrooij. 1931 H enning. 1924 Baldus .1936 Logt enberg. 1978 Bedborough. T rot t. 1979 N agy .1991 Las k a. R ingh. 2010 N is hida. al. 1979 C M .C .et .C M .. 1994 M os c handreas .J ones .1983 M olhav e. al. 2000 M ay .1966 Laing. 1975 D rav niek s .1974 Van. T hriel. al. 2006 C M .al. et .C M .1999 0 50 100 150
Authors's Hierarchical Ascendant Classification 's dendogram on the FE basis
hclust (*, "ward.D2") Authors H e ig h t
It can be noticed that a high percentage of publications is eliminated (79%) but it rep-resents almost the double of compounds with at least one ODT value in the literature (39%). The amount of total eliminated data is 53%. These rejected data have been con-sidered irrelevant by our specific approach.
3.6 Validation of the Cleaning Methodology with Measured ODT
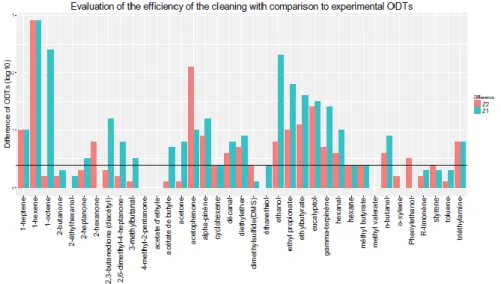
After the cleaning, the ODT value of 3 compounds out of 40 was totally eliminated and we make the comparison on the 37 remaining compounds. The mean of the repeatability of our measurement calculated in a log10 scale is 0.4. The ODTs obtained are then compared to this value as it was explained in the 2.6 section (Fig. 7).
Fig. 7. Comparison of the cleaned values and the raw values of literature with our experimental
values (red: cleaned ODT difference; blue: raw ODT difference)
Many scenarios are recorded (Table 6) thanks to the graph of comparisons (Fig. 7).
Table 6. Summary of the evolution by the cleaning methodology
Scenario 1
Improvement of the value …
… even if it was already correct 5 cases
Scenario 2 … which leads to a correct value 6 cases Scenario 3 … but the value still not correct 10 cases
Scenario 4 No improvement of the value …
… but it was already correct 7 cases
Scenario 5 … and still not correct 3 cases Scenario 6
Degradation of the value …
… but it still correct 3 cases
Scenario 7 … but it still not correct 1 cases Scenario 8 … becomes not correct 2 cases
Initially, 16 compounds were in the range of the measured ODT. After the cleaning, there are 21 compounds (out of 37 compared compounds). This is a first positive added value of the cleaning methodology.
Furthermore, it can be considered as positive situation after the cleaning the scenarios 1, 2, 3, 4 and 6 (Table 6). These cases represent 84% of positive cases (31 compounds out of 37). The worst scenario is the number 8. Despite of 6 compounds, this cleaning seems appropriate to decrease the uncertainty of available bibliographic ODT data.
3.7 ODTs Prediction
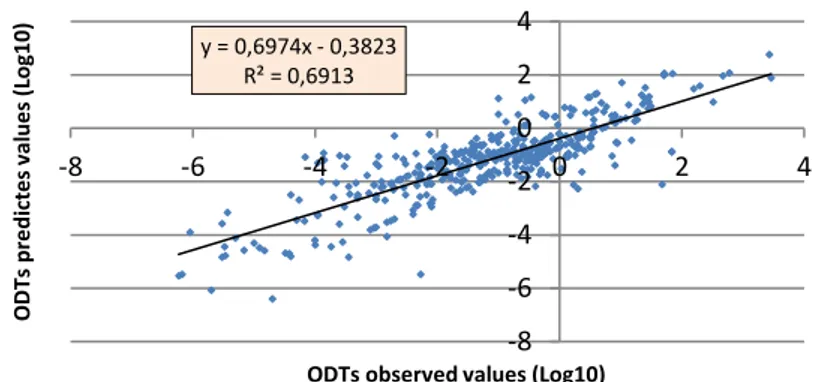
Applying lasso technique leads to eliminate 22 variables (out of 66) and SVM leads to a model with an error, in a log10 scale, of 0.83 on the train and 1.14 on the test with compounds eliminated (Fig. 8). As a matter of fact, among all the predictions, only less than 2.5% of observations was abnormally predicted in comparison with the others.
Fig. 8. ODTs predicted in function of ODTs observed
Given the uncertainty of ODT of most of compounds, the model is satisfactory as it predicts the ODT with a log10 error about 1. To our knowledge this is the first global model to predict ODT as a function of molecular characteristics on this quantity of compounds. This is an encouraging result which has to however be improved thereafter.
4
Conclusion
In conclusion, the proposed cleaning methodology eliminates 39% of compounds with at least one ODT while conducting to 84% of positive scenarios on ODT values (vali-dation on 37 compounds). The missing ODTs are predicted with an error of 0.83 for the train and 1.14 for the test (on a log10 scale). Considering the data, it’s a satisfactory model. This approach allows working with a low uncertainty on available ODTs and predicts missing ODTs with a satisfactory model. This is an encouraging methodology.
y = 0,6974x - 0,3823 R² = 0,6913 -8 -6 -4 -2 0 2 4 -8 -6 -4 -2 0 2 4 O D Ts pre di ct e s val ue s (L og1 0)
ODTs observed values (Log10)
Thereafter, it would be interesting to strengthen the cleaning methodology with more measurements in our laboratory or a probabilistic validation.
The global predicting model of ODT seems satisfactory to odour experts. It will be improved further by complementary local approach and / or expert knowledge
5
References
1. LEONARDOS, G., KENDALL, D., BARNARD, N.: Odor Threshold Determina-tions of 53 Odorant Chemicals. Journal of the Air Pollution Control Association. 19, 91–95 (1969). doi:10.1080/00022470.1969.10466465
2. RUTH, J.H.: Odor Thresholds and Irritation Levels of Several Chemical Sub-stances : A Review, (1986)
3. DEVOS, M., PATTE, F., LAFFORT, P., VAN GEMERT, L.J.: Standardized hu-man olfactory thresholds. Oirl Press (1990)
4. ASTM: Odor Thresholds for Chemicals with Established Occupational Health Standards. (1997)
5. US EPA: Reference guide to odor thresholds for hazardous air pollutants listed in the clean air act amendements of 1990. (1992)
6. VAN GEMERT, L.J.: Odour Thresholds. , Zeist, The Netherlands (2011) 7. FALCY, M., MALARD, S.: Comparaison des seuils olfactifs de substances
chi-miques avec des indicateurs de sécurité utilisés en milieu professionnel. Hygiène et Sécurité au travail- Cahier de notes documentaire. 7–21 (2005)
8. ZARZO, M.: Effect of Functional Group and Carbon Chain Length on the Odor Detection Threshold of Aliphatic Compounds. Sensors. 12, 4105–4112 (2012). doi:10.3390/s120404105
9. PATTE, F., ETCHETO, M., LAFFORT, P.: Selected and standardized values of suprathreshold odor intensities for 110 substances. Chemical Senses and Flavor. 283–305 (1975)
10. TOROPOV, A.A., TOROPOVA, A.P., CAPPELLINI, L., BENFENATI, E., DAVOLI, E.: Odor threshold prediction by means of the Monte Carlo method. Ecotoxicology and Environmental Safety. 133, 390–394 (2016). doi:10.1016/j.ecoenv.2016.07.039
11. ISO17025: DémarcheISO17025,
http://www.de-marcheiso17025.com/fiches_techniques/test_grubbs_cochran.html
12. ASTM International: ASTM E178-00 Standard practice for dealing with outlying observation. (1994)
13. WARD, J.H.J.: Hierarchical grouping to optimize an objective function. Journal of the American Statistical Association. 58, 236–244 (1963)
14. AFNOR: Norme NF EN 13725. (2003)
15. TODESCHINI, R., CONSONNI, V., MANNHOLD, R., KUBINYI, H., FOLKERS, G.: Molecular Descriptors for Chemoinformatics. (2009)
16. BERINDE, Z., BERINDE, M.: On a matrix representation of molecular. CARPATHIAN J. MATH. 20, 205–209 (2004)