HAL Id: hal-00905118
https://hal.inria.fr/hal-00905118
Submitted on 16 Nov 2013
HAL is a multi-disciplinary open access
archive for the deposit and dissemination of
sci-entific research documents, whether they are
pub-lished or not. The documents may come from
teaching and research institutions in France or
abroad, or from public or private research centers.
L’archive ouverte pluridisciplinaire HAL, est
destinée au dépôt et à la diffusion de documents
scientifiques de niveau recherche, publiés ou non,
émanant des établissements d’enseignement et de
recherche français ou étrangers, des laboratoires
publics ou privés.
Experimental Study on the Energy Consumption in IaaS
Cloud Environments
Alexandra Carpen-Amarie, Anne-Cécile Orgerie, Christine Morin
To cite this version:
Alexandra Carpen-Amarie, Anne-Cécile Orgerie, Christine Morin. Experimental Study on the Energy
Consumption in IaaS Cloud Environments. 6th IEEE/ACM International Conference on Utility and
Cloud Computing, Dec 2013, Dresden, Germany. �hal-00905118�
Experimental Study on the Energy Consumption in
IaaS Cloud Environments
Alexandra Carpen-Amarie
INRIA - IRISA, Rennes, France [email protected]
Anne-Cecile Orgerie
CNRS - IRISA, Rennes, France [email protected]
Christine Morin
INRIA - IRISA, Rennes, France [email protected]
Abstract—Energy consumption has always been a major concern in the design and cost of datacenters. The wide adoption of virtualization and cloud computing has added another layer of complexity to enabling an energy-efficient use of computing power in large-scale settings. Among the many aspects that influence the energy consumption of a cloud system, the hardware-component level is one of the most intensively studied. However, higher-level factors such as virtual machine properties, their placement policies or application workloads may play an essential role in defining the power consumption profile of a given cloud system. In this paper, we explore the energy consumption patterns of Infrastructure-as-a-Service cloud environments under various synthetic and real application workloads. For each scenario, we investigate the power overhead triggered by different types of virtual machines, the impact of the virtual cluster size on the energy-efficiency of the hosting infrastructure and the tradeoff between performance and energy consumption of MapReduce virtual clusters through typical cloud applications.
I. INTRODUCTION
Modern data centers are continuously expanding as they attempt to accommodate the surging scientific and enterprise demand for computing resources. Driven by this fast-paced demand, the cloud computing paradigm has emerged as a key to leverage virtualization technologies and to enable a more efficient resource management. In this context, however, energy consumption becomes a critical concern for large-scale datacenters, as well as for the growing cloud infrastructures they host. While cloud computing holds the promise to deliver unlimited processing power on demand, its requirements for large-scale resources and the associated costs have shifted the research focus from optimizing performance to finding a tradeoff between performance and energy efficiency.
Existing works focus on profiling the energy usage of hardware components or the virtualization overhead introduced by cloud environments, yet fail to assess how the overall cloud energy consumption is impacted. More advanced works pro-pose consolidation and resource allocation strategies to build energy-efficient platforms. Nevertheless, they do not consider the effects of cluster customization and virtual machine (VM) settings on the platform power profile.
The goal of this paper is to investigate such aspects and to provide an in-depth understanding regarding energy consumption dynamics in Infrastructure-as-a-Service (IaaS) environments. Our main contribution is twofold. First, we provide an evaluation of two well known IaaS cloud platforms with respect to energy consumption. Second, we study the impact of virtual cluster management on the cloud power
profile. We discuss the effects of executing applications in customized virtual clusters both in terms of application per-formance and energy usage. Our objective is to provide users with a basis and a set of guidelines for making energy-aware decisions when selecting specific cloud infrastructures and VM configurations for typical cloud workloads. Our findings can serve as a starting point to build higher-level services capable of achieving overall energy reductions at the cloud level, while delivering the same performance to the users.
The reminder of this paper is structured as follows. Sec-tion II provides a review of the existing approaches to optimize energy consumption in IT infrastructures. In Section III, we introduce the cloud platforms we investigate, followed by a detailed description of the use case applications in Section IV. The experimental setup and used metrics are presented in Sec-tion V. and SecSec-tion VI introduces and analyzes our evaluaSec-tion results. Finally, Section VII highlights our key findings, while Section VIII draws conclusions and directions for future work.
II. RELATED WORK
Understanding and optimizing power usage in cloud en-vironments has emerged as a significant topic for both re-searchers and cloud service providers. Several research direc-tions are currently being investigated, each of them targeting energy-efficiency at different levels.
Several works have focused on profiling the power con-sumption of individual node components, such as the CPU [1], [2], memory [2], [3], network cards [4] or hard disks [5], [6]. Among them, the most extensively studied is the CPU, as it is the component with the largest impact on the overall energy usage of physical servers [1]. As virtualization is a key technology enabling cloud computing, an increasing amount of studies started to explore the energy consumption of VMs. In [2], [7], [8], the authors analyze both the performance overhead of virtualization and the corresponding power usage of VMs under various configurations and workloads. However, despite providing extensive experimental results for individual machine components, these studies rely on specifically tuned environments and do not consider the management systems deployed on cloud infrastructures. Similarly, the works in [9]– [11] study the energy consumption of virtualized environments under various workloads. However, the experiments provided involve few physical servers, or are based on simulations with no real cloud environment. Currently, no cloud environment has emerged as the ultimate cloud computing offering capable of providing the standard architecture for cloud software. It is thus essential to put energy in the balance when choosing
among the available cloud environments. However, most of the existing studies focus on analyzing or reducing the energy consumption of the virtual machines themselves, without tak-ing into account the intrinsic energy cost of the management software. To the best of our knowledge, no study based on in-depth measurements exists that analyzes and compares the actual energy consumed by a cluster running representative cloud management systems in real-world conditions.
III. IAASCLOUD MANAGEMENT SYSTEMS
In this section we introduce two widely-used cloud infras-tructures we rely upon for our experiments.
Apache CloudStack [12] is a highly-scalable IaaS cloud
computing platform designed to support the deployment and execution of large networks of virtual machines. The Cloud-Stack implementation is open source, providing modular components for every level of IaaS cloud software stack, such as virtual machine management, scheduling, resource orchestration, accounting or network services. A full and open API ensures user access to all the features of the cloud, complemented by an Amazon EC2- and S3-compatible API to facilitate application migration between cloud platforms.
OpenNebula [13], [14] provides fully open-source IaaS
services designed to address the requirements of business use cases across multiple industries. The main design prin-ciples on which the OpenNebula project relies include a modular and extensible architecture, scalability for large-scale infrastructures, interoperability with existing cloud offerings, open-source implementation. Furthermore, OpenNebula aims at providing standardized interfaces for managing VMs and data, such as the Amazon EC2 “de-facto” industry standard.
While most IaaS cloud frameworks have similar archi-tectures and provided services, we selected CloudStack and OpenNebula to emphasize the impact of several specific fea-tures. Both clouds rely on a centralized architecture, where the cloud frontend deals with user requests, resource and VM management. However, OpenNebula is designed to work as a private cloud, whereas CloudStack is intended as a public cloud offering. CloudStack benefits from several mechanisms to reduce the load on the frontend node. First, it implements a VM storage repository hosted on one or more separate servers typically sharing the files across the cloud. Second, CloudStack delegates the VM image management operations to a system VM, which is automatically deployed on the compute nodes. It thus shifts the burden of transferring and managing VM images to a compute node, reducing the load of the frontend node. OpenNebula plays the role of the typical cloud platform, for which all management operations happen at the frontend level. Both frameworks allow for the deployment of virtual clusters of customizable VMs. We employed the default settings in the deployment of both clouds. This implies a local storage-based VM management, that is each cloud needed to copy the VM image from the image repository to the local disk of each compute node. Two specific features have a critical impact on the behavior and performance of hosted VMs:
VM allocation policy. OpenNebula used a round-robin VM
allocation policy, whereas VM placement in CloudStack was based on a random algorithm, which chooses the a random node to host the VM, provided that it has enough available CPUs and memory to accommodate the VM. Additionally,
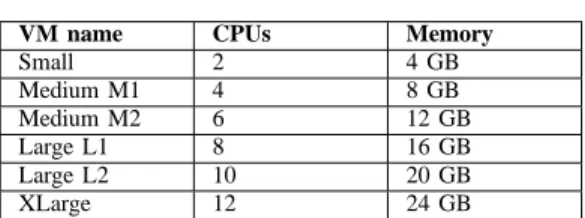
TABLE I. VIRTUAL MACHINE TYPES
VM name CPUs Memory
Small 2 4 GB Medium M1 4 8 GB Medium M2 6 12 GB Large L1 8 16 GB Large L2 10 20 GB XLarge 12 24 GB
CloudStack supports CPU over-provisioning (but not memory over-provisioning), an attribute that results sometimes in multi-ple VMs competing for the node resources and yielding worse performance.
Cloud monitoring mechanisms. CloudStack employs an
event-based approach to collecting performance and status information from its resources and VMs. Each time a change occurs in the system (e.g., when a VM is deployed), the affected node notifies the cloud frontend, which adds the event into a monitoring database. In the case of OpenNebula, moni-toring is achieved through probes that are periodically executed on the compute nodes by the frontend. Such mechanisms may generate additional resource utilization and power consumption at the level of each node.
IV. APPLICATIONS
This section details a set of representative applications we selected to explore the power consumption patterns of cloud environments.
A. Microbenchmarks
We employed a set of benchmarks to isolate the impact of simple application workloads on power consumption. To this end, we used the stress1 tool to generate specific workloads targeting the CPU, memory and disk accesses inside virtual machines. We configured each of them as follows.
CPU: We simulated CPU-bound applications by starting a
number of stress threads equal to the number of virtual cores allocated to the VM, so as to achieve 100% CPU utilization.
Memory: The influence of memory utilization is profiled by
executing an increasing number of stress worker threads that continuously allocate, read and free 256 MB of memory. Such a memory-intensive pattern is typical for various MapReduce applications, such as those based on sorting massive amounts of data, as they need to fully load large data chunks into the main memory, rather than sequentially processing small blocks.
Disk: IO-intensive jobs are specific to Big Data applications
typically designed for cloud environments. To analyze the impact of disk utilization within virtual machines on power consumption, we deployed an increasing number of IO-bound
stress threads, each of them writing 5 GB of data. B. MapReduce applications
MapReduce [15] is a powerful paradigm enabling efficient and scalable distributed processing of vast amounts of data. A MapReduce application typically takes a set of key/value pairs as input and produces a similar set as a result. The user has to specify only two functions, namely map and reduce, which process the data in parallel on multiple machines. The map function parses the input data and passes a set of intermediary
TABLE II. METRICS
Name Definition Values Application
Average power Average power consumed by a physical machine over a given time interval.
Average of a set of values measured by the hardware wattmeters. Benchmarks Idle power The default power consumption of powered-on
machines.
The lowest power value reported by hardware power meters for all the idle machines over a 24-hour duration.
Benchmarks Dynamic power Highlights the power consumption overhead
gen-erated by various workloads.
The difference between the average power and the idle power. Benchmarks Runtime Application execution time, the main metric to
assess application performance.
Reported by the application logs within the virtual machines. MapReduce Total energy The energy consumed by the cloud infrastructure
in a given time interval.
Computed as the sum of the consumed energy per node. The energy consumed by each node is the sum of the instant power values reported by the wattmeters in a specific time interval (e.g. during the application execution) multiplied by the monitoring resolution.
MapReduce
key/value pairs to the reduce stage of the computation. The
reduce function is responsible for merging the values with the
same intermediary key into the final results.
The Hadoop [16] project is a very popular open-source MapReduce implementation developed by the Apache Soft-ware Foundation, designed for huge clusters of comodity hardware and used to process hundreds of petabytes of data in various datacenters. The architecture of a Hadoop cluster is based on the master-slave model, where the worker nodes process tasks assigned by one master node. The user submits MapReduce jobs to the master node, called the jobtracker, which in turn is in charge with scheduling the jobs for execution, monitoring their status and handling the finished and failed tasks. Worker nodes are configured as tasktrackers. They are the entities that execute several map and reduce tasks forwarded by the jobtracker, according to their capacity. Data management is dealt with by the Hadoop Distributed File System (HDFS), a highly reliable distributed file system designed to store huge amounts of data on low-cost commodity machines. HDFS splits data into equally-sized chunks of 64 MB and then it distributes and replicates the chunks across its datanodes. The location of each chunk and the filesystem directory structure are managed by a namenode, a centralized entity playing the role of the file system frontend.
MapReduce applications can be classified into CPU-bound applications, IO-bound or both. To provide an analysis of each type of MapReduce workloads, in this paper we investigate three typical MapReduce applications:
Distributed Pi estimates the value of Pi using a quasi-Monte
Carlo method. Each mapper generates a set of points in a one unit square and then it counts the number of points that were placed within the inscribed circle of the square. The
reduce phase gathers the results from all the mappers and
computes Pi as the ratio between the inside points and the total number of points. The application is purely CPU-intensive, as the generated data is very small. The particularity of this application is that increasing the number of mappers will not result in a shorter execution time, as there is no input data to be split among the workers. Instead, a larger number of workers leads to a better accuracy of the result.
Distributed Grep is designed to search for a specific pattern
in very large files. It is a data-intensive application in the map phase, when the data is fetched from HDFS and split among the mappers. Grep also requires a significant processing power to process data and gather the results in the final reduce stage.
Distributed Sort represents the typical example of an
IO-bound MapReduce application, devised to sort key/value pairs in a distributed fashion. It can handle a large amount of input data, which is divided into chunks assigned to existing
mappers. The output results have the same size as the input,
making Sort a convenient benchmark for both read and write operations.
V. EVALUATION METHODOLOGY
The experimental study presented in this paper focuses on investigating the tradeoff between energy consumption and performance in cloud systems under various workloads. This section introduces the experimental platform employed for the experiments and details the deployment setup.
A. Platform
We performed all our experiments on the Grid’5000 [17] experimental testbed, a geographically-distributed grid plat-form designed for the research community. It gathers over 8000 CPU cores across 10 sites in France, allowing scientists to design and execute large-scale, reconfigurable experiments at any level of the software stack. For the experiments presented in this paper, we employed 15 nodes belonging to the taurus cluster in Lyon. The nodes are equipped with 12-core Intel Xeon processors running at 2.3 GHz, as well as with 32 GB of memory and 10 Gb Ethernet cards. Each node is monitored by Omegawatt wattmeters [2] that provide accurate real-time power-consumption measurements with a resolution of 1s.
B. Experimental setup
We deployed each of the two cloud frameworks on all the 15 nodes, dividing them into one cloud frontend node and 14 compute nodes, using KVM as the VM hypervisor for both clouds. Then we started a variable number of VMs according to the investigated experimental scenario. To assess the impact of VM characteristics on the power consumed by a physical node, we employed different types of VMs, increasing the number of virtual CPUs assigned to each of them and the size of their memory. The details corresponding to each type are summarized in Table I. We used 2.7 GB-sized compressed QCOW2 VM images, one featuring Debian for OpenNebula experiments and the second one running CentOS for CloudStack. The VMs were equipped and configured for our target applications as a final step of the deployment process, the required configuration files being generated on the fly by a set of deployment scripts we developed. The number of CPUs and the memory of each VM is dynamically set when the virtual cluster is deployed, while the VM allocated hard disk size is fixed to 20 GB.
0 20 40 60 80 100 120 140 160 1 2 3 4 6
Average Power (Watts)
VMs per node CloudStack OpenNebula Idle Power
(a) CPU stress.
0 50 100 150 200 250 1 2 3 4 6
Average Power (Watts)
VMs per node CloudStack OpenNebula Idle Power (b) Memory stress. 0 20 40 60 80 100 120 140 160 1 2 3 4 6
Average Power (Watts)
VMs per node CloudStack OpenNebula Idle Power
(c) Hard disk stress. Fig. 1. Average power consumption vs. number of VMs when running stress in each cloud setting.
C. Applications setup
We configured Hadoop in the VM images. Within each vir-tual cluster, we deployed Hadoop as follows: one node played the role of the jobtracker, one represented the namenode, while the rest acted as both tasktrackers and datanodes. For each application, the number of mappers was set to the total number of CPUs comprised in the virtual cluster, that is each VM has a number of mappers equal to its number of CPUs. HDFS replication degree was fixed to 3 and the data chunk size to its default value of 64 MB. Before executing the experiments, we generated input files for Grep and Sort and uploaded them into HDFS. The size of the input files was fixed for all the experiments and amounted to 52 GB, ensuring from 5 to 35 chunks per mapper, depending on the virtual cluster capacity, i.e. on the number of VMs.
D. Metrics
We employ several metrics to analyze the behavior and power profile of the investigated clouds. These metrics are described in Table II, classified according to the application for which they are relevant. We used the power metrics to evaluate the power consumption of the virtualized hardware components. Such metrics based on average power values are appropriate to assess the power overhead of applications characterized by a fixed execution time and a constant work-load. The runtime and total energy metrics are essential for applications where performance is an important aspect, such as MapReduce, and they allow us to estimate the tradeoffs between execution time and energy consumption.
VI. EXPERIMENTAL RESULTS
The goal of this study is to investigate how various types of workloads executed in virtual clusters reflect on the energy profile of the entire cloud and to identify configuration alter-natives to achieve similar performance within more energy-efficient virtual clusters. To this end, we perform two types of experiments. First, we carry out a set of component tests to analyze the impact of virtualized workloads on the power consumption of each node. In the second experiment, we focus on three typical MapReduce applications to estimate the effect of increasing the capacity of a virtual cluster on performance and energy consumption.
A. Benchmarks
We study the power consumption of physical nodes hosting one or several virtual machines with various capabilities, when
the VM workloads target a specific hardware component. This section provides two different evaluations reflecting the two ap-proaches for increasing virtual cluster capacity: (1) increasing
the number of VMs to accommodate larger workloads and (2) augmenting the capacity of each VM in terms of virtual
CPUs and memory. Comparing the results of these experiments will help cloud users find the best tradeoff between employing several high-performance VMs and a large number of small VMs, in terms of both performance and energy consumption. We select the stress benchmark according to the hardware component we want to evaluate and we execute it in parallel on all the deployed VMs. The duration of each test is set to 200 seconds and we measure the instant power consumption of each node with a resolution of 2 seconds. As each test generates a constant load on the VM during the execution time and all compute nodes have similar configurations, we plot the average power consumption for a representative node among the platform’s physical machines. We consider the idle power as the baseline against which we study the impact of the the various workloads.
1) Impact of the number of VMs on the node power consumption: The first set of experiments is performed on
a single type of virtual machines, that is the Small Instance defined in Section V-B. We first deploy a virtual cluster of 14 VMs, one for each compute node in the cloud. Then we increase the size of the virtual cluster, maintaining an uniform number of VMs per physical compute node and a fixed load per VM. Figure 1 shows the average power consumed by a compute node during each of the stress tests. Each figure depicts the results obtained for both cloud frameworks, featuring the number of VMs simultaneously running on the node on the X axis and measured average power on the Y axis. Additionally, each graph includes the minimum idle power consumption of the node, amounting to 92.2 Watts.
Figure 1(a) depicts the power consumption of the compute node as the number of VMs deployed per node increases. Consequently, the CPU load also raises, as each additional VM requires 2 fully loaded CPU cores for its stress workload. As a result, the power consumption of the node follows the same trend, increasing as more VMs are added to the system. Whereas the total number of used CPUs reaches up to 6 times the initial load, the corresponding power consumption increases at a slower pace. Thus, the node achieves 100% CPU usage for its 12 cores with only double the amount of power needed for 2 CPU cores. Furthermore, the dynamic
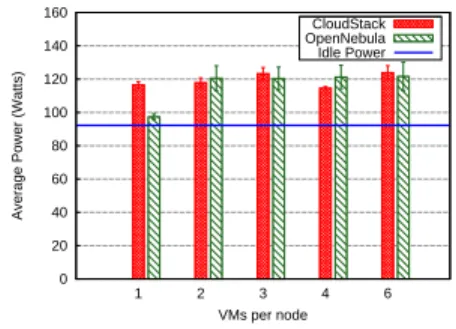
0 20 40 60 80 100 120 140 160 2 4 6 8 10 12
Average Power (Watts)
CPUs per VM CloudStack OpenNebula Idle Power
(a) CPU stress.
0 20 40 60 80 100 120 140 160 180 200 2 4 6 8 10 12
Average Power (Watts)
CPUs per VM CloudStack OpenNebula Idle Power (b) Memory stress. 0 20 40 60 80 100 120 140 160 180 2 4 6 8 10 12
Average Power (Watts)
CPUs per VM CloudStack OpenNebula Idle Power
(c) Hard disk stress. Fig. 2. Average power consumption vs. number of cores per VM when running stress in each cloud setting.
power consumed to fully load the CPU represents only 43% of the node’s idle power. This is an essential aspect that has to be taken into account when designing techniques to optimize power consumption, indicating that VM consolidation and shutting down nodes may entail significant energy savings, that can surpass the performance degradation incurred by the migrated VMs. The obtained results are similar for both clouds, exhibiting a slightly better power usage for CloudStack. As both frameworks rely on the same hypervisor type and VM configuration, the difference can be explained by taking into account the total number of processes executed by the operating system and cloud software. For instance, both clouds collect monitoring information from all their running VMs and compute nodes, thus introducing additional network traffic and CPU load, which in turn lead to different power usage patterns. As far as the memory-intensive tests are concerned, the average power usage increases in a much steeper fashion with the number of deployed VMs. While the memory-intensive workload also generates a certain CPU load, the results in Figure 1(b) show that memory usage has to be carefully taken into account when optimizing energy consumption of a cloud platform. Furthermore, in most cases OpenNebula exhibits a more significant power expense than CloudStack, on account of CloudStack’s unpredictable allocation algorithm, which might lead to unbalanced compute nodes.
Figure 1(c) depicts the way IO-intensive workloads impact the power consumption of VMs. As opposed to the previous experiments, hard disk-bound operations do not lead to an ever increasing power usage as we add VMs to a physical node. Instead, the average power consumed by more than 3 VMs per node is nearly constant, on account of all VMs that run on the same physical machine sharing the underlying hard disk. As a result, deploying additional VMs on the same node will only divide the existing bandwidth, thus requiring the same amount of energy. As the cloud frameworks implementation does not interfere with the hard disk usage, both clouds deliver similar power consumption values.
2) Impact of the VM size on the node power consumption:
The set of experiments introduced in this section focuses on the correlation between the average power usage of a node and the properties of a single VM running on top of it. In this scenario, we deploy a fixed number of 14 VMs on the 14 available compute nodes and we vary the VM type. Figure 2 presents the same three stress benchmarks, each of them depicting the average power consumption for each VM type.
Figure 2(a) shows the CPU power consumption for a pure CPU-bound workload. Its X axis provides the set of VM types introduced in Section V-B. As expected, the Small VM instance, having only 2 virtual CPUs, achieves the lowest power consumption. As the size of the VM is extended to the maximum number of CPUs available on the physical node, we proportionally increase the workload, so as to ensure all the virtual CPUs are fully loaded. The Small VM achieves only about 15% power usage improvement for each cloud compared to its XLarge counterpart. Thus, similarly to the previous experiment, the power savings associated with smaller VMs are less significant than the processing power delivered by the larger VM instances. Note that OpenNebula exhibits a linear power-usage increase with the number of used CPUs, as its VM allocation policy favors the deployment of new VMs on unused nodes. In the case of CloudStack, the wide variations in Figure 2(a) clearly indicate that it allowed for multiple VMs to be executed on the same node and hence to generate an atypical power-consumption pattern.
Figure 2(b) depicts the way memory-bound workloads impact the average power reported by the node in the case of high-capacity VMs. The results are similar to the previous experiment, showing that OpenNebula requires a more impor-tant amount of energy to sustain the memory-intensive tasks, whereas CloudStack yields constant values. The hard disk charging experiment in Figure 2(c) points out a particularly energy-consuming bahavior of CloudStack. Even though both clouds report nearly constant values (due to the fact that all tasks within the VM access the same underlying disk), CloudStack exhibits again a higher power usage.
3) Power unbalance: In the previous experiments we
dis-cussed the average power consumption of a cloud compute node when varying the number or performance of hosted VMs. To conduct the evaluation, we uniformly increased the size of the deployed virtual cluster, aiming at maintaining a constant load on each compute node. We then selected one of the compute nodes for which we showed the average power consumption. Nevertheless, not all nodes provide identical results. A key aspect in optimizing energy consumption in a cloud infrastructure is to identify the sources of variability in the behavior of the cluster nodes and to understand how a fixed workload is balanced among the compute nodes. To this end, we analyze the power unbalance of the entire cloud, by studying the variation of the average power usage across nodes. Figure 3 shows the cumulative distribution function (CDF) of the average dynamic power measured for all physical nodes in
0 0.1 0.2 0.3 0.4 0.5 0.6 0.7 0.8 0.9 1 0 20 40 60 80 100 120 140 Cumulative distribution
Dynamic Power Consumption (Watts) 14 VMs 28 VMs 42 VMs 56 VMs 84 VMs (a) OpenNebula. 0 0.2 0.4 0.6 0.8 1 0 20 40 60 80 100 120 140 Cumulative distribution
Dynamic Power Consumption (Watts) 14 VMs 28 VMs 42 VMs 56 VMs 84 VMs (b) CloudStack.
Fig. 3. Power unbalance across nodes for the CPU stress test.
each cloud, when the VMs execute the CPU stress benchmark. When the number of VMs deployed in the cloud increases to the maximum supported capacity, the corresponding dynamic power consumption increases for all the nodes involved in the deployment. These results are consistent with the ones reported in our first experiment, the CDF for the largest virtual cluster, that is 84 VMs, corresponding to the highest dynamic power in Figures 3(a) and 3(b).
Figure 3(a) shows the CDF for the OpenNebula cloud, featuring very steep lines for each virtual cluster size. Thus, the results indicate that for more then 75% of the nodes, the variation in the measured average power is negligible. Since all VMs have a fixed load, this result is a direct consequence of the fact that OpenNebula favors a load balancing algorithm to ensure an uniform distribution of VMs in the cloud. In contrast, the CloudStack measurements in Figure 3(b) point to a different behavior. Low values of the CDF correspond to the frontend node of each cloud, as typically it is not loaded once the VMs are running. However, the increase rate of each line is less significant than the OpenNebula conterparts, denoting a high discrepancy between the number of VMs assigned to the various compute nodes. The explanation lies in the VM alloca-tion strategy implemented in CloudStack, which assigns VMs randomly to the compute nodes that have enough available resources. As a result, despite the more efficient power usage exhibited by CloudStack in Figure 1(a), it is worth noticing the overall behavior of the OpenNebula cloud is more predictable. Thus, an energy consumption model for OpenNebula may offer accurate predictions to allow energy-aware schedulers to select a “greener” cloud for their workloads.
B. MapReduce applications
This section highlights the impact of the virtual cluster configuration on the energy and performance delivered by the two cloud environments for each class of MapReduce applications as we increase the capacity of the deployed virtual
cluster, both in terms of number of VMs and VM capabilities.
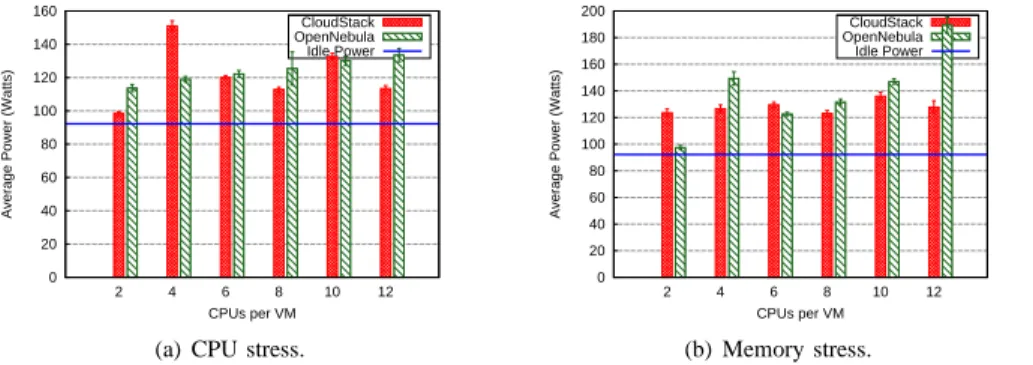
a) Performance analysis: Figure 4 presents the
execu-tion time of each applicaexecu-tion on the right side Y axis, when increasing the number of VMs processing the same workload. The results show the job completion time decreases as the virtual cluster is expanded, for the two IO-bound applications. The Pi application exhibits a different behavior when we increase the number of CPUs and adjust the number of Hadoop mappers accordingly. A larger number of available mappers is equivalent to more processing power that increases the accu-racy of the result (i.e., the number of decimals computed for Pi). In this case, the runtime is not a measure of the application performance, but it rather emphasizes the scalability of the VM cluster. In the case of OpenNebula, the runtime for Pi is constant regardless of the number of VMs, as a consequence of the round-robin allocation strategy, allowing the framework to achieve similar performance for all its VMs. On the other hand, CloudStack has a different VM management strategy, which often leads to less than optimal VM distribution across compute nodes and consequently, to higher execution times.
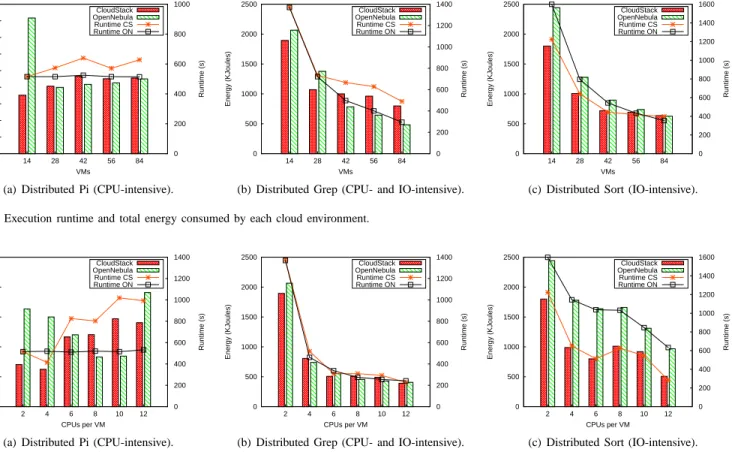
A complementary experiment presents the same MapRe-duce applications executed in a fixed-sized virtual cluster comprising 14VMs. We modify the VM type and measure the runtime in Figure 5. As expected, the Pi application yields similar runtimes to the previous test. The same discrepancy can be observed between OpenNebula and CloudStack, in particular for medium-sized VMs, triggered by the CloudStack allocation policy, which authorizes overcommited compute nodes. For instance, a compute node may host two 8-core VMs, even though the number of physical cores only amounts to 12. As far as the Grep and Sort applications are concerned, the runtime drops as we deploy more 2-core VMs (as shown in Figure 4) or increasingly larger VMs (Figure 5). In the first experiment we conducted, Grep results indicate the best performance is achieved for the highest number of VMs, as a consequence of splitting the initial load to a larger number of workers. In the second experiment depicted in Figure 5(b), the number of available mappers increases with the available CPUs in larger VMs. Interestingly however, such a configuration outperforms the one involving a large number of small VM instances, as the execution times significantly drop when we employ more than 4 CPUs. The reason behind this behavior lies in the IO-bound nature of Grep. As several VMs hosted on the same compute node will access the same underlying network and disk, they will share the available bandwidth and thus carry out their tasks in a larger amount of time. Alternatively, large VMs hosted on separate nodes take full advantage of the compute node capabilities, avoiding resource contention and thus achieving better performance. Another side effect of improving VM capabilities is that the speedup flattens for medium and large VMs. Mainly due to attaining the IO traffic limit of the physical machine, this result is a key aspect to adapting the VM capabilities to the workload requirements. It suggests that near-optimal performance can be achieved with relatively small-sized VMs, paving the way for consolidation and energy efficiency at the platform level.
The Sort application produces similar results as Grep, yielding a substantial performance gain when the virtual cluster size or CPU capacity per VM are augmented to process the same amount of data. Sort is a representative data-intensive
0 200 400 600 800 1000 1200 1400 1600 1800 14 28 42 56 84 0 200 400 600 800 1000 Energy (KJoules) Runtime (s) VMs CloudStack OpenNebula Runtime CS Runtime ON
(a) Distributed Pi (CPU-intensive).
0 500 1000 1500 2000 2500 14 28 42 56 84 0 200 400 600 800 1000 1200 1400 Energy (KJoules) Runtime (s) VMs CloudStack OpenNebula Runtime CS Runtime ON
(b) Distributed Grep (CPU- and IO-intensive).
0 500 1000 1500 2000 2500 14 28 42 56 84 0 200 400 600 800 1000 1200 1400 1600 Energy (KJoules) Runtime (s) VMs CloudStack OpenNebula Runtime CS Runtime ON
(c) Distributed Sort (IO-intensive). Fig. 4. Execution runtime and total energy consumed by each cloud environment.
0 500 1000 1500 2000 2500 2 4 6 8 10 12 0 200 400 600 800 1000 1200 1400 Energy (KJoules) Runtime (s) CPUs per VM CloudStack OpenNebula Runtime CS Runtime ON
(a) Distributed Pi (CPU-intensive).
0 500 1000 1500 2000 2500 2 4 6 8 10 12 0 200 400 600 800 1000 1200 1400 Energy (KJoules) Runtime (s) CPUs per VM CloudStack OpenNebula Runtime CS Runtime ON
(b) Distributed Grep (CPU- and IO-intensive).
0 500 1000 1500 2000 2500 2 4 6 8 10 12 0 200 400 600 800 1000 1200 1400 1600 Energy (KJoules) Runtime (s) CPUs per VM CloudStack OpenNebula Runtime CS Runtime ON
(c) Distributed Sort (IO-intensive). Fig. 5. Total energy consumed by the cloud environment.
application, for which most of the execution time accounts for data reading and writing. Unlike Grep, which spends a significant percentage of its runtime for processing data, Sort is mostly impacted by the disk and network capabilities. For this reason, Figure 4(c) and Figure 5(c) respectively, display less steep runtime gain when than the equivalent Grep results. From the cloud platform point of view, OpenNebula en-sures a limited performance gain for the Grep application over CloudStack. This advantage is only noticeable for a large number of VMs, due to OpenNebula’s allocation strategy that prevents compute nodes overloading and thus reduces disk and network contention. Conversely, the cloud choice does not impact the results involving various VM types in Figure 5(b), as in this case only one VM is typically deployed per compute node. The Sort application shows a clear advantage of Cloud-Stack over OpenNebula, in particular in the second experiment, as presented in Figure 5(c).
b) Energy consumption: We examine the energy
con-sumption of each application by measuring the total energy utilized by the cloud during the application execution. Figure 4 shows the total energy usage of the cloud frameworks when the size of the deployed virtual cluster is increasing.
We conducted the Pi-related set of experiments to study the effects of a gradually increasing CPU-intensive workload on the energy consumption. As shown in the previous section, for both experiments the runtime is constant and thus the utilized energy is mostly dependent of the system load. Surprisingly, Figure 4(a) only reveals a minor energy-consumption rise as the cluster size grows, despite the high CPU load the
application entails. This observation is consistent with the CPU
stress experiment, highlighting the impact of the idle power
consumption of the nodes, which accounts for a substantial share of the total energy. In this scenario, both clouds exhibit similar energy profiles. We obtained different results when varying the VM configuration, as presented in Figure 5(a). The energy usage in CloudStack follows the increasing trend of the obtained execution times. The OpenNebula results exhibit a large variation, which may be due to unexpected Hadoop nodes failures, which triggered the re-execution of a series of map tasks. This is a common event in Hadoop clusters, which does not prevent the job from successfully finishing, but may result in longer execution times and an increased CPU load.
Figures 4(b) and 5(b) depict the energy usage of the cloud platforms when executing Grep. Contrary to the results measured for Pi, the energy consumption of the entire cloud decreases as we add more VMs, behavior that can be explained by the fact that the Grep application divides its initial data among the available mappers. Thus, increasing the cluster capacity comes with the benefit of a radically improved runtime. As the energy-usage results show, the runtime of the application is a factor that generates essential energy savings able to largely outweigh the additional energy expense caused by extended cluster sizes. The results depicted in Figures 5(c) and 4(c) show a decreasing trend of the energy usage as we increase the number of VMs, similar to the results obtained for
Grep. In the Sort case however, the speedup and the associated
energy savings are not that significant. This is mainly due to the huge amount of data Sort processes, amounting to 100 GB of input and output data replicated 3 times.
VII. DISCUSSION
Our experiments point out a series of valuable insights on the cloud computing potential to save energy. First of all, our results showed that energy consumption depends both on the workload type and on the virtual cluster configuration. Thus, while small VMs consume less energy, the benchmark tests we conducted suggest that their power usage does not increase proportionally with the VM capacity. Furthermore, larger virtual clusters (both in terms of number of VMs or VM capabilities) achieve significant performance gains in both CPU- and IO-bound applications. Although not intuitive, an essential lesson can be learned from analyzing our MapReduce results: application execution time is a strong factor that impacts the total energy usage of the cluster. Consequently, even if large or high-capacity clusters require more power to operate, employing them for cloud applications can lead to significant energy savings. On the other hand, it is worth notic-ing that increasnotic-ing the cluster capacity is equivalent to better runtimes only to a certain extent. For instance, using more than 6 virtual cores for the Grep application does not result in any performance gain. Thus, choosing the largest available VM instance does not guarantee an optimal performance. On the contrary, our findings indicate that medium-sized VM instances achieve the same results as the larger instances, whereas employing large VMs may hinder consolidation attempts and prevent higher-level tools from optimizing total energy usage. Thus, cloud users should carefully tune their VM attributes to the workload in order to achieve runtime performance while maintaining a low energy-consumption level.
Concerning the two cloud frameworks we investigated, the experimental results indicate that OpenNebula yields better results for CPU-intensive workloads, both performance and energy-wise. For IO-bound applications, such as Sort or the memory-intensive benchmarks, CloudStack delivers signifi-cantly better execution time and energy gains. Additionally, in some cases when both clouds report similar runtimes, Cloud-Stack proves to be more energy efficient than OpenNebula. Moreover, both clouds seem to benefit from using larger VM instances than deploying a considerable amount of small VMs to reach the same processing capacity. These observations may prove useful to higher-level services, such as Platform-as-a-Service clouds, which can rely on a federation of IaaS clouds for executing their jobs. In such a scenario, it is important to better understand the strengths of various cloud infrastructures and to schedule jobs on the most suitable platform according to the workload. Furthermore, our experiments revealed a significant degree of performance variability in both cloud systems we investigated. Variability is one of the critical aspects in the adoption of cloud computing, which can render the evolution of applications unpredictable in public clouds (i.e., Amazon EC2). Our results suggest that the variability increases with the VM instance capacity, as well as with the complexity of the executed job. Consequently, private clouds also require a thorough knowledge of the sources of such variability in order to improve the overall energy efficiency.
VIII. CONCLUSIONS
The wide adoption of cloud computing and the ever in-creasing resource demands have lead to a growing interest in optimizing energy consumption in such large-scale infras-tructures. In this paper we address the problem of energy
consumption at the level of IaaS clouds, focusing on the impact of various types of workloads and cluster configurations on the overall energy usage. We conducted a series of experiments on the Grid’5000 testbed, relying on two open-source cloud envi-ronments, namely OpenNebula and CloudStack. We presented a comprehensive analysis of the power usage of compute nodes under component-oriented workloads. Furthermore, to study how scaling the deployed VM cluster may lead to energy gains, we extended our experiments to several classes of MapReduce applications. The obtained results show how different workload types and configuration decisions affect the energy profile of each cloud. By considering the energy consumption of the entire cloud, our evaluations provide valuable insights on cloud computing potential to save energy. For instance, while data-intensive applications benefit from increasing the size of the virtual cluster where they are executed, both performance gains and energy savings can be generated by switching to smaller-scale clusters made up of more powerful VMs. Future research directions involve building tools to estimate the most energy-efficient deployment configuration for cloud applications and addressing variability issues.
ACKNOWLEDGMENTS
Experiments presented in this paper were carried out using the Grid’5000 experimental testbed, being developed under the INRIA ALADDIN development action with support from CNRS, RENATER and several Universities as well as other funding bodies (see https://www.grid5000.fr).
REFERENCES
[1] X. Fan, W. Weber, and L. Barroso, “Power provisioning for a warehouse-sized computer,” in Proc. of Int. Symposium on Computer
architecture (ISCA), 2007, pp. 13–23.
[2] A.-C. Orgerie, L. Lefevre, and J.-P. Gelas, “Demystifying energy consumption in grids and clouds,” in Proc. of Int. Green Computing
Conf., Aug. 2010, pp. 335–342.
[3] J. Yue, Y. Zhu et al., “Evaluating memory energy efficiency in parallel i/o workloads,” in IEEE Cluster, 2007, pp. 21–30.
[4] M. Jimeno, K. Christensen, and B. Nordman, “A network connection proxy to enable hosts to sleep and save energy,” in Proc. of Int.
Performance, Computing and Comm. Conf. (IPCCC), Dec. 2008, pp.
101–110.
[5] M. Allalouf, Y. Arbitman et al., “Storage modeling for power estima-tion,” in Israeli Experimental Systems Conference (SYSTOR), 2009. [6] A. Hylick, R. Sohan et al., “An analysis of hard drive energy
consump-tion,” in Proc. of the Int. Sym. on Modeling, Analysis and Simulation
of Comp. and Telecomm. Systems (MASCOTS), Sep. 2008, pp. 1–10.
[7] Q. Chen, P. Grosso et al., “Profiling Energy Consumption of VMs for Green Cloud Computing,” in Proc. of IEEE Int. Conf. on Dependable,
Autonomic and Secure Computing (DASC), 2011, pp. 768–775.
[8] Z. Zhang and S. Fu, “Macropower: A coarse-grain power profiling framework for energy-efficient cloud computing,” in Proc. of the 30th
Int. Conf. on Perf. Comp. and Comm. (IPCCC), Nov. 2011, pp. 1–8.
[9] J. Torres, D. Carrera, K. Hogan et al., “Reducing wasted resources to help achieve green data centers,” in Proc. of IEEE Int. Symp. on Parallel
and Distributed Processing (IPDPS), 2008, pp. 1–8.
[10] R. Nathuji and K. Schwan, “Virtualpower: coordinated power man-agement in virtualized enterprise systems,” SIGOPS Oper. Syst. Rev., vol. 41, no. 6, pp. 265–278, Oct. 2007.
[11] J. Stoess, C. Lang, and F. Bellosa, “Energy management for hypervisor-based virtual machines,” in USENIX Annual Technical Conf., 2007, pp. 1–14.
[12] Apache CloudStack, http://cloudstack.apache.org/.
[13] R. Moreno-Vozmediano, R. Montero et al., “Elastic management of cluster-based services in the cloud,” in Proc. of the 1st Workshop on
Automated control for datacenters and clouds, 2009, pp. 19–24.
[14] OpenNebula, http://opennebula.org/.
[15] J. Dean and S. Ghemawat, “MapReduce: simplified data processing on large clusters,” Communications of the ACM, vol. 51, no. 1, pp. 107– 113, 2008.
[16] “The Apache Hadoop Project,” http://www.hadoop.org.
[17] Y. J´egou, S. Lant´eri, J. Leduc et al., “Grid’5000: a large scale and highly reconfigurable experimental grid testbed,” Intl. J. of HPC Applications, vol. 20, no. 4, pp. 481–494, November 2006.