HAL Id: hal-00608327
https://hal.archives-ouvertes.fr/hal-00608327
Submitted on 12 Jul 2011
HAL is a multi-disciplinary open access
archive for the deposit and dissemination of
sci-entific research documents, whether they are
pub-lished or not. The documents may come from
teaching and research institutions in France or
abroad, or from public or private research centers.
L’archive ouverte pluridisciplinaire HAL, est
destinée au dépôt et à la diffusion de documents
scientifiques de niveau recherche, publiés ou non,
émanant des établissements d’enseignement et de
recherche français ou étrangers, des laboratoires
publics ou privés.
Subjective Quality Evaluation of H.264 High-Definition
Video Coding versus Spatial Up-Scaling and Interlacing
Yohann Pitrey, Marcus Barkowsky, Patrick Le Callet, Romuald Pépion
To cite this version:
Yohann Pitrey, Marcus Barkowsky, Patrick Le Callet, Romuald Pépion. Subjective Quality Evaluation
of H.264 High-Definition Video Coding versus Spatial Up-Scaling and Interlacing. Euro ITV, Jun 2010,
Tampere, Finland. pp.irccyn contribution. �hal-00608327�
Subjective Quality Evaluation of H.264 High-Definition
Video Coding versus Spatial Up-Scaling and Interlacing
Yohann Pitrey, Marcus Barkowsky, Patrick Le Callet, Romuald Pépion
Image & Video Communications (IVC) GroupInstitut de Recherche en Communications et Cybernétique de NANTES (IRCCyN) École Polytechnique de l’Université de NANTES – FRANCE
{yohann.pitrey, marcus.barkowsky, patrick.lecallet, romuald.pepion}@univ–tes.fr
ABSTRACT
The upcoming High-Definition format for video display pro-vides high-quality content, especially when displayed on adapted devices. When combined with video coding tech-niques such as MPEG-4 AVC/H.264, the transmission of High-Definition video content on broadcast networks be-comes possible. Nonetheless, transmitting and decoding such video content is a real challenge. Therefore, interme-diate formats based on lower frame resolutions or interlaced coding are still provided to address targets with limited re-sources. Using these formats, the final video quality depends on the postprocessing tools employed at the receiver to up-sample and de-interlace these streams. In this paper, we compare the full-HD format to three possible scenarios to generate a full-HD stream from intermediate formats. We present the results of subjective tests that compare the vi-sual quality of each scenario when using the same bitrate. The results show that using the same bitrate, the videos generated from lower-resolution formats reach similar qual-ity compared to the full-HD videos.
General Terms
HDTV, Subjective Quality Assessment, MPEG-4 AVC/H.264
1.
INTRODUCTION
Recent technological advances make transmission of High-Definition (HD) streams possible on broadcast networks, reaching a continuously increasing number of users. Com-bined with continuously growing network transfer capacities, this breakthrough was made possible by the advances in the video coding area. One of the most recent and most efficient is MPEG-4 AVC/H.264 [5]. This standard summarizes all the efforts in video compression from the last 20 years, and achieves good compression rates while maintaining good vi-sual quality [3].
Currently, several HD video formats are used by service providers. The so-called full-HD format 1080p50 consists in
frames of 1920 × 1080 pixels, displayed at 50 frames per sec-ond [1]. This format is quite demanding, because of the large size and high temporal frequency of the images to display. Therefore, intermediate formats are used to address smaller screens, networks with lower transmission rates and devices with limited processing abilities. Some formats use lower-resolution frames such as the 720p50 format (1280 × 720 pixels), or they use interlacing such as the 1080i50 format (1920 × 540 pixels per field). For displaying, the video often needs to be up-scaled and de-interlaced in order to match the full-HD native display resolution. Many techniques exist with variable complexities to perform this type of postpro-cessing and reduce the visual artifacts. In interlaced mode (in opposition to progressive mode), each actual frame is divided into two fields (the top and the bottom field) con-taining half the number of lines in the original frame. To get a full-size frame, the two fields are merged and refreshed al-ternatively, with half the temporal frequency of the original sequence.
In this paper, the performance of the full-HD format is com-pared with spatially down-scaled and/or interlaced formats, in terms of subjective visual quality. The new MPEG-4 AVC/H.26MPEG-4 video coding standard is used to generate streams that can be transmitted over current broadcasting channels. Using the same bitrate for each format, the impact of the coding artifacts is compared to the impact of spatial up-scaling and/or de-interlacing. Three different bitrate sce-narios are proposed to study the performance of each format in low-, medium- and high-bitrate contexts. The influence of the up-scaling techniques on the visual quality is also eval-uated by comparing two well-known algorithms called the Lanczos and bilinear up-scalers. Some Standard-Definition (SD) streams are included in our experiment, to show the contribution of HD over SD in a full-HD display context. This paper is organized as follows. Section 2 presents the considered application, and the configurations tested in our experiment. Section 3 describes the subjective quality test methodology used in this experiment. Section 4 presents and discusses the experimental results. Finally, section 5 concludes the paper.
2.
DESIGN OF EXPERIMENT
The purpose of our experiment is to compare different ways of generating a full-HD video stream from various input for-mats. In the considered scenario, only one version of the video stream would be transmitted on a network channel,
Parkjoy Crowdrun Stockholm Figure 1: Sample of the High-Definition test sequences used for the experiment.
followed by postprocessing operations to adapt it to the re-quirements of a full-HD display device.
Six common video formats are studied with various frame sizes, using interlaced or progressive coding (cf. Table 1). To ease the reading in the following, we refer to these for-mats using the abbreviations defined in Table 1. Format 1 is the upcoming full-HD format. No postprocessing opera-tion is needed to display it on a full-HD display. Currently, format 2 is used by many HD-broadcast applications. The interlacing has an impact on the quality of the displayed video, especially for scenes with high motion and high spa-tial detail. Format 3 is used by many service providers and it is a typical native resolution for HD-ready TV screens. The spatial up-scaling operation used to display a full-HD stream has an impact on the visual quality, due to the inter-polation process. In the case of format 4, the image is only up-scaled horizontally by a ratio of 1.5. For format 5, the images further need de-interlacing combined with a similar up-scaling step. Format 6 is the current Standard Defini-tion (SD) format. The aspect ratio is different from the HD format. The content of the output video thus appears horizontally stretched, which can affect the visual quality. Five full-HD reference video sequences were processed. Fig-ure 1 displays a snapshot for each one of these videos. They contain a wide variety of contents, including high motion and/or texture information. All the streams were generated from these reference sequences using interlacing and/or spa-tial down-scaling. The interlacing process is based on a clas-sical convolutional technique. The down-scaling method is based on the 2D-Lanczos filter which calculates the value of a pixel from the values of the neighboring pixels in the input image, using a Mexican-hat shaped function.
The de-interlacing algorithm used is called TDeint. It is based on a motion-adaptive scheme to reconstruct frames from the fields in the interlaced video. It is currently known as one of the best de-interlacing methods. Two up-scaling methods are compared in our experiment. The first method is called bilinear up-scaling, and performs a simple 2D-linear interpolation to generate the output image. The visual per-formance of this up-scaling method is acceptable, while its processing complexity is comparably low. The second up-scaling method uses the Lanczos filter. This up-scaler is known to have good performance, at the cost of a higher complexity in terms of calculation. In the following, these two up-scaling methods are referred to using B and L. After generating the formats reported in Table 1, each video is encoded using the reference MPEG-4 AVC/H.264 encoder
Table 1: Video formats used in the experiment. Format abbreviation Frame size (pixels) Progressive / Interlace 1 1920 × 1080 p 2 1920 × 1080 i 3 1280 × 720 p 4 1280 × 1080 p 5 1280 × 1080 i 6 720 × 576 p
[4]. The encoding parameters were set to typical values, in order to get a good tradeoff between coding efficiency and computational complexity. Three bitrate scenarios were studied : 3 Mb/s, 6 Mb/s and 9 Mb/s, corresponding to low, medium and high quality of service. The non-coded full-HD video was also included in the test as a high quality reference.
For each condition tested in the experiment, three dimen-sions have to be specified (bitrate, resolution and up-scaling filter function). We introduce the notation of a specific con-figuration with the following example: 6.3.L refers to the video encoded at 6 Mb/s using format 3 (720p50) and up-scaled by the Lanczos filter.
3.
SUBJECTIVE EXPERIMENT
To evaluate the visual quality of the presented scenarios, we used the Absolute Category Rating (ACR) with 11 lev-els methodology. The details about this methodology can be found in the IUT-T P-910 Recommendation [2]. This methodology uses a single stimulus, in which the viewer is presented one video sequence at a time. For each tested sequence, the viewer gives a score according to the level of perceived quality, located on a scale with 11 levels corre-sponding to adjectives ranging from bad to excellent quality. The test was presented to 26 non-expert viewers. Their age ranged from 19 to 50, with an average of 27. Each test ses-sion took 45 minutes, starting with a visual acuity and Ishi-hara color plate test. According to the video contents, frame formats, up-scaling methods and bitrates included in the ex-periment, 145 videos of 10 seconds each were generated. Af-ter a short training, the viewer was asked to rate each video, presented in random order. They were displayed on a 40-inch diagonal full-HD reference screen (TVLogic LVM401) and the viewing distance was equal to 3 times the height of the display, according to the ITU recommendations.
4.
RESULTS AND DISCUSSION
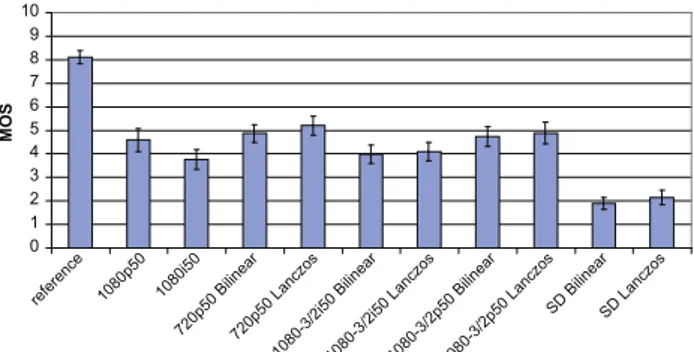
Figures 2 to 4 display the Mean Opinion Scores (MOS) ob-tained on each scenario. Each bar represents the average MOS of a given scenario on the five presented video se-quences. The intervals of confidence are displayed as line segments at the top of each bar. They represent the vari-ability of the opinions of the viewers on the quality scale and can be used as a first approximation for the significance of the difference between MOS. If two intervals of confidence overlap, the difference between the corresponding MOS can be considered non-significant. To provide a more precise sta-tistical analysis, Table 2 includes the results of the student t-test, using the introduced notation. The 29 configurations tested on each video content are compared in terms of sta-tistical difference. If two configurations are not stasta-tistically different, the corresponding cell in Table 2 contains a ‘·’ sym-bol. If two configurations i and j are statistically different, it means it is possible to order them in terms of visual qual-ity. If the MOS of configuration i is higher than the MOS of configuration j, the cell located at the i-th line and j-th column in Table 2 contains a ‘↑’ symbol. In the opposite case (the MOS of configuration i is less than the MOS of configuration j), the cell contains a ‘↓’ symbol.
On the three charts in Figures 2-4, the left-most score cor-responds to the non-coded 1080p50 reference. As expected, this scenario obtains the highest score, as the input format does not need de-interlacing nor up-scaling, and there are no coding artifacts. The difference in MOS between the ref-erence and the coded 1080p stream is comparably high at 3 Mb/s. It shows that the coding artifacts have a strong impact on the visual quality at this bitrate. The difference decreases in the 6 Mb/s scenario to almost 2 MOS levels, and even further for the 9 Mb/s scenario. From Table 2, we can further assess that in this scenario, the coded 1080p stream can not be differentiated from the non-coded video. It can be observed on Figures 2 and 3 that the difference be-tween the MOS of the SD and the HD versions is particularly high. One of the main reasons is that the spatial up-scaling does not conserve the aspect ratio, thus deforming the con-tent. In the 3 Mb/s scenario, the average difference between the SD and the HD conditions is about 2 MOS, while in the 6 Mb/s scenario this difference is about 3 MOS. This demonstrates the advantage of HD when compared to SD in terms of visual quality, in particular for higher bitrates. For MPEG-4 AVC, the quality difference between 6 Mb/s and 9 Mb/s for the SD format was considered to be negligible during a pre-test process, therefore the 9 Mb/s SD condi-tions (i.e.: 9.6.X configuracondi-tions in our notation) were not included in the experiment.
The 1080p stream coded with MPEG-4 AVC obtains a score equivalent to the scores of the up-sampled format 3 and 5 versions in the three bitrate scenarios. The impact of the coding artifacts on visual quality is thus equivalent or slightly higher than the loss in resolution from the spatial up-scaling. This constatation is particularly true in the 3 Mb/s scenario, for which the scores of format 3 are sometimes higher than the scores of format 1. Still, this difference can not be considered as significant from the results of the t-test. The two up-scaling methods show comparable performance
0 1 2 3 4 5 6 7 8 9 10 M O S 1080-3/2i50 Bilinear reference 1080p50 1080i50 720p50 Bilinear720p50 Lanczos
1080-3/2i50 Lanczos1080-3/2p50 Bilinear1080-3/2p50 Lanczos
SD BilinearSD Lanczos
Figure 2: Mean Opinion Scores at 3Mb/s.
0 1 2 3 4 5 6 7 8 9 10 M O S 1080-3/2i50 Bilinear reference 1080p50 1080i50 720p50 Bilinear720p50 Lanczos
1080-3/2i50 Lanczos1080-3/2p50 Bilinear1080-3/2p50 Lanczos
SD BilinearSD Lanczos
Figure 3: Mean Opinion Scores at 6Mb/s.
0 1 2 3 4 5 6 7 8 9 10 M O S 1080-3/2i50 Bilinear reference 1080p50 1080i50 720p50 Bilinear720p50 Lanczos
1080-3/2i50 Lanczos1080-3/2p50 Bilinear1080-3/2p50 Lanczos
Figure 4: Mean Opinion Scores at 9Mb/s.
in the three bitrate scenarios and they are not statistically differentiable in 10 out of 11 cases. The scores of the Lanc-zos method are though slightly higher than the scores of the bilinear method. The bilinear method could be applied in time-critical applications or in contexts where the processing power is limited. A slight advantage can be granted to pro-gressive streams when compared to the interlaced streams. This can be observed between format 1 and format 2, for which the quality change is always statistically significant. An interesting result is that the 1080i50 format encoded at 9 Mb/s is not statistically different from the 1080p50 en-coded at 6 Mb/s. This illustrates the interest of progressive coding against interlaced coding in a medium to high bitrate context.
The results show that formats 1 and 3 are equivalent in terms of visual quality for the 3 and 6 MB/s scenarios (this is also valid in the 9 Mb/s scenario with the Lanczos up-scaling method). A possible explanation is that the down-scaling step performed before encoding the video in 720p50 from
Table 2: Results of the t-test and comparison of the MOS between the tested configurations. Re f 3 .1 3 .2 3 .3. B 3. 3. L 3 .4. B 3. 4. L 3. 5. B 3 .5. L 3. 6. B 3 .6. L 6. 1 6. 2 6. 3. B 6 .3. L 6. 4. B 6 .4. L 6 .5. B 6. 5. L 6 .6. B 6 .6. L 9 .1 9 .2 9 .3. B 9. 3. L 9 .4. B 9 .4. L 9. 5. B 9 .5. L Ref ↑ ↑ ↑ ↑ ↑ ↑ ↑ ↑ ↑ ↑ ↑ ↑ ↑ ↑ ↑ ↑ ↑ ↑ ↑ ↑ ↑ ↑ ↑ ↑ ↑ ↑ ↑ ↑ 3.1 ↓ ↑ · · · ↑ ↑ ↓ ↓ ↓ ↓ ↓ ↓ ↓ ↓ ↑ ↑ ↓ ↓ ↓ ↓ ↓ ↓ ↓ ↓ 3.2 ↓ ↓ ↓ ↓ · · ↓ ↓ ↑ ↑ ↓ ↓ ↓ ↓ ↓ ↓ ↓ ↓ ↑ ↑ ↓ ↓ ↓ ↓ ↓ ↓ ↓ ↓ 3.3.B ↓ · ↑ · ↑ ↑ · · ↑ ↑ ↓ ↓ ↓ ↓ ↓ ↓ ↓ ↓ ↑ ↑ ↓ ↓ ↓ ↓ ↓ ↓ ↓ ↓ 3.3.L ↓ · ↑ · ↑ ↑ · · ↑ ↑ ↓ ↓ ↓ ↓ · ↓ ↓ ↓ ↑ ↑ ↓ ↓ ↓ ↓ ↓ ↓ ↓ ↓ 3.4.B ↓ · · ↓ ↓ · ↓ ↓ ↑ ↑ ↓ ↓ ↓ ↓ ↓ ↓ ↓ ↓ ↑ ↑ ↓ ↓ ↓ ↓ ↓ ↓ ↓ ↓ 3.4.L ↓ · · ↓ ↓ · ↓ ↓ ↑ ↑ ↓ ↓ ↓ ↓ ↓ ↓ ↓ ↓ ↑ ↑ ↓ ↓ ↓ ↓ ↓ ↓ ↓ ↓ 3.5.B ↓ · ↑ · · ↑ ↑ · ↑ ↑ ↓ ↓ ↓ ↓ ↓ ↓ ↓ ↓ ↑ ↑ ↓ ↓ ↓ ↓ ↓ ↓ ↓ ↓ 3.5.L ↓ · ↑ · · ↑ ↑ · ↑ ↑ ↓ ↓ ↓ ↓ ↓ ↓ ↓ ↓ ↑ ↑ ↓ ↓ ↓ ↓ ↓ ↓ ↓ ↓ 3.6.B ↓ ↓ ↓ ↓ ↓ ↓ ↓ ↓ ↓ · ↓ ↓ ↓ ↓ ↓ ↓ ↓ ↓ ↓ ↓ ↓ ↓ ↓ ↓ ↓ ↓ ↓ ↓ 3.6.L ↓ ↓ ↓ ↓ ↓ ↓ ↓ ↓ ↓ · ↓ ↓ ↓ ↓ ↓ ↓ ↓ ↓ ↓ ↓ ↓ ↓ ↓ ↓ ↓ ↓ ↓ ↓ 6.1 ↓ ↑ ↑ ↑ ↑ ↑ ↑ ↑ ↑ ↑ ↑ ↑ · · ↑ ↑ · · ↑ ↑ ↓ · · ↓ · · ↓ ↓ 6.2 ↓ ↑ ↑ ↑ ↑ ↑ ↑ ↑ ↑ ↑ ↑ ↓ ↓ ↓ · · · ↓ ↑ ↑ ↓ ↓ ↓ ↓ ↓ ↓ ↓ ↓ 6.3.B ↓ ↑ ↑ ↑ ↑ ↑ ↑ ↑ ↑ ↑ ↑ · ↑ · ↑ ↑ · · ↑ ↑ ↓ · · ↓ · · ↓ ↓ 6.3.L ↓ ↑ ↑ ↑ ↑ ↑ ↑ ↑ ↑ ↑ ↑ · ↑ · ↑ ↑ ↑ · ↑ ↑ ↓ · · ↓ · · · ↓ 6.4.B ↓ ↑ ↑ ↑ · ↑ ↑ ↑ ↑ ↑ ↑ ↓ · ↓ ↓ · ↓ ↓ ↑ ↑ ↓ ↓ ↓ ↓ ↓ ↓ ↓ ↓ 6.4.L ↓ ↑ ↑ ↑ ↑ ↑ ↑ ↑ ↑ ↑ ↑ ↓ · ↓ ↓ · · ↓ ↑ ↑ ↓ ↓ ↓ ↓ ↓ ↓ ↓ ↓ 6.5.B ↓ ↑ ↑ ↑ ↑ ↑ ↑ ↑ ↑ ↑ ↑ · · · ↓ ↑ · · ↑ ↑ ↓ · ↓ ↓ · · ↓ ↓ 6.5.L ↓ ↑ ↑ ↑ ↑ ↑ ↑ ↑ ↑ ↑ ↑ · ↑ · · ↑ ↑ · ↑ ↑ ↓ · · ↓ · · ↓ ↓ 6.6.B ↓ ↓ ↓ ↓ ↓ ↓ ↓ ↓ ↓ ↑ ↑ ↓ ↓ ↓ ↓ ↓ ↓ ↓ ↓ · ↓ ↓ ↓ ↓ ↓ ↓ ↓ ↓ 6.6.L ↓ ↓ ↓ ↓ ↓ ↓ ↓ ↓ ↓ ↑ ↑ ↓ ↓ ↓ ↓ ↓ ↓ ↓ ↓ · ↓ ↓ ↓ ↓ ↓ ↓ ↓ ↓ 9.1 ↓ ↑ ↑ ↑ ↑ ↑ ↑ ↑ ↑ ↑ ↑ ↑ ↑ ↑ ↑ ↑ ↑ ↑ ↑ ↑ ↑ ↑ ↑ · ↑ ↑ · · 9.2 ↓ ↑ ↑ ↑ ↑ ↑ ↑ ↑ ↑ ↑ ↑ · ↑ · · ↑ ↑ · · ↑ ↑ ↓ · ↓ · · ↓ ↓ 9.3.B ↓ ↑ ↑ ↑ ↑ ↑ ↑ ↑ ↑ ↑ ↑ · ↑ · · ↑ ↑ ↑ · ↑ ↑ ↓ · ↓ · · · ↓ 9.3.L ↓ ↑ ↑ ↑ ↑ ↑ ↑ ↑ ↑ ↑ ↑ ↑ ↑ ↑ ↑ ↑ ↑ ↑ ↑ ↑ ↑ · ↑ ↑ ↑ ↑ · · 9.4.B ↓ ↑ ↑ ↑ ↑ ↑ ↑ ↑ ↑ ↑ ↑ · ↑ · · ↑ ↑ · · ↑ ↑ ↓ · · ↓ · ↓ ↓ 9.4.L ↓ ↑ ↑ ↑ ↑ ↑ ↑ ↑ ↑ ↑ ↑ · ↑ · · ↑ ↑ · · ↑ ↑ ↓ · · ↓ · ↓ ↓ 9.5.B ↓ ↑ ↑ ↑ ↑ ↑ ↑ ↑ ↑ ↑ ↑ ↑ ↑ ↑ · ↑ ↑ ↑ ↑ ↑ ↑ · ↑ · · ↑ ↑ · 9.5.L ↓ ↑ ↑ ↑ ↑ ↑ ↑ ↑ ↑ ↑ ↑ ↑ ↑ ↑ ↑ ↑ ↑ ↑ ↑ ↑ ↑ · ↑ ↑ · ↑ ↑ ·
1080p50 acts as a low-pass filter on the original video. Small irregularities and noise from the original sequence can thus be smoothed in the down-scaled version, which in some cases eases the encoding. This also holds for the receiver as the up-scaling process might counteract the blocking artifacts. In our experiment it was observed that the up-scaled video can have a quality that is very close to the 1080p50 video when using a high quality up-scaler such as the bilinear or the Lanczos filter. Thus a transmission in 720p50, 1280×1080p and 1280×1080i formats may be considered. This might be advantageous for the sender or the receiver. Due to the smaller resolution, the computational complexity of the encoding and decoding is reduced. Since the down-scaling and up-down-scaling operations do usually not require an equivalent amount of computation, the overall complexity is reduced. Thus, on the sender side computational resources might be reallocated in order to evaluate more sophisticated video coding options. On the receiver side, the up-scaling is usually performed by hardware, e.g. the graphics card. As a result the reduced computational complexity in the decoder might lead to a longer battery life in the case of a portable device. A disadvantage of decoding a lower resolution video might be the increased memory bandwidth requirement re-sulting from this two-step approach in which an intermediate image has to be stored.
5.
CONCLUSION
In this paper, we used the results of subjective tests to compare the performance of various High-Definition video formats coded with MPEG-4 AVC/H.264. Spatial up-scaling and de-interlacing were performed to display a full-HD stream independently from the encoded format. Using both graphical and statistical analysis, the results show that with equivalent bitrate, the difference in quality between the streams coded directly in full-HD and the interlaced and down-scaled streams is mostly not visually significant.
6.
REFERENCES
[1] ITU-R BT.709-5 Recommendation. Parameter values for the HDTV standards for production and
international programme exchange. 2004.
[2] ITU-T P.910 Rec. Subjective video quality assessment methods for multimedia appl. 1996.
[3] J. Ostermann, J. Bormans, P. List, D. Marpe, M. Narroschke, F. Pereira, T. Stockhammer, and T. Wedi. Video Coding with H.264 / AVC: Tools, Performance & Complexity. IEEE Circuits & Systems Magazine, 2004. [4] Joint Video Team. MPEG-4 AVC/H.264 reference
encoder software. http://iphome.hhi.de/suehring/tml/. [5] T. Wiegand, G. Sullivan, G. Bjontegaard, and
A. Luthra. Overview of the H.264/AVC video coding standard. IEEE TCSVT, 13(7):560–576, July 2003.