HAL Id: hal-02586181
https://hal.archives-ouvertes.fr/hal-02586181
Submitted on 24 Nov 2020HAL is a multi-disciplinary open access
archive for the deposit and dissemination of sci-entific research documents, whether they are pub-lished or not. The documents may come from teaching and research institutions in France or abroad, or from public or private research centers.
L’archive ouverte pluridisciplinaire HAL, est destinée au dépôt et à la diffusion de documents scientifiques de niveau recherche, publiés ou non, émanant des établissements d’enseignement et de recherche français ou étrangers, des laboratoires publics ou privés.
Application of the cold sintering process to the
electrolyte material BaCe0.8Zr0.1Y0.1O3-δ
K. Thabet, E. Quarez, O. Joubert, A. Le Gal La Salle
To cite this version:
K. Thabet, E. Quarez, O. Joubert, A. Le Gal La Salle. Application of the cold sintering process to the electrolyte material BaCe0.8Zr0.1Y0.1O3-δ. Journal of the European Ceramic Society, Elsevier, 2020, 40 (9), pp.3445-3452. �10.1016/j.jeurceramsoc.2020.03.043�. �hal-02586181�
Original Article
Application of the cold sintering process to the
electrolyte material BaCe
0.8
Zr
0.1
Y
0.1
O
3-δ
Abstract
This paper describes and discusses the application of the original sintering process named cold sintering to the electrolyte material BaCe0.8Zr0.1Y0.1O3- δ to enhance its densification at a temperature below that needed in a conventional sintering. This new technique enables the acceleration of the densification resulting in a more compacted microstructure with an unexpected high relative density of 83% at only 180 °C. A subsequent annealing at 1200 °C further enhances the densification which reaches 94 %. The electrochemical performance of CSP sintered ceramics was investigated and optimized by varying different process parameters. The comparison with the conventional sintered material reveals an increase of the total conductivity by mostly increasing the grain boundary one. This result emphasizes the benefits of CSP to not only reduce the sintering temperature but also to enhance the electrochemical properties.
Keywords
: Fuel cell; Sintering; Cold sintering; Protonic conductive ceramic; Impedance spectroscopy1
Introduction
BCZY type proton conducting electrolyte such as BaCe0.8Zr0.1Y0.1O3-δ-3 has gained a great attention as one of the most promising candidate for intermediate temperature solid oxide fuel cells, due to the combination of a high bulk conductivity associated to a chemical stability [ 1 ]. However, some of challenges to manufacture a dense BCZY ceramic are the high sintering temperature typically 1500 to –1600 °C [2–6 ], and the long processing duration in conventional method which can damage the material and cause barium evaporation resulting in a decrease of electrochemical properties [ 7 , 8 ]. Numerous studies have been carried out to improve
K. Thabet, E. Quarez, O. Joubert, A.Le Gal La Salle* Annie.Legal@cnrs-imn.fr
Institut Des Matériaux Jean Rouxel (IMN), CNRS, UMR 6502, Université De Nantes, France
⁎Corresponding author.
the sinterability of BCZY electrolyte material by varying its composition. Results have shown that BCZY performance is strongly dependent on Zr/Ce ratio, and a formula of BaCe0.8Zr0.1Y0.1O3- δ can be a good compromise with a sintering temperature of 1400 °C and a high conductivity level in dry air above 10-2 S. cm-−2 S. cm−1 at 700 °C, for a sample of 92% relative density [1]. In the same context, researches have shown
that introducing sintering aids such as ZnO, NiO, CuO, or Al2O3 [9–13], can often decrease the sintering temperature without lowering the electrochemical properties. Always with the aim of saving energy, many innovative processes, assisted by modern techniques such as spark plasma sintering (SPS) or Flash sintering have been developed and successfully demonstrated to be effective in accelerating the diffusion process and increasing the driving force for densification. However, temperature required to obtain a dense ceramic with standard densification processes is generally higher than 1100 °C. More recently, a novel sintering process inspired from hydrothermal method has been developed in Randall group from Pennsylvania State University [
14–18]. This original technique called cold sintering has been reported to have densified a large range of ceramic materials at a very low temperature <200 °C [14] compared to the usual sintering temperatures, using an appropriate amount of liquid phase (3-–30 wt%) leading to dense ceramic materials of 80-99–99 % relative density [15], under pressure going from 50 to 500 MPa during a short time period of 1-−60 min [16,17]. In a previous paper [19], we demonstrated the feasibility of applying the cold sintering process to a refractory ceramic material with an incongruent dissolution. One of the main achievement was the reduction of the sintering temperature in comparison with the conventional method. The use of water as liquid transient resulted in higher densification, however, it also generates the formation of a secondary phase. This phenomenon has been reported in literature with different incongruent material such as BaTiO3 and PZT [16,
18], [20,21]. The impurity phase can be removed by optimizing the amount of solvent and proceeding with a post heat treatment. This paper aimed essentially to study the electrochemical properties of the BCZY electrolyte obtained by cold sintering process. The evolution of the electrochemical behavior of bulk and grain boundaries as function of the different process parameters is investigated.
2
Experimental procedure
2.1
Powder synthesis
BCZY powder of composition BaCe0.8Zr0.1Y0.1O3- δ, was synthesized by nitrate-glycine method as described in previous work [1]. Stoichiometric amounts of metal nitrate salts precursors: Ba(NO3)2, Ce(NO3)3, ZrO(NO3)2, and Y(NO)3 were dissolved separately in deionized water under stirring on a hot-plate then mixed together. Glycine, used as the fuel of the autocombustion reaction, is added to the mixture with a subsequent use of an ammonia solution to neutralize the pH. The final solution is heated at 80 °C under magnetic stirring until evaporation of water and formation of a viscous gel, which was burned into powder by self-combustion. The powder undergoes a further calcination treatment at 1000 °C to remove organic compounds.
2.2
Pellet preparation and cold sintering
A set of experiments was undertaken to evaluate the effects of the cold sintering parameters. The calcined powder was mixed with different quantities of deionized water ranging from 5 to 20 wt%, then manually
ground using pestle and mortar. The wetted powder was transferred into a steel die with a diameter of 10 mm and uniaxially pressed using pressures ranging from 125 to 500 MPa. A heater jacket was wrapped around the die while pressing, and the temperature was ramped up at 5 °C/min rate and held isothermally for 30 minutes. The cold sintered pellets were subsequently annealed at 1000-1200 C during 10 hours−1200 °C during 10 h to obtain fully dense ceramics. For the sake of comparison, green pellets, considered as reference samples, were just dry pressed at room temperature without water addition.
In order to evaluate the effect of cold sintering on structure and conductivity, cold-sintered samples were compared to those prepared by nitrate-glycine method, calcined at 1000 °C, and sintered at 1400 °C, i.e. corresponding to optimal conditions of our previous work [1].
2.3
Characterization
X-ray diffraction (XRD) patterns were recorded on the pellets at room temperature using a Bruker D8 Advance diffractometer in Bragg-Brentano geometry with a Cu anode X-ray source (λCu Kα1 = 1.5406 Å) in the 10-−80° 2θ range with a step size of 0.017° and a time per step of 0.82 s. The cell parameters are refined using the program FULLPROF with the interface WinPLOTR.
The microstructure and morphology of proton conducting ceramic pellets was investigated by scanning electron microscopy (JEOL 5800 SEM) and the composition of pellets was performed using SEM-energy dispersive X-ray spectroscopy (EDX).
Sample densities were calculated by measuring the mass and the geometric dimensions of the pellets and the relative density was determined by using 6.25 g/cm3 as theoretical density for BCZY [1].
2.4
Electrochemical measurements
Electrochemical impedance spectroscopy (EIS) was performed using a frequency response analyzer Solartron 1260 in the frequency range of 4MHz-0.1 Hz. This later value has been optimized in order to get the best signal to noise ratio without any loss of the transfer function linearity [22,23]. Measurements were recorded at UDC = 0 V, with a perturbation signal amplitude of 100 Mv, under both dry and wet atmospheres from 800 to 150 °C every 50 °C with a stabilization time of 20 minutes. The gas was dried by passing through a column of silica gel and humidification was obtained by bubbling gas through water. Gold electrodes were formed on each side of the pellet by painting a gold ink followed by heating at 120 °C for 30 min. The impedance spectra were fitted and evaluated using the ZView2 software [24].
3
Results
3.1
Effect of the CSP parameters
The electrolyte material performance depends on the sintering process parameters such as quantity of solvent, cold sintering temperature or pressure. The optimization of these parameters and the study of their effect on the electrolyte microstructure and electrochemical behaviour have been first investigated.
Different samples were obtained by adding 5, 10 and 20 wt% of water, before being cold sintered under 375 MPa at 180 °C during 30 min and finally heated at 1200 °C during 10 hours. The electrochemical impedance spectra were recorded between 150 °C and 800 °C under dry atmosphere. For example, Fig. 1
compares the Nyquist plots obtained at two different temperatures (158 °C and 548 °C) for the sample prepared with 5 wt% of water.
At low temperature, i.e. 158 °C, three semi-circles are observed at high and low frequencies. This response can be described using an equivalent circuit model composed by a combination of electrical elements: an inductance L0, related to the wires, in series with three (R1//CPE1), (R2//CPE2) and (R3//CPE3) elements, for which the impedance formula of the constant phase elements (CPE) is 1/Q (jω)n. The corresponding real
capacitance values, calculated using the fitting parameters R (resistance), Q (pseudo-capacitance) and n from the formula C = R(1-−n)/nQ1/n. For all samples, L
0 ranges between 10-6 and 10-−6 and 10−7 Hz. This value
agrees well with these observed in literature using similar testing set-ups [ 25 ]. The real capacitances are respectively of 1.0 10-10 F. cm-2, 1.0 10-8 F. cm-2 and 1.0 10-6 F. cm-−10 F. cm−2, 1.0 10−8 F. cm−2 and 1.0 10−6 F. cm−2, suggesting that only the two first semi-circles correspond to electrolyte processes, whereas the third
one is correlated to electrode one. It seems therefore possible to assign the first (R1//CPE1) to the bulk electrolyte contribution with a resistance R1 of 2076 Ω cm2, and (R2//CPE2) to the grain boundary with a resistance R2 of 8087 Ω cm2.
On increasing the temperature to 548 °C, the impedance spectra lose gradually the response attributed to the grain boundary. This latter is shifted outside the frequency range of measurement and only electrode response is observable. The Nyquist plot can be fitted with an inductance L0, in series with a resistance R0 and one (R1//CPE1) element of true capacitance of 2.0 10-6 F. cm-−6 F. cm−2. Consequently, at this temperature, the
resistance R0 of 9 Ω cm2 can be attributed to both bulk and grain boundary, however the resistances R
1 can be
assigned to electrode contribution.
alt-text: Fig. 1
Fig. 1
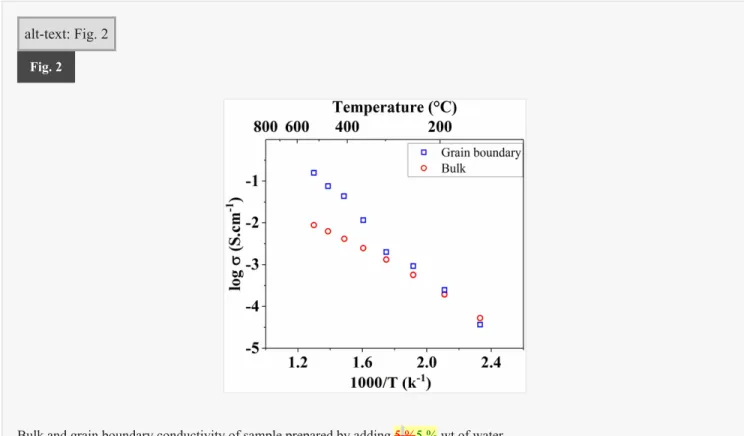
Fig. 2 illustrates, for this sample, the evolution of the bulk and grain boundary conductivity as function of temperature. Two distinct regimes of conductivities operating in two different temperature zones can be distinguished. In the low temperature range <200 °C, the bulk conductivity is observed to be slightly higher. For this temperature range the total conductivity is therefore limited by the grain boundary. At 200 °C, the curves intersected and the two contributions exhibit a same conductivity level. A noticeable change occurred for temperatures higher than 200 °C, for which the total conductivity is limited by the bulk since the grain boundary conductivity is actually higher.
Fig. 3 illustrates the effect of solvent quantity on the electrochemical properties of the different samples. While similar conductivity level is obtained with 5 wt% and 10 wt% of solvent addition, the electrochemical response of the pellet obtained with 20 wt% of water is significantly lower. The associated evolution of bulk and grain boundaries is detailed in Fig. 3 B-C. The evolution of the bulk conductivity seems to be the same as for the total conductivity, with a significant decrease of electrochemical performance observed only with the addition of 20 wt% of water. The grain boundary conductivity appears to be more affected by water addition and increasingly lowered by the increase of water quantity. The microstructure illustrated in Fig. 4 shows the appearance of a secondary phase (white dots) in the interstitial space between grains for pellets obtained with 10 wt% of water. By increasing the solvent quantity to 20 wt% the presence of cracks is clearly seen. EDX mapping on Fig. 5 confirms this result and demonstrates that the grain boundaries are carbon, oxygen and barium rich, which leads us to think that the impurity phase is related to the presence of BaCO3. This latter non-conducting phase is probably the principal cause of the grain boundary conductivity decrease.
alt-text: Fig. 2
Fig. 2
Bulk and grain boundary conductivity of sample prepared by adding 5 %5 % wt of water.
Fig. 3
Conductivity evolution as function of water quantity: (A) Total conductivity, (B) grain boundary conductivity and (C) bulk conductivity.
alt-text: Fig. 4
Fig. 4
Ccross section microstructure of cold sintered pellet with different solvent quantity after annealing at 1200 °C.
alt-text: Fig. 5
3.1.2
Effect of the cold-sintering temperature
Different electrolyte specimens were prepared with 5 wt% of water and under 375 MPa at different temperatures (called "cold-sintering temperature") comprised in the 120 °C-–180 °C range. Fig. 6 illustrates the relative density evolution of pellets as a function of the cold-sintering temperature, just after cold sintering and after annealing at 1200 °C. For the as cold sintered pellet, the obtained densities are relatively low (< 7575
%) when the sintering temperature is lower than 180 °C, whereas an increase of the relative density is observed at 180 °C reaching a value of 83%. After the annealing step, comparable density values, comprised in the 92%-94 %–94 % range, are obtained for all samples. To understand the correlation between the microstructure and the electrochemical properties, impedance measurements were performed on the different specimens and results are shown in Fig. 7 A. Although respective microstructures ( Fig. 8 ) seem to be strongly dependent on cold sintering temperature, the total conductivities of samples are comparable in the whole measurement temperature range. To further investigate this behaviour, grain and grain boundary response have been extracted from impedance spectra. Conductivity vs reciprocal temperature evolutions are detailed in Fig. 7 B-C. The same tendency is observed for the bulk conductivity since Arrhenius plots of the different samples are superimposed. This behaviour is consistent with microstructure observations showing similar bulk sizes after annealing at 1200 °C (10 µm). For the grain boundary, the conductivity displays different behaviours depending on the measurement temperature. At high temperature, the grain boundary exhibits a same conductivity level for all samples, however at low temperature the decrease of cold sintering temperature induces a decrease of the grain boundary conductivity. The microstructure presented in Fig. 8 confirms these
EDX mapping of pellet obtained with 10 wt% of water (For interpretation of the references to colour in this figure legend, the reader is referred to the web version of this article)..
results and shows the presence of cracks and porosity at 120 °C and 140 °C respectively, which can explain the lower electrochemical performance compared to the cold sintered sample at 180 °C.
alt-text: Fig. 6
Fig. 6
Relative density evolution before and after annealing as function of cold sintering temperature.
alt-text: Fig. 7
Fig. 7
Conductivity evolution, after annealing at 1200 °C, as function of cold sintering temperature: (A) Total conductivity, (B) grain boundary conductivity and (C) bulk conductivity.
alt-text: Fig. 8
3.1.3
Effect of the cold-sintering pressure
Different electrolyte specimens were prepared with 5 wt% of water at 180 °C under different pressures comprised in the 125 MPa-500 MPa range. For the as cold sintered pellets, the obtained densities are relatively low (< 7575 %) except for the sintering pressure of 375 MPa, where a value of 83% is observed [ 19 ]. After the annealing step, comparable density values comprised in the 92%-94 %–94 % range are obtained for all samples, and electrochemical impedance measurements reveal no noticeable influence of the pressure.
3.2
Effect of the sintering treatment
As outlined in literature, the substantial benefits of CSP was to reduce sintering/post heat treatment temperature required to achieve a dense material with high conductivity level compared to the conventional method. In this work, experiments were performed by lowering the annealing temperature, and even by eliminating the post heat treatment. As an initial result, the comparison between an as-CSP pellet (obtained under 375 MPa at 180 °C using 5 wt% of water) and a green pellet that was just dry pressed demonstrates a great improvement in the relative density from 62% to 83 % to 83 %. The SEM observations presented on Fig. 9 A-B confirm this result, showing more aggregated particles with the formation of densification necks in the case of CSP ( Fig. 9 B). Fig. 10 A shows that a further annealing at 1200 °C can enhance the densification (94
%) leading to a great increase of the conducting properties in the entire temperature range compared to the non-post annealed cold sintered pellet. As mentioned previously, at low temperature, the contribution of bulk and grain boundary can be clearly distinguished and seems to be more important for the non-sintered pellet. In contrast, at high temperature we can only determine the total resistance of the electrolyte. At 685 °C for instance a decrease of the total electrolyte resistance from 84 to 5 Ω.cm² is observed after annealing at 1200 °C. Fig. 10 B-C collects the evolution of grain and grain boundary conductivity before and after annealing in the temperature range within which they can be determined. The post heat treatment can drastically increase the conductivity of grain and especially grain boundary. To explain this evolution trend, the cross section microstructure of the two samples was investigated by SEM and illustrated in Fig. 9 B-C. For the non-sintered sample, a small grain size with some distributed pores can be observed, consistent with the high measured total resistances. After annealing at 1200 °C, the sample showed a grain growth and well interconnected particle with clear edges resulting in a decrease of the total resistances.
Cross section microstructure of pellets cold sintered at different temperature, after annealing at 1200 °C.
alt-text: Fig. 9
To investigate the effect of the annealing step on electrochemical performance, a post heat treatment was performed on cold sintered pellets during 10 hours at 1000 °C, 1100 °C and 1200 °C. Results presented in Fig. 11 A show that the increase of the annealing temperature is followed by an enhancement of the conductivity level from 3.4 10-3 S. cm-−3 S. cm−1 at 1000 °C to 2.05 10-2 S. cm-−2 S. cm−1 at 1100 °C reaching a maximum
of 4.10-−2 S. cm-1 at 1200 °C with a relative density of 94%. The differences in conductivity seem to be more
important at the intermediate temperatures around 300 °C and the decrease of the total conductivity is mostly due to the grain boundary component ( Fig. 11 B). The microstructure systematic trend of the different specimens, illustrated in Fig. 12 , shows a denser microstructure with more interconnected particles and lower porosity, with simultaneous increase of particle size by increasing the annealing temperature.
Cross section view of (A) green pellet, (B) cold sintered pellet and (C) cold sintered pellet after annealing. (For interpretation of the references to colour in this figure legend, the reader is referred to the web version of this article).
alt-text: Fig. 10
Fig. 10
Conductivity evolution before and after post heat treatment: (A) total conductivity, (B) grain boundary conductivity and (C) Bulk conductivity.
alt-text: Fig. 11
4
Discussion
Previous results for samples prepared by conventional sintering in our group are recalled on Fig. 13 [ 1 ]. For these samples, we obtained an evolution trend similar to Fig. 2 , i.e. the total conductivity of the sample limited at low temperatures by the grain boundary, and at high temperatures by the bulk, but the intersection of the two curves was observed at higher temperature, near 530 °C, instead of 200 °C, as it was shown on Fig. 2 .
Conductivity evolution as function of temperature: (A) total, (B) grain boundary and (C) bBulk.
alt-text: Fig. 12
Fig. 12
Microstructure of cross section of cold sintered pellet annealed at different temperatures: (A) 1000 °C, (B) 1100 °C, and (C) 1200 °C.
alt-text: Fig. 13
As previously demonstrated, the main benefit of the cold sintering consists in the acceleration of the densification process since a relatively higher density of 83% is achieved at only 180 °C compared to the dry pressed specimen of 63% theoreticalrelative density. The substantial advantage that can be obtained from this, is the decrease of the annealing temperature and the sintering duration. These two parameters have been lowered from 1400 °C during 12 hours for the conventional sintered sample to 1200 °C during 10 hours for the cold sintered one. Here, in order to point out the key processing advantage, apart from temperature lowering, the effect of cold sintering on the microstructure and the electrochemical performance have been investigated. Impedance measurements were performed on cold sintered ceramic and were compared to the conventional sintered one. Fig. 14 illustrates the conductivity curves of the two different samples. Based on the presented results, an appreciable enhancement in the electrochemical performance is achieved through the cold sintering process. At high temperature, it is noticed that the conductivity level of the conventional sintered specimen is lower, and continues to decrease gradually with the decreasing of temperature measurement. To explain the enhancement of the total conductivity, the grain and grain boundary contributions were separated. The results are shown in Fig. 14 C. The bulk conductivity of the cold sintered sample is particularly higher, but is nevertheless close to the conventional sintered one. However, it is obvious, that the increase of the total conductivity is mostly related to a higher grain boundary conductivity.
Bulk and grain boundary conductivity of sample prepared by conventional sintering [ref 1].
alt-text: Fig. 14
The X-ray diffraction patterns, after Le Bail refinements of BaCe0.8Zr0.1Y0.1O3- δ cold and conventional sintered pellets performed in orthorhombic Imma space group [ 26 ], are shown in Fig. 15 . The cell parameters, volumes, peak relative intensity and shape are similar between cold and conventional sintered samples suggesting that the structure of the ionic conductor does not seem to be modified by the use of the CSP method. This result agrees well with impedance measurements showing that the difference of the total conductivity between cold and conventional sintering samples is mainly due to the difference of grain boundary conductivity ( Fig. 14 B), the bulk conductivity being quite similar ( Fig. 14 C).
In order to further investigate the conductivity mechanisms, experiments were performed under both dry and wet atmospheres. Samples were measured during heating and cooling in the temperature range of 150 -−800 °C, always with steps of 50 °C. In Fig. 16 , total conductivities of the cold sintered samples after annealing step, obtained under different conditions are compared. At low temperature, the total conductivity in
Comparison of conductivity between cold and conventional sintering: (A) total conductivity, (B) gGrain boundary conductivity
and (C) bBulk conductivity.
alt-text: Fig. 15
Fig. 15
Observed (circles) and calculated (solid line) powder XRD patterns and their difference (bottom line) of A) cold sintered BCZY pellet after post heat treatment at 1200 °C during 10 hours and B) conventional sintered BCZY at 1400 °C during 12 hours.
wet atmosphere is slightly higher than the one obtained in dry air indicating the assumption of protons as charge carries in wet atmosphere. When increasing the temperature above 400 °C, samples exhibit comparable responses, suggesting a decrease of the proton contribution at high temperature due to dehydration [27].
5
Conclusion
In summary, this work has shown the possibility to use the cold sintering process (CSP) to densify a proton refractory electrolyte material with incongruent dissolution issue (BCZY). Different parameters have been optimized and the electrolyte material was successfully cold sintered leading to a high relative density of 83%, at low temperature equal to 180 °C under 375 MPa using 5 % wt of water. Compared to the 63 % relative density of the "dry" pressed specimen, this result shows the power of the CSP technique. Subsequent annealing at temperature lower than that of the traditional sintering (1200 °C instead of 1400 °C) further improves the relative density which reaches 94 %, and remarkably increases the total conductivity to 4 10-2 S. cm-−2 S. cm−1 at 700 °C by mostly increasing the grain boundary conductivity. In contrast, the grain conductivity
exhibits a small variation in accordance with the lack of structural change confirmed by X-ray powder diffraction. The process demonstrated here can offer opportunities to manufacture in one-step solid oxide fuel cell by co-pressing and co-firing the electrolyte and electrodes at lowered temperature and for shorter duration.
Funding
This research did not receive any specific grant from funding agencies in the public, commercial, or not-for-profit sectors.
Declaration of Competing Interest
None.References
alt-text: Fig. 16
Fig. 16
i The corrections made in this section will be reviewed and approved by a journal production editor. The newly added/removed references and its citations will be reordered and rearranged by the production team.
[1] Thabet K., Devisse M., Quarez E., Joubert O., Salle et A.Le Gal La, Influence of the autocombustion synthesis conditions and the calcination temperature on the microstructure and electrochemical properties of BaCe0.8Zr0.1Y0.1O3−δ electrolyte material, Solid State Ionics.Solid State Ion. 325 (November) (2018) 48–56, doi:10.1016/j.ssi.2018.07.030.
[2] Iguchi F., Yamada T., Sata N., Tsurui T., Yugami H., The influence of grain structures on the electrical conductivity of a BaZr0.95Y0.05O3 proton conductor, Solid State Ionics.Solid State Ion. 177 (October 26) (2006) 2381–2384, doi:10.1016/j.ssi.2006.07.008.
[3] Bohn H.G., Schober T., Electrical Conductivity of the High-Temperature Proton Conductor BaZr0.9Y0.1O2.95Electrical conductivity of the high-temperature proton conductor BaZr0.9Y0.1O2.95, Journal of the American Ceramic Society. Am. Ceram. Soc.J. Am. Ceram. Soc. 83 (4) (2000) 768–772, doi:10.1111/j.1151-2916.2000.tb01272.x.
[4] Guo Y., Lin Y., Ran R., Shao Z., Zirconium doping effect on the performance of proton-conducting BaZryCe0.8−yY0.2O3−δ (0.0≤y≤0.8) for fuel cell applications, Journal of Power SourcesJ. Power Sources 193 (September 2) (2009) 400–407, doi:10.1016/j.jpowsour.2009.03.044.
[5] Guo Y., Ran R., Shao Z., Liu S., Effect of Ba nonstoichiometry on the phase structure, sintering, electrical conductivity and phase stability of Ba1±xCe0.4Zr0.4Y0.2O3−δ (0≤x≤0.20) proton conductors, International Journal of Hydrogen EnergyInt. J. Hydrogen Energy 36 (14) (2011) 8450–8460 juill, doi:10.1016/j.ijhydene.2011.04.037.
[6] Reddy G.S., Bauri R., A novel route to enhance the sinterability and its effect on microstructure, conductivity and chemical stability of BaCe0.4Zr0.4Y0.2O3-δ proton conductors, Materials Chemistry and Physics. Chem. Phys.Mater. Chem. Phys. 216 (September) (2018) 250–259, doi:10.1016/j.matchemphys.2018.05.023.
[7] Katahira K., Kohchi Y., Shimura T., Iwahara H., Protonic conduction in Zr-substituted BaCeO3, Solid State Ionics.Solid State Ion. 138 (December 1) (2000) 91–98, doi:10.1016/S0167-2738(00)00777-3.
[8] Babilo P., Uda T., Haile S.M., Processing of yttrium-doped barium zirconate for high proton conductivity, Journal of Materials Research. Mater. Res.J. Mater. Res. 22 (May 5) (2007) 1322– 1330, doi:10.1557/jmr.2007.0163.
[9] Park K.-Y., Seo Y., Kim K.B., Song S.-J., Park B., Park J.-Y., Enhanced proton conductivity of yttrium-doped barium zirconate with sinterability in protonic ceramic fuel cells, Journal of
Alloys and Compounds. Alloys Compd.J. Alloys Compd. 639 (2015) 435–444 août, doi:10.1016/j.jallcom.2015.03.168.
[10] Babilo P., Haile S.M., Enhanced Sintering of Yttrium-Doped Barium Zirconate by Addition of ZnOJournal of the American Ceramic Societysintering of yttrium-doped barium zirconate by addition of ZnOEnhanced sintering of yttrium-doped barium zirconate by addition of ZnO, J. Am. Ceram. Soc. 88 (9) (2005) 2362–2368, doi:10.1111/j.1551-2916.2005.00449.x.
[11] Tao J., Irvine T.S., Conductivity studies of dense yttrium-doped BaZrO3 sintered at 1325°C, Journal of Solid State Chemistry. Solid State Chem.J. Solid State Chem. 180 (December 12) (2007) 3493–3503, doi:10.1016/j.jssc.2007.09.027.
[12] Costa R., Grünbaum N., Berger M.-H., Dessemond L., Thorel A., On the use of NiO as sintering additive for BaCe0,9Y0,1O3−α, Solid State Ionics.Solid State Ion. 180 (11) (2009) 891–895 juin, doi:10.1016/j.ssi.2009.02.018.
[13] Sun Z., Fabbri E., Bi L., Traversa E., Electrochemical Properties and Intermediate-Temperature Fuel Cell Performance of Dense Yttrium-Doped Barium Zirconate with Calcium AdditionJournal of the American Ceramic Societyproperties and intermediate-temperature fuel cell performance of dense yttrium-doped barium zirconate with calcium additionElectrochemical properties and intermediate-temperature fuel cell performance of dense yttrium-doped barium zirconate with calcium addition, J. Am. Ceram. Soc. 95 (2) (2012) 627–635, doi:10.1111/j.1551-2916.2011.04795.x.
[14] C.A. Randall, J. Guo, A. Baker, M. Lanagan, H. GUO, Cold sintering ceramics and composites », US20170088471A1,30-mars-2017.
[15] Guo J., et al., Cold Sintering: A Paradigm Shift for Processing and Integration of CeramicsAngewandte Chemie International Editionsintering: a paradigm shift for processing and integration of ceramicsCold sintering: a paradigm shift for processing and integration of ceramics, Angew. Chemie Int. Ed. 55 (38) (2016) 11457–11461, doi:10.1002/anie.201605443. [16] Guo H., Baker A., Guo J., Randall C.A., Protocol for Ultralow-Temperature Ceramic Sintering:
An Integration of Nanotechnology and the Cold Sintering ProcessProtocol for ultralow-temperature ceramic sintering: an integration of nanotechnology and the cold sintering process, ACS Nano 10 (November 11) (2016) 10606–10614 doi:10.1021/acsnano.6b03800.
[17] Guo H., Baker A., Guo J., Randall C.A., Cold Sintering Process: A Novel Technique for Low-Temperature Ceramic Processing of FerroelectricsCold sintering process: a novel technique for low-temperature ceramic processing of ferroelectrics, Journal of the American Ceramic Society. Am. Ceram. Soc.J. Am. Ceram. Soc. 99 (11) (2016) 3489–3507, doi:10.1111/jace.14554.
[18] Guo H., Guo J., Baker A., Randall C.A., Hydrothermal-Assisted Cold Sintering Process: A New Guidance for Low-Temperature Ceramic SinteringHydrothermal-assisted cold sintering process:
a new guidance for low-temperature ceramic sintering, ACS Appl. Mater. Interfaces 8 (32) (2016) 20909–20915 août, doi:10.1021/acsami.6b07481.
[19] Thabet K., Le Gal La Salle A., Quarez E., joubert O., High Performance Dense Proton Ceramic Electrolyte Material Obtained by Cold Sintering ProcessHigh performance dense proton ceramic electrolyte material obtained by cold sintering process, Electrochemical Society Transactions. Soc. Trans.Electrochem. Soc. Trans. 91 (2019) 983–996, doi:10.1149/09101.0983ecst.
[20] Medvedev D., Murashkina A., Pikalova E., Demin A., Podias A., Tsiakaras P., BaCeO3: Materials development, properties and applicationBaCeO3: materials development, properties and application, Progress in Materials Science. Mater. Sci.Prog. Mater. Sci. 60 (2014) 72–129 mars, doi:10.1016/j.pmatsci.2013.08.001.
[21] Fabbri E., D’Epifanio A., Di Bartolomeo E., Licoccia S., Traversa E., Tailoring the chemical stability of Ba(Ce0.8−xZrx)Y0.2O3−δ protonic conductors for Intermediate Temperature Solid Oxide Fuel Cells (IT-SOFCs), Solid State Ionics.Solid State Ion. 179 (15) (2008) 558–564 juin, doi:10.1016/j.ssi.2008.04.002.
[22] Huang Q.-A., Hui R., Wang B., Zhang J., A review of AC impedance modeling and validation in SOFC diagnosis, Electrochimica ActaElectrochim. Acta 52 (November 28) (2007) 8144–8164, doi:10.1016/j.electacta.2007.05.071.
[23] Klotz D., Weber A., Ivers-Tiffée E., Practical Guidelines for Reliable Electrochemical Characterization of Solid Oxide Fuel CellsPractical guidelines for reliable electrochemical characterization of solid oxide fuel cells, Electrochimica ActaElectrochim. Acta 227 (2017) 110– 126 févr, doi:10.1016/j.electacta.2016.12.148.
[24]] ZView® For Windows, Scribner Associates. [En ligne]. Disponible sur: ZView® For Windows, Scribner Associates. [En ligne]. Disponible sur: http://www.scribner.com/software/68-general-ele ctrochemistr376-zview-for-windows/. [Consult le: 11-oct-2019]./. [Consulté le: 11 October 2019].
« Z V ie w® For Windows », Scribner Associates. [En ligne]. Disponible sur: http://www.scribner.com/software/68-general-electrochemistr376-zview-for-windows/. [Consulté le: 11-oct-2019].
[25] Marrero-López D., et al., Redox behaviour, chemical compatibility and electrochemical performance of Sr2MgMoO6−δ as SOFC anode, Solid State IonicsSolid State Ion.Solid State Ion. 180 (40) (2010) 1672–1682 janv, doi:10.1016/j.ssi.2009.11.005.
[26] Pagnier T., Charrier-Cougoulic I., Ritter C., Lucazeau G., A neutron diffraction study of BaCe x Zr1−x O3, The European Physical Journal - Applied PhysicsEur. Phys. J. – Appl. Phys.Eur. Phys. J. – Appl. Phys. 9 (1) (2000) 1–9 janv, doi:10.1051/epjap:2000192.
[27] Heras-Juaristi G., Pérez-Coll D., Mather G.C., Temperature dependence of partial conductivities of the BaZr 0.7 Ce 0.2 Y 0.1 O 3-δ proton conductor, Journal of Power SourcesJ. Power Sources
Queries and Answers
Query: Your article is registered as a regular item and is being processed for inclusion in a regular issue of the journal. If this is NOT correct and your article belongs to a Special Issue/Collection please contact s.turner.1@elsevier.com immediately prior to returning your corrections.
Answer: This is correct
Query: The author names have been tagged as given names and surnames (surnames are highlighted in teal color). Please confirm if they have been identified correctly.
Answer: Le Gal La Salle: is the full surname
Query: Fig. 9 will appear in black and white in print and in color on the web. Based on this, the respective figure caption has been updated. Please check, and correct if necessary.
Answer: We think that this remark concerns Fig 5 and not Fig 9. If it is the case, we agree with the modification of the figure caption, but have applied it to Fig. 5
Query: Kindly check the presentation of “Declaration of Competing Interest” and correct if necessary. Answer: No competing interests exist.
Query: Correctly acknowledging the primary funders and grant IDs of your research is important to ensure compliance with funder policies. We could not find any acknowledgement of funding sources in your text. Is this correct?
Answer: Yes
364 (October) (2017) 52–60, doi:10.1016/j.jpowsour.2017.08.011.
Highlights
• The cold sintering process (CSP) decreases the densification temperature of electrolyte BCZY. • CSP enhances the densification and the conductivity of BCZY.
Query: Please check the country name added in affiliation, and correct if necessary. Answer: This is correct