Titre:
Title: Who owns the intellectual property and where? The case of Canadian biotechnology
Auteurs:
Authors: Andrea Schiffauerova et Catherine Beaudry
Date: 2012 Référence:
Citation:
Schiffauerova, Andrea et Beaudry, Catherine (2012). Who owns the intellectual property and where? The case of Canadian biotechnology. International Journal
of Biotechnology, 12(3), p. 147. doi:10.1504/IJBT.2012.050223 Document en libre accès dans PolyPublie
Open Access document in PolyPublie
URL de PolyPublie:
PolyPublie URL: http://publications.polymtl.ca/2305/
Version: Version finale avant publication / Accepted versionRévisé par les pairs / Refereed Conditions d’utilisation:
Terms of Use: CC BY-NC-ND
Document publié chez l’éditeur commercial
Document issued by the commercial publisher
Titre de la revue:
Journal Title: International Journal of Biotechnology Maison d’édition:
Publisher: Inderscience URL officiel:
Official URL: http://dx.doi.org/10.1504/IJBT.2012.050223 Mention légale:
Legal notice:
In all cases, acknowledgement in the form of a full citation must be given to the journal as the original source of publication, together with a link to the journal webpage and/or DOI as soon as they are available.
Ce fichier a été téléchargé à partir de PolyPublie, le dépôt institutionnel de Polytechnique Montréal
This file has been downloaded from PolyPublie, the institutional repository of Polytechnique Montréal
Who Owns the Intellectual Property and Where? The
Case of Canadian Biotechnology
Andrea Schiffauerova and Catherine Beaudry
Département de mathématiques et de génie industriel, École Polytechnique de Montréal, C.P. 6079, succursale Centre-ville, Montréal (Québec) Canada, H3C 3A7
andrea.schiffauerova@polymtl.ca catherine.beaudry@polymtl.ca
Abstract
In this paper we examine biotechnology innovation in Canada. We make a profile description of Canadian biotechnology in the 12 most important agglomerations in terms of patenting quality and quantity, the nature of biotechnology activities, the properties of the assignees and their propensity to collaborate. The analysis of patent-owning organizations reveals a crucial role of the publicly funded research in Canadian biotechnology. We identify and compare the importance of well developed intellectual property policies and functioning technology transfer offices at universities. We find evidence of only very little cooperation that would result in the co-assignment of the intellectual property among organizations.
1. Introduction
Canada has a small population dispersed over a large geographical area and its private sector is dominated by small and medium sized companies. As a consequence, research and development has to concentrate in geographical agglomerations and clusters1 in order to contribute to an efficient innovation system2. The context of this study is the biotechnology sector, which should presumably benefit from the types of knowledge spillovers3 and information exchanges that are facilitated by spatial clustering. Niosi and Bas (2001) find that biotechnology activity in Canada is indeed clustered and is mainly concentrated in three large cities – Toronto, Montreal and Vancouver, where most patents and venture capital are located. Niosi and Bas note that clusters have also developed around medium-sized urban agglomerations, such as Ottawa, Edmonton, and Calgary, or specialized clusters around some smaller cities. They also argue that it is the population of the metropolitan area and the local university research, which are the key factors explaining the size, location and characteristics of these clusters. They identify universities, government laboratories and a few large firms as the main anchor tenants in Canadian biotechnology clusters. Aharonson et al. (2004) argue that, in Canada, clustered biotechnology companies are eight times more innovative than the ones that are remotely located. The largest effects were observed for firms located in clusters strong in their own specialization. Niosi and Banik (2001) also find that biotechnology companies in the clusters of Montreal, Toronto and Vancouver perform better than companies outside these clusters.
1 A cluster is defined by Porter (1998) as a geographic concentration of interconnected companies,
specialised suppliers, service providers, firms in related industries, and associated institutions (for example, universities, standards agencies, and trade associations) in particular fields that compete but also co-operate.
2 The reason behind the agglomeration of innovative activities is the fact that geographical proximity
facilitates knowledge sharing, since knowledge does not spill over large distances (Audretsch and Feldman, 1996; Jaffe and Trajtenberg, 1996).
3 Localized knowledge spillovers are defined as knowledge externalities bounded in space that allow
companies operating nearby key knowledge sources to introduce innovations at a faster rate than rival firms located elsewhere (Breschi and Lissoni, 2001)
Another line of research aims at shedding light on the determinants of differential growth in biotechnology companies in Canada. It is often argued that alliances and cooperation are an indispensable element in the success of small firms. Niosi (2003) suggests that international alliances with large pharmaceutical corporations are the main determinant of growth in Canadian biotechnology and that timely alliances are also the critical key factor for the survival of the new biotech firms. Oliver (1994) empirically confirms that this inability of a new biotechnology company to form inter-firm alliances is associated with organizational death. Niosi (2003) however argues that the success at forging suitable alliances alone does not sufficiently explain differential growth in biotechnology companies. He adds that the quantity of patents, the amount of venture capital, the size of exports and the specialization in human health products play an extremely important role as well. Queenton and Niosi (2003) propose two other determinants of rapid growth: the quality of patents and the presence of star scientists in biotechnology firms. According to them, Canadian biotechnology clusters are strongly related to high-class academic research and star scientists working in universities. Their study also highlights the importance of geographical proximity of star scientists for obtaining venture capital, and for starting and growing biotechnology firms. It was also confirmed that in Canada many of the star scientists capitalise on their knowledge through firm start-ups. One third of Canadian biotechnology firms are estimated to be university spin-offs (Niosi, 2003).
In summary, growth and continued health of Canadian biotechnology clusters are dependent upon the presence of major attractors such as research universities and governmental laboratories active in biotechnology, innovative propensity of the local scientists (i.e., the existence of star scientists), formation of alliances and active cooperation among biotechnology firms, composition of biotechnology fields in the cluster (i.e., the focus on the health-related products) and presence of the largely innovative biotechnology firms (with patents of a high quality and quantity). This paper intends to address most of the above factors. It aims at understanding the creation of biotechnology innovation in Canada and its main objective is to identify, analyze and describe potential Canadian biotechnology clusters based on the characterization of the quality and quantity of their innovative outputs, the nature of biotechnology activities
which are carried out in these locations, the characteristics of the patent-owning entities and their propensity to collaborate. Our major contribution lies in embracing a cluster approach, i.e., all analyses are made at the cluster level (all properties and characteristics are calculated per cluster). Most of the studies providing a descriptive profile of innovation in Canadian biotechnology are carried out and presented at either the province or firm level, with some notable exceptions, such as Aharonson et al. (2008) whose micro clusters are at the forward sorting area (FSA) level. In their paper on the factors influencing the relative productivity of different locations they show that agglomeration effects take place mainly at the level of local neighbourhoods. However, the goal of our study is not to examine the innovativeness of locations at such low level of aggregation, but to give a broader picture of patent ownership in Canadian biotechnology. We are seeking to identify and characterize potential biotechnology clusters in the Porter sense, and to complete the full picture of Canadian biotechnology innovation by including all of the biotechnology agglomerations in Canada. Previous cluster-based papers have focused mainly on two or three major Canadian biotechnology clusters, but little is known about the smaller concentrations, which are less active in biotechnology. Finally, we base our study on the complete database of all the Canadian biotechnology patents registered with the United States Patents and Trademarks Office (USPTO), which no other study to our knowledge has done so far. Previous researchers usually adopted the approach of analyzing only representative samples.
The paper is organised as follows: section 2 introduces the methodology and the data used in this study, section 3 presents the results regarding the biotechnology patents and their assignees, the composition of the biotech activities, the inventors and their collaborative behaviour and section 4 concludes.
2. Methodology
Patents have long been used as innovation measures and as indicators of developments in many industrial sectors. As a result of the high propensity to patent in biotechnology, patents are considered to be good indicators of the innovative productivity of biotech companies. The patent database used for the empirical analysis is the USPTO database. This is the only patent database which provides the geographical location of the
residence of each inventor. The use of the USPTO database instead of the CIPO may cause a certain bias in the data, which we consider minimal, since Canadian inventors usually patent both in Canada and in the US. The much larger and easily accessible American biotechnology market offers them a greater potential than the biotechnology market in Canada.
Biotechnology encompasses several different research technologies and several fields of application. We have opted to base our USPTO search strategy on the OECD definition of biotechnology, which is based on the group of carefully selected International Patent Codes (IPC)4. An automated extraction program was used to collect the required information5 from biotechnology patents. All biotechnology patents granted before March 31, 2007 are included. According to the above definition, there are around 100 000 biotechnology patents registered at the USPTO. We created a patent database, which contains all the patents for which at least one inventor resides in Canada and which comprises 3550 patents.
3. Results
3.1 Canadian biotechnology clusters
Our clusters are defined as a geographically continuous region active in biotechnology (as measured by patent production). We do not measure all the interactions between organizations and entities that compose a cluster, and as such, our clusters are cities or greater metropolitan areas that are potential cluster candidates in the Porter sense. For instance, our clusters for the largest Canadian cities are the Greater Montreal, Toronto and Vancouver areas. Regarding the smaller clusters, these are defined as agglomerations with some innovative activity in biotechnology (min 15 patents). A
4 The OECD definition of biotechnology patents covers the following IPC classes: A01H1/00, A01H4/00,
A61K38/00, A61K39/00, A61K48/00, C02F3/34, C07G(11/00, 13/00, 15/00), C07K(4/00, 14/00, 16/00, 17/00, 19/00), C12M, C12N, C12P, C12Q, C12S, G01N27/327, G01N33/(53*, 54*, 55*, 57*, 68, 74, 76, 78, 88, 92).
5 Extracted information includes: patent number, the names and addresses of the assignees (patent owners)
and inventors, the years of patent application and patent granting, the number of claims each patent makes, the abstract, all the patent codes and the keywords.
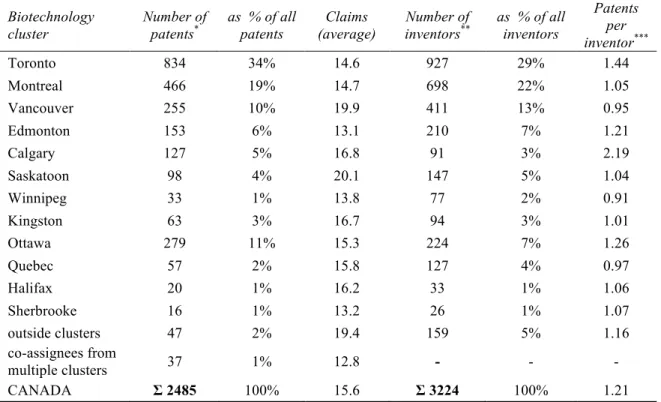
summary of the basic statistics regarding the 12 identified clusters defined in such a way are presented in Table 1.
(Insert Table 1 here)
The Greater Toronto area cluster decisively leads in the number of Canadian biotechnology patents; it has almost twice the number of patents of Montreal, which in turn has almost twice as many patents as Vancouver. Even Ottawa has more patents than an important biotechnology cluster such as Vancouver. Most of the biotechnology activity carried out in Canada takes place inside these clusters, usually the few main ones. Only 2% of the patents have no assignee6 inside these clusters. These patents are found
most often in Ontario (19 patents) or Alberta (13 patents). There are very few patents (1%) with co-assignees from multiple Canadian clusters. The lack of common inter-cluster ownership of patents suggests that there is very little cooperation at the assignee level between clusters and if there is, ownership of patents is not shared.
A vast literature exists on how to measure the value of patents. Patent ‘quality’ measured by citations (Trajtenberg, 1990), patent family size (Lanjouw et al., 1998), patent renewal decisions (Wang et al., 2010), number of claims7 (Lanjouw and Schankerman, 2004) or various combinations of these (Bonaccorsi and Thoma, 2007) have been used as a proxy for patent value. Tong and Frame (1994), for instance have demonstrated that the number of claims is significantly and consistently indicative of higher value patents. In their review of the literature, van Zeebroeck and van Pottelsberghe de la Potterie (2006) show that the conclusions of most papers on patent value find a positive association between patent value and the number of claims. Lanjouw and Schankerman (2004) have suggested that specifically in the biotechnology field the
6 A patent assignee is an entity (original or legal company, organization or person) that is registered as
proprietor of the patent or patent application.
7 Patent claims are a series of numbered expressions describing the invention in technical terms and
defining the extent of the protection conferred by a patent (the legal scope of the patent). A high number of patent claims is an indication that an innovation is broader and has a greater potential profitability. One limitation of this study is that we do not have access to patent citations which would allow us to compare various patent quality measures.
number of claims is the most important indicator of patent quality. Assuming that a greater number of claims corresponds to the higher value/quality of a patent, Table 1 shows that the quality of the patents whose assignee is from the Vancouver or Saskatoon clusters is much higher than the quality of other patents. In addition, the patents whose owners reside outside the Canadian clusters are observed to have a much higher quality on average.
3.2 Patent ownership structure in Canadian biotechnology clusters
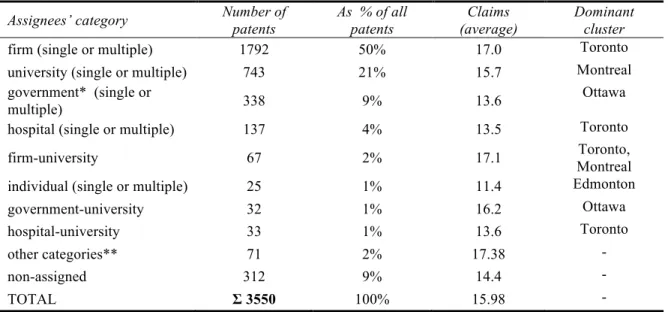
In order to understand the institutional composition of the biotechnology clusters we have examined the ownership of the patents. The patents were divided according to the nature of the entity to which they were assigned. Table 2 shows the distribution of the patents based on the category of the patent owner.
(Insert Table 2 here)
Around half of the patents are assigned solely to companies, much less to universities or governmental institutions. Biotechnology is a scientific field with potentially high financial revenues, which probably explains the high entrepreneurial interest and consequently the high representation of the private sphere among the biotechnology assignees. Commercial interests push the private biotechnology companies to strictly protect their most important assets, intellectual property, by employing appropriate mechanisms (such as patents), whereas the registration of the university or governmental inventions at the patenting offices may not seem so crucial to the individual inventors, who may not particularly care about the financial well-being of the institution. Moreover, the main objective of a university or a research lab is not to make money (in comparison with the private company) and the process of intellectual property protection and invention commercialization thus may not be given as high an importance.
Canada has the second highest share of industry-financed research in the academic sector among the G7 countries (Germany has the highest score). Industry financed over 8% of Canadian university R&D activities in 2005 (OECD, 2007). This is suggestive of strong linkages between industry and universities, the results of which we however fail to observe in our data. In an ideal world, frequent cooperation between firms and
universities should be revealed by a higher number of co-assignments of biotechnology patents if both universities and industries had equal bargaining power over IP ownership negotiations. Only 67 patents were co-assigned to a firm and a university simultaneously, which represents only 2% of all patents. We suppose that the particular contractual arrangements regarding intellectual property rights between universities and firms are the reason why the patents resulting from joint research projects are assigned uniquely to the firm or to the university. It is interesting to note that most of the patents jointly owned by firms and universities have international co-assignee or co-assignees, residing usually in the US.
Furthermore, patents whose assignees or co-assignees are firms have higher value (as measured by the average number of claims for patents in each category) than most of the ones whose owners are not companies. The patents of the lowest value are generally owned by individuals, usually the inventors themselves.
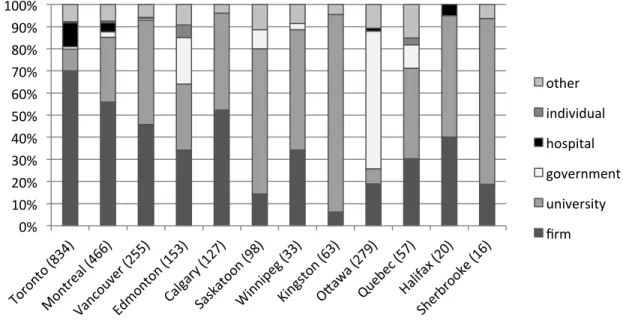
Figure 1 shows the proportions of patents assigned to different entities in the most common categories. The Toronto cluster possesses the largest (75%) proportion of patents assigned to firms. The portion of the Montreal company-owned patents is considerably lower (58%). Industrial biotechnology research is highly concentrated in the big clusters such as Toronto or Montreal, while university research is spread over the small Canadian clusters. The enormous share of the patents in Ottawa assigned to government entities strikes at first sight. Ottawa, as the capital of Canada, hosts many federal government research institutions producing biotechnology patents. A certain number of patents which do not involve any local inventive element and are generated outside the Ottawa cluster, are still assigned to, or being represented by, the federal institutions in Ottawa, for example the National Research Council, various ministries or Her Majesty the Queen (owner of 92 patents, which would make Her Majesty the greatest individual biotechnology patent owner in Canada!). The National Research Council of Canada has five national biotechnology institutes throughout the country (Montreal, Vancouver, Ottawa, Saskatoon and Halifax), but 99% of the patents owned by the National Research Council are assigned to its central office in Ottawa. Consequently, the patents co-assigned jointly to government and universities suggest non-local cooperation
(none of the university co-assignees is located in Ottawa), even though this might not necessarily be true. In the case of the governmentally assigned or co-assigned patents we were not able to distinguish where the innovative activity in fact took place.
(Insert Figure 1 here)
The picture is also blurred by the fact that in some clusters the patents produced by university hospitals or hospital research centres affiliated to universities may have been assigned to the hospitals themselves, while in other clusters they are assigned directly to universities. This probably explains the very high percentage of university patents found in clusters in which at the same time there is not a single hospital-assigned patent (as in Vancouver, Calgary, Saskatoon, Kingston, Winnipeg and Sherbrooke), while in Toronto, there are more patents actually assigned to hospitals than to universities. For instance, in Toronto, the Hospital for Sick Children and the Mount Sinai Hospital are both affiliated hospitals of the University of Toronto. Hospital researchers hold faculty appointments with the university, but patent mostly within the hospitals. Even if we take this fact into consideration, the shares of patents assigned to universities in these five clusters are still substantial, whereas the portions of the university-owned patents in the Toronto and Ottawa clusters are alarmingly low. The differences in university patenting among the clusters are possibly related to the distinct intellectual property (IP) rules and policies which, in Canada, are governed by the universities themselves. In 2003, 78% of Canadian universities actively participated in managing intellectual property, but formal requirements to disclose inventions existed only in 45% of universities (Read, 2005). We investigated the rules regarding the ownership of the IP rights at the universities with the highest numbers of biotechnology patents (see Table 3). In the case where the IP rights are owned by an inventor or jointly by both an inventor and a university at the time of invention creation, the inventor usually has the option to either commercialize the invention himself or assign the IP rights to the university, where a technology transfer office will take care of the commercialization process. In many cases the inventions are owned by default by the university who decides whether to commercialize the invention or not. Table 3 presents the distribution of the net revenue based on whether the ownership of the invention is retained by the inventor or by the university. This shows
that inventors at various universities have quite diverse opportunities and motivations for the commercialization of their inventions. An academic inventor who retains the IP rights may consider the patenting of his invention as an expensive, lengthy, risky, drudging and usually not particularly profitable process. Furthermore, as publication and not patenting is more rewarding in one’s academic carrier, a prolonged patent application process can delay the inventor’s ability to publish.8
(Insert Table 3 here)
In order to better understand the impact of the IP rights policy on the biotechnology patenting at the 13 most prolific Canadian universities, their co-assignees were examined in Table 4. The table shows that the co-assignees of the selected universities are usually not coming from academia and they are commonly not Canadians.9 However, the University of Saskatchewan and Queen’s University follow a distinct pattern, since they greatly prefer Canadian co-assignees over international ones. Even though these two universities belong among the smallest ones on the list (University of Saskatchewan has 19 000 students and Queen’s University has 20 000 students), they still largely outperform their much bigger counterparts in biotechnology patenting and are in fact producers of the great majority of the biotechnology patents in their clusters (see Saskatoon and Kingston in Figure 1). The IP rules favouring university ownership could be the reason behind their superior patenting in biotechnology (see especially the IP rules at University of Saskatchewan in Table 3). Note that at the same time, the levels of patent co-assignment (percentage of the university’s owned patents which are co-assigned) at both universities are relatively low. In contrast, some of the universities where the researchers face clear disincentives to assign the IP rights of their inventions to the university (University of Alberta and until recently the University of Toronto) are also among the universities with highest levels of co-assignment. It seems that the fact that the
8 In Canada, the USA and Mexico an inventor has one year after publishing his invention to file a patent
application. Nevertheless, in most of the other countries, the novelty of the invention is destroyed by publishing an enabling description of the invention before filing for a patent protection.
9 In fact, in the entire database there are only 11 patents owned jointly by two Canadian universities (this
patent is co-assigned with a firm or another entity counteracts these unfavourable incentives. The link between university IP rights policy and patenting propensity is therefore unclear. The motivation of inventors lies elsewhere.
(Insert Table 4 here)
Table 5 shows the main statistics concerning the assignees of the biotechnology patents whose inventors include at least one Canadian inventor. The first column includes all categories of assignees, while the second one only counts the assignees recognized as private firms. We are aware that our method underestimates the number of biotechnology firms, because only those which have at least one biotechnology patent registered at the USPTO are considered. Firms may have been left uncounted for various reasons: First, this method excludes all the biotech companies that patent solely at different patent offices (e.g. CIPO, EPO). The number of such companies is unknown to us, however, since Canadian inventors usually do not patent solely in Canada (as explained earlier) we assume that the number of patents registered exclusively at the CIPO are not substantial. Some of the inventors (particularly those who collaborate with European researchers) may nevertheless have chosen to file their patent application both at the CIPO and the EPO. Second, it obviously also excludes the firms which do not patent any inventions at all. Due to the highly codified nature of biotechnology knowledge, we can presume that biotechnology companies would rarely choose not to patent at all as this is one of the most appropriate IP protection mechanism for this kind of knowledge. The main focus of our research is on innovation and thus the exclusion of a company which does not pursue any patentable innovative activity does not change the picture significantly. Third, an innovative biotechnology firm will not be included if it prefers (probably for strategic reasons) an alternative means of intellectual property protection such as technology transfer agreements or licensing.
(Insert Table 5 here)
It is interesting to note that in Table 5 the lowest number of assignees (3 assignees) is found in the Kingston cluster, which by no means counts among the smallest biotech clusters with 63 patents and 94 inventors. An overwhelming majority of the Kingston’s
patents are produced at Queen’s University, whose Faculty of Health Sciences is very active in biotechnology research. There are in fact only two innovative (in the sense of biotechnology patenting) companies in the Kingston cluster. A similar situation exists in Saskatoon, with the University of Saskatchewan producing or co-producing almost 80% of all the patents. The University of Saskatchewan’s Vaccine and Infectious Disease Organization, which develops DNA-enhanced immunization vaccines for both humans and animals, is a full or partial owner of all the University of Saskatchewan’ biotechnology patents in our database. Saskatoon also hosts the NRC Plant Biotechnology institute which may however generate a large portion of its patents assigned to the Ottawa NRC head quarters. The “patent per assignee” ratios in the next column are thus considerably higher for these two clusters and the “patents per firm” ratios are understandably much lower. Toronto and Montreal show quite comparable numbers of patents whether measured per assignee or per firm. However, the number of patents produced on average by firms in the Vancouver cluster is considerably lower than that of the other two major cities. As for the number of inventors per institution, it is especially high in Montreal. Calgary and Ottawa are clusters with relatively high numbers of patents, which even exceed the number of inventors. Their ratios of patents per assignee or patent per firm are consequently also fairly high. This probably means that the institutions in these clusters involve a large number of biotechnology researchers (e.g. in Ottawa, NRC and Her Majesty the Queen are ranked fourth and fifth as assignees with the greatest number of patents), but also that the biotech companies are probably larger (as the high ratio of “inventors per assignee” suggests). Otherwise, it could be generally stated that smaller clusters have a lower number of patents per institution or per firm, implying either that companies in these clusters are on average smaller as well or that they are simply patenting less.
Canadian assignees which are the full or partial owners of more than 20 biotechnology patents at the USPTO are listed in Table 6. In addition to the information on the number of patents, the number of papers in biotechnology is also shown (provided by the National Research Council Canada, 2005) for the institutions most active in biotechnology. We have already mentioned that the National Research Council of Canada
assignee is more often than not the main office in Ottawa and as such does not allow a regional distinction.
(Insert Table 6 here)
Table 6 confirms that biotechnology innovation is strongly based on publicly-funded research. Out of the first thirty assignees with the highest number of biotechnology patents there are 13 universities, 5 government institutions and 2 hospitals. While part of university funding obviously comes from private contracts, the bulk of the money stems from public funds. The most important producers of patents are universities with McGill University (123 patents) heading the league table. Universities are also unsurprisingly the most active institutions in terms of scientific paper production. Here the apparent leader is the University of Toronto (533 papers), which however owns a rather low number of patents (28 patents) in comparison. This shows again that in spite of the high quality research which is conducted at University of Toronto, not many inventions have probably reached the hands of the university technology transfer offices, but those of the affiliated hospitals. During the last 20 years, the intellectual property policies at the University of Toronto did not encourage its inventors to assign their patents to the University. Moreover, in many cases, even though the inventors owned all the IP rights, the University of Toronto was still engaged in commercialization of their inventions. However, the university has recently made many changes into its IP policy, and it remains to be seen in the coming years how these changes will be reflected in the number of university-assigned patents.10 Other universities with a disproportionately higher publication record (in comparison with the number of patents) are Université de Montreal and Université Laval, which both have over 200 papers but only 32 patents.
The contribution of government institutions to the biotechnology research and development is also substantial: among the five highest ranking patent holders are the National Research Council of Canada11 (95 patents), the Government of Canada’s
10 Information gathered during the conversation with the technology transfer office at University of Toronto 11 Inventors’ addresses will indicate where the research has actually taken pace.
premier agency for research and development and Her Majesty the Queen in right of Canada (92 patents) usually representing various federal ministries (agriculture, health, national defence). The Alberta Research Council, a research agency owned by the province of Alberta, holds 34 patents and the agency which was engaged (before it was disbanded in the late 1980’s) in commercializing the research performed at government labs, the Canadian Patents and Development, possesses 26 patents. The most active government institutions in biotechnology research are the National Research Council (160 papers) and Agriculture and Agri-Food Canada (191 papers), which is however the owner of only 8 patents.
The Hospital for Sick Children (71 patents and 109 papers) and the Mount Sinai Hospital (31 patents and 108 papers), which are both affiliated to the University of Toronto, lead the patent league among hospitals. These could explain how patents “escape” from the ownership of the University of Toronto. According to the university’s IP policies, the patents are usually assigned to the institution where the research takes place physically. The university professor who is at the same time a doctor or a researcher at one of the university-affiliated hospitals will probably carry out most of his research at the hospital, which will thereby become the patent owner12.
Finally, a number of private companies are also the owners of a considerable number of biotechnology patents. The most inventive firms reside mainly in Toronto (e.g. Connaught Laboratories, Aventis Pasteurs, Allelix Biopharmaceuticals), but also in Montreal (e.g. Merck Frosst Canada, Boehringer Ingelheim Canada) or in Ottawa (Adherex). Only the patents registered under the Canadian residence of an assignee are counted (this excludes subsidiaries with the same name but with an address outside Canada). As expected, the number of papers published by private companies is relatively small, since they prefer to protect their assets by patenting rather than revealing them into public domain through scientific papers.
12 Information gathered during the conversation with the technology transfer office at University of
3.3 Biotechnology field specialization in clusters
As a next step, we investigated the various biotechnology fields and their representation in the database. We grouped various biotechnology fields according to the final use of the products into four categories: health-related biotechnology, agriculture and food related biotechnology, environmental and industrial biotech, and other biotechnology13. We found that health-related biotechnology clearly represents the greatest proportion (78%) of all patents in the database, while agriculture and food related biotechnology accounts for 10% and environmental and industrial biotech only for 5% of all the patents.
The proportions of the patents of each biotech specialization as granted to assignees in the various categories are shown in Figure 2 which shows that the major share of patents for all kinds of assignees pertains to health-related biotechnology. Not surprisingly, hospitals and other health institutions have a complete focus (100%) on health-related biotechnology. The highest proportion (93%) of the health-related biotech research is carried out (after hospitals) by the combined firm-university efforts, whereas the health biotech patents produced by firms separately or universities separately amount only to around 80% of their total biotechnology patent productions. The smallest share of health-related biotechnology patents (64%) is granted to the governmental institutions.
13 Our definitions of biotech fields are as follows:
Health-related: human or animal health - pharmaceuticals, diagnostics, therapeutics), bioinformatics (gene sequencing, peptide or protein sequence, genomics, gene expressions etc.), nanobiotechnology, devices and apparatus specific for the use in health-related biotech;
Agriculture and food related: plant based agriculture (including fertilizers, manure, composting, herbicides and insecticides, etc.), food and edible materials for humans, feeding compositions for animals, nutrition (but not with specific therapeutic uses or vitamins, etc., which belong to the health-related biotech);
Environmental and industrial: environmental (biofuels, bioremediation, biodegradation, reutilization or destruction of garbage and waste, bioleaching etc.), industrial biotech (processing of metals, production of chemicals, other manufacturing processes, etc.), bioprocess technology (biocatalysis, bioseparation, biofilter, bioreactor, etc.);
Other - multiple uses in more than one of the above categories, non-specific biotech lab equipment (devices, apparatus, etc.) or completely other uses (for ex. fingertips in police investigation)
These, however, account for a proportionally highest part (20%) of the agriculture and food related biotech patents. Universities are relatively less (8%) interested in doing environmental or industrial biotech research.
(Insert Figure 2 here)
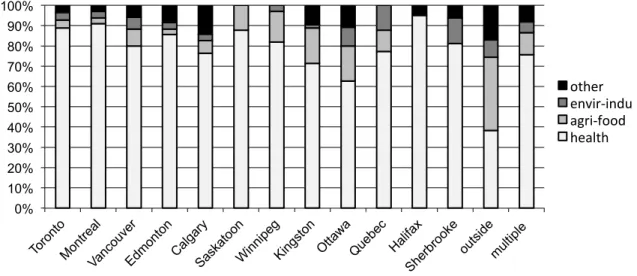
Figure 3 shows the composition of the biotechnology fields in each cluster. Inside clusters, there seems to be an apparent focus on health-related biotechnology, whereas the patents produced outside the clusters are as often health as agriculture and food related. The highest focus on health-related biotechnology was found in the two most successful clusters, which largely disregard the agriculture and food related or environmental and industrial biotechnology. In general, the very low shares of patents in agricultural and environmental biotech fields are rather surprising, as we expected to find evidence of some more specialized clusters (especially agriculture-related biotech in the Prairies – e.g. Saskatoon). Niosi (2003) however suggests that biotechnology firms in these fields stagnate or are in decline. We observe that the clusters with previously considerable shares of R&D in these fields have reoriented themselves towards the more profitable sphere of business in health-related products.
(Insert Figure 3 here)
3.4 Collaboration in Canadian biotechnology based on patent co-assignment
Finally we examined the collaboration propensity in Canadian biotechnology. In order to trace the collaborative relationships among various entities we explored the joint ownership of patents, assuming that if a patent lists more than one assignee the invention has been developed under the active collaboration of the entities in question. Joint patent ownership is therefore considered to be a sign of the cooperation between institutions or individuals.14 The analysis of assignments and co-assignments allowed us to understand
14 Although we are aware that this represents a very small part of inter-organisation collaboration, and that
most collaboration does not lead to co-patenting, it is nevertheless a worthwhile exercise. Joint ownership of patents was used previously to explore the inter-firm collaborations. For example, in order to investigate joint cooperative activities and formation of development coalitions, Gauvin (1995) used data on
co-the international, inter-cluster and intra-cluster collaborative patterns in biotechnology innovation where partners share a ‘similar’ paternity over the innovation.
Out of 3550 patents comprised in the CI database around 9% are not assigned and most of the patents (83%) have a single assignee, which does not provide us with enough evidence of collaboration. The remaining patents (8%) are however assigned to several entities at the same time (multiple assignees). We examined these patents in more detail and specifically looked into the geographical aspect - the residences of the assignees and co-assignees. As Table 7 shows, most of the assignees in the database reside solely in Canada. Canadian entities are full or partial owners of around 70% of the USPTO biotechnology patents with at least one Canadian inventor. In 5% of patents Canadian assignees have foreign co-assignees, which is a very small proportion of patents. Most of these co-assignees (78%) reside in the USA, followed by France (4%) and Great Britain (3%). Also, 21% of patents in the database are fully assigned to a foreign entity, in most of these patents (77%) the foreign single assignee is located in the USA as well, followed by France (4%). Only very few patents are owned by the multiple assignees among which none is located in Canada.
(Insert Table 7 here)
With regards to the cooperation within Canada, it has already been shown in Table 1 that most of the biotechnology activity which takes place in Canada is concentrated inside clusters, usually the main ones. We have found only very few patents (1%) with co-assignees from multiple Canadian clusters, or from outside these clusters. In addition to the very low level of inter-cluster patent ownership, we also observed only a marginal number of patents (2%) co-assigned to multiple entities within the clusters themselves.
(Insert Figure 4 here)
European chemical industry. Taking this into consideration, the analysis of co-assigned collaboration allows us to examine the sharing of IP rights among partners, which is an indicator of the ‘equal’ importance of the contribution of the partners.
Based on all these findings we constructed the summarizing collaborative pattern of the institutions in Canadian biotechnology innovation. Figure 4 confirms that the amount of collaborative links with the US or other countries is surprisingly high in comparison with the apparently lacking joint biotechnology research in Canada. These findings however are not in agreement with the study of Gauvin (1995) who found that in Canada 78% of the joint patent ownerships (registered at CIPO) are domestic, while this figure would be only 34% for our biotechnology sample. His database however included the patents across all the industries, and biotechnology may be a sector with distinct collaborative patterns. We plan to proceed with this research in order to shed light on the issue.
4. Conclusions
Our research confirmed that Canadian biotechnology is geographically highly concentrated. The majority of inventors reside in the three largest greater metropolitan areas of Toronto, Montreal and Vancouver. These locations therefore appear to be good cluster candidates. Several other agglomerations with sizeable patent production (Ottawa, Edmonton, Saskatoon, Calgary and Quebec) were identified together with some fairly small biotechnology concentrations (Winnipeg, Kingston, Halifax and Sherbrooke). It has yet to be demonstrated however whether these smaller agglomerations qualify as clusters in the sense that Porter intended. The summary of the various characteristics of the eight most important Canadian biotechnology clusters is shown in Table 8.
(Insert Table 8 here)
The findings of this paper clearly suggest that biotechnology in Canada emanates from publicly-funded research. We observe that universities are the most active institutions in Canadian biotechnology and the greatest producers of patents that are of high quality on average. They act as anchor tenants by attracting a pool of skilled workers and spin off new biotech firms. In small clusters in development, the local university is often nearly the only biotech patent producer in the region. In the larger and more mature clusters, where many firms are also located, the university’s biotechnology activities represent a more modest share of the total biotech research. We also noted that the
production of patents is very different among Canadian universities. We believe that this is related to two factors: First, it is the existence, quality and effectiveness of the technology transfer support present within these universities, consisting of the formal legal infrastructure and sufficient funds to file patents. Second, it also depends on the university IP rules and policies which stipulate whether the IP ownership is by default assigned to the university or may be retained by the individual inventors. As a consequence, several renowned research universities that are highly active in biotechnology research own only an inferior number of patents. We did not investigate these in great details but found no evidence of the latter. The former factor would require a survey of academics regarding the efficiency of the technology transfer office of their university. The contribution of the government laboratories to the biotechnology research and development is also substantial. Around half of the Canadian biotechnology patents are owned by private companies. The patents assigned or co-assigned to firms are of higher quality than other patents on average. This was for instance found by Beaudry and Schiffauerova (2011) in the case of nanotechnology.
The paper has also examined the composition of biotechnology in Canada. Biotechnology related to human health is the most significant biotechnology sector in Canada in terms of number of firms, employment, R&D and revenues (Statistics Canada, 2005). We have confirmed that health-related biotechnology represents by far the highest proportion of all biotechnology innovation research in Canada for all the various categories of assignees. In addition, the greatest and most successful clusters in Canada have a greater focus than the smaller ones on the health-related biotechnology field and largely disregard the agriculture and food related or environmental and industrial biotechnology. While the focus on the health-related biotechnology fields is overwhelmingly inside clusters, outside the clusters, however, the patents produced in Canada belong as often to the health related as to the agriculture and food related biotech specializations. Firms that focus on other applications than health related thus do not seem to benefit from the advantages that come with being located in clusters. This may explain the reason of their decline as suggested by Niosi (2003).
Based on the patent assignment and co-assignment data we have also constructed the intra-cluster, inter-cluster and international collaborative pattern in biotechnology innovation. We found very little evidence of cooperation amongst Canadian biotechnology institutions from co-assignment, whether the collaborative ties lie within or outside clusters. Beaudry and Schiffauerova (2010) showed that 60% of biotechnology co-invention (measured at the inventor level) involves inventors from the same ‘cluster’ or city, while only 11% involves inter-cluster co-invention in Canada. The three most important greater metropolitan areas (i.e. Montreal, Toronto and Vancouver) all have intra-cluster co-invention collaboration rates greater than 60% while for other city-clusters, this proportion declines (Schiffauerova and Beaudry, 2009). The most frequent typical partner for a Canadian biotechnology institution with which to pursue joint research activities is not a Canadian institution, but an institution abroad (mainly in the US). This contrasts with the implied 29% proportion of international collaboration suggested by other studies. While co-patenting across country borders appears more important than between Canadian cities, cross-border co-assignment of patents is rather rare. Further research is therefore needed on this institutional cooperation.
Finally, it is not surprising that the inventions are often not owned by their creators. We have shown that the fruit of the inventive effort of the researchers is often claimed by universities, hospitals or companies. Moreover, although there is a great innovation capability among Canadian researchers, a lot of the intellectual property actually leaves the country. It has also an important implication for our research. Since the intellectual property policies of the various patent-owning institutions throughout the country are quite diverse, the information on the patent assignees often does not reveal the whole story behind the origin of the invention, its creation and the real innovative productivity of the location. Therefore future research should try to reach the roots of the inventive effort and focus on the real creators of innovations – the inventors themselves.
There are a number of limitations to this study. First, the intra-cluster links are not formally identified. As a consequence, what we refer to as clusters could simply be clusters in the making. Formal collaboration ties between inventors need to be further investigated to assess whether the 12 agglomerations identified truly are clusters. Second,
our data does not allow the comparison between the quality of the patents produced in each of these cities beyond that proxied by claims. Other patent quality measures need to be examined. Combining these two limitations with the micro-cluster analysis of Aharonson et al. (2008) would allow the identification of the ‘hottest’ clusters in terms of patent value.
References
Aharonson, B.S., Baum, J.A.C. and Feldman, M.P. (2004). Industrial Clustering and the Returns to Inventive Activity: Canadian Biotechnology Firms, 1991-2000, Working paper, University of Toronto
Aharonson, B.S., Baum, J.A.C. and Plunkett. A. (2008). Inventive and Uninventive Clusters: The Case of Canadian Biotechnology, Research Policy, 37, 1108-1131.
Balconi, M., Breschi, S., and Lissoni, F. (2004). Networks of inventors and the role of academia: An exploration of Italian patent data. Research Policy, 33, 127-145. Beaucage, J-S. and Beaudry, C. (2006). The Importance of Knowledge Networks within
Canadian Biotechnology Clusters. International Schumpeter Conference, Sophia-Antipolis.
Beaudry, C., Schiffauerova, A. (2011 forthcoming). Is Canadian intellectual property leaving Canada? A study of nanotechnology patenting, Journal of Technology Transfer 36(1), 15 pages (DOI : 10.1007/s10961-011-9211-1).
Beaudry, C., Schiffauerova, A. (2010). Biotechnology and Nanotechnology Innovation Networks in Canadian Clusters, in Laperche, B., Sommers, P., Uzunidis, D. (eds.), Innovation Networks and Clusters: The knowledge backbone, Peter Lang Publishing Group, chapter 7, pp 159-199.
Breschi, S. and Lissoni, F. (2001). Localized knowledge spillovers vs. innovative milieux: Knowledge “tacitness” reconsidered. Papers in Regional Science, 80, 255-273.
Gauvin, S. (1995). Networks of innovators: Evidence from Canadian patents. Group Decision and Negotiation, 4, 411-428.
Lanjouw, J.O. and Schankerman, M. (2004). Patent Quality and Research Productivity: Measuring Innovation with Multiple Indicators. The Economic Journal, 114 (April), 441–465.
Mariani, M. (2000). Networks of inventors in the chemical industry. MERIT Research Memorandum.
National Research Council Canada (2005). Scan of Canadian Strengths in Biotechnology. Available on-line:
http://www.science-metrix.com/pdf/SM_2004_013_NRC_Biotechnology_Canadian_Strengths.pdf Niosi, J. (2003). Alliances are not enough explaining rapid growth in biotechnology
firms. Research Policy, 32, 737-750.
Niosi, J. (2005). Canada’s Regional Innovation Systems. The Science-based Industries. McGill-Queen’s University Press
Niosi, J. (2006). Success Factors in Canadian Academic Spin-Offs. Journal of Technology Transfer, 31, 451–457.
Niosi, J. and Bas, T.G. (2001). The Competencies of Regions – Canada's Clusters in Biotechnology. Small Business Economics, 17(1-2), 31-42.
Niosi, J. and Banik, M. (2005). The evolution and performance of biotechnology regional systems of innovation. Cambridge Journal of Economics, 29, 343–357
OECD (2007). Main Science and Technology Indicators, Volume 2007/2
Oliver, A.L. (1994). In between markets and hierarchies – networking through the life cycle of new biotechnology firms, ISSR Working Papers in the Social Sciences Porter, M.E. (1998). Clusters and the new economics of competition. Harvard Business
Review, 77-90.
Read, C. (2005). Survey of intellectual property commercialization in the higher education sector in 2003, Statistics Canada
Schiffauerova, A., Beaudry, C. (2009). Geographical aspects of collaborative networks in Canadian biotechnology clusters, in Nolin, T. P. (ed.), Handbook of Regional
Economics, Nova Publishers, pp.193-221.
Statistics Canada (2005). Preliminary Results of the Biotechnology Use and Development Survey -2005. Available on-line:
http://www.statcan.ca/Daily/English/070130/d070130c.htm
Tong, X. and Frame, J.D. (1994). Measuring national technological performance with patent claims data. Research Policy, 23, 133-141
Trajtenberg, M. (1990) A penny for your quotes: patent citations and the value of innovations. RAND Journal of Economics, 21, 172–187.
Queenton, J and Niosi, J. (2003). Bioscientists and biotechnology: A Canadian study, 3rd European Meeting on Applied evolutionary Economics, Augsburg, Germany
van Zeebroeck, N. and van Pottelsberghe de la Potterie, B. (2006). Filing strategies and patent value. Solvay Business School, Working papers CEB
Tables and figures
Table 1: Summary of the results for biotechnology clusters
Biotechnology cluster
Number of
patents* as % of all patents (average) Claims Number of inventors** as % of all inventors
Patents per inventor*** Toronto 834 34% 14.6 927 29% 1.44 Montreal 466 19% 14.7 698 22% 1.05 Vancouver 255 10% 19.9 411 13% 0.95 Edmonton 153 6% 13.1 210 7% 1.21 Calgary 127 5% 16.8 91 3% 2.19 Saskatoon 98 4% 20.1 147 5% 1.04 Winnipeg 33 1% 13.8 77 2% 0.91 Kingston 63 3% 16.7 94 3% 1.01 Ottawa 279 11% 15.3 224 7% 1.26 Quebec 57 2% 15.8 127 4% 0.97 Halifax 20 1% 16.2 33 1% 1.06 Sherbrooke 16 1% 13.2 26 1% 1.07 outside clusters 47 2% 19.4 159 5% 1.16 co-assignees from multiple clusters 37 1% 12.8 - - - CANADA Σ 2485 100% 15.6 Σ 3224 100% 1.21
* The numbers are based on the residence of assignees and only the patents with at least one Canadian
assignee are thus included (i.e., 753 foreign-assigned patents and 312 non-assigned patents are excluded).
** Inventors with multiple addresses (who patented while living in several clusters) were assigned to only
one cluster.
*** Patents per inventor are counted as the number of patents co-invented by at least one inventor from the
Table 2: Patents by category of assignees
Assignees’ category Number of patents As % of all patents Claims (average) Dominant cluster
firm (single or multiple) 1792 50% 17.0 Toronto
university (single or multiple) 743 21% 15.7 Montreal
government* (single or
multiple) 338 9% 13.6
Ottawa
hospital (single or multiple) 137 4% 13.5 Toronto
firm-university 67 2% 17.1 Toronto,
Montreal
individual (single or multiple) 25 1% 11.4 Edmonton
government-university 32 1% 16.2 Ottawa
hospital-university 33 1% 13.6 Toronto
other categories** 71 2% 17.38 -
non-assigned 312 9% 14.4 -
TOTAL Σ 3550 100% 15.98 -
* Government assignees include all the federal or provincial laboratories and research institutions, Canadian
ministries and ministers, Her Majesty the Queen in right of Canada, etc.
**Includes the following co-assignees categories: firm-government, firm-hospital, firm-hospital-university,
firm-university, hospital, firm-individual, hospital-individual, government-individual, university, hospital-government, hospital-government-university and individual-firm-hospital-government
Table 3: IP ownership and the distribution of the net revenue at the most prolific universities patenting in biotechnology in Canada
IP rights ownership at the time of invention
IP rights ownership retained by and/or invention commercialized by
THE INVENTOR THE UNIVERSITY*
Distribution of the net revenue: Distribution of the net revenue: Inventor University Inventor University
McGill University Joint first $100 000: 80%, then 70% first $100 000: 20%, then 30% first $10 000: 100%, then 60% first $10 000: 0%, then 40%
U. of British Columbia Uni 50% 50%
U. of Saskatchewan Uni 50% 50%
Queen’s University Inv first $500 000: 100%, then 75%
first $500 000: 0%, then 25%
negotiated negotiated
University of Calgary Inv 75%-90% 25%-10% 50% 50%
University of Alberta Inv 66.6% 33.3% 33.3% 66.6%
University of Guelph Uni first $100 000:
75%, then 25%
first $100 000: 25%, then 75% Université de Montreal Inv negotiated negotiated negotiated negotiated
Université Laval Uni 50% 50%
University of Toronto Joint 75% 25% 60% 40%
University of Ottawa Uni first $100 000:
80%, then 50%
first $100 000: 20%, then 50% University of Manitoba Joint negotiated negotiated negotiated negotiated
University of Victoria Inv if <$5,000/year: 100%, else 80%
if <$5,000/year: 0%, else 20%
negotiated negotiated * Some universities have founded special non-for-profit organizations in order to commercialize the IP of
the university-generated research. These organizations may have exclusive rights to the university IP. However, we do not distinguish here whether the invention is owned and/or commercialized directly by the university or by this organization.
Table 4: Patents co-assigned with universities most prolific in biotechnology patenting in Canada
University co-assignee Non-university co-assignee All co-assigned patents All patents Canadian Non- Canadian Canadian Non- Canadian Firm Govern. Hosp.
McGill University - 8 5 - 4 9 26 123 U. of British Columbia 2 8 3 2 - 2 17 114 U. of Saskatchewan 2 - 7 - - 3 12 78 Queen’s University - - 1 2 - - 3 61 University of Calgary 1 8 2 - - - 11 59 University of Alberta 1 4 3 1 - 5 14 57 University of Guelph 2 2 - 2 - 1 7 35 Université de Montréal - 4 - 1 1 1 7 32 Université Laval - - 1 2 - 1 4 32 University of Toronto - 2 2 1 3 1 9 28 University of Ottawa - - - 3 - 5 8 26 University of Manitoba 1 3 1 1 - - 6 22 University of Victoria - - - 20
Table 5: Results regarding assignees as counted per biotechnology cluster
Biotechnology cluster
Number of assignees
Number of
firms* Patents per assignee Patents per firm** Inventors per assignee***
Toronto 144 110 5.79 5.38 6.44 Montreal 77 55 6.05 4.80 9.06 Vancouver 51 44 5.00 2.70 8.06 Edmonton 29 19 5.28 2.89 7.24 Calgary 13 11 9.77 6.18 7.00 Saskatoon 9 6 10.89 2.50 16.33 Winnipeg 9 7 3.67 1.71 8.56 Kingston 3 2 21.00 2.00 31.33 Ottawa 28 11 9.96 5.00 8.00 Quebec 18 11 3.17 1.82 7.06 Halifax 5 3 4.00 2.67 6.60 Sherbrooke 4 2 4.00 1.50 6.50 outside clusters 28 18 1.68 1.33 5.68 CANADA Σ 418 Σ 299 5.86 4.10 7.71
* Only inventive firms (i.e. those which have produced at least one biotechnology patent) are counted. ** Number of patents assigned to firms divided by the number of inventive firms in the cluster. *** Number of all inventors divided by the number of assignees in the cluster.
Table 6: Assignees with Canadian residence with 20 or more patents filed with the USPTO Assignee Number of patents Number of
papers* Cluster Province
Assignee’s category
1 McGill University 123 372 Montreal QC university
2 Connaught Laboratories Ltd 118 Toronto ON firm
3 University of British Columbia 114 308 Vancouver BC university 4 National Research Council of Canada 95 160 Ottawa ON government
5 Her Majesty the Queen of Canada 92 Ottawa ON government
6 University of Saskatchewan 78 170 Saskatoon SK university
7 Hospital for Sick Children 71 109 Toronto ON hospital
8 Aventis Pasteur Ltd 63 13 Toronto ON firm
9 Queen’s University 61 Kingston ON university
10 University of Calgary 59 189 Calgary AB university
11 University of Alberta 57 244 Edmonton AB university
12 Allelix Biopharmaceutical 52 Toronto ON firm
13 Merck Frosst Canada Inc. 42 14 Montreal QC firm
14 Visible Genetics Inc 40 Toronto ON firm
15 University of Guelph 35 223 Toronto ON university
16 Alberta Research Council 34 Edmonton AB government
17 Université de Montreal 32 209 Montreal QC university
18 Université Laval 32 205 Quebec QC university
19 Syn X Pharma 32 Toronto ON firm
20 Mount Sinai Hospital 31 108 Toronto ON hospital
21 University of Toronto 28 533 Toronto ON university
22 University of Ottawa 26 Ottawa ON university
23 Canadian Patents and Development 26 Ottawa ON government
24 Boehringer Ingelheim Canada Ltd 26 Montreal QC firm
25 Adherex 25 Ottawa ON firm
26 University of Manitoba 22 Winnipeg MB university
27 NPS Allelix Corp. 22 Toronto ON firm
28 Spectral Diagnostics Inc. 21 Toronto ON firm
29 Ontario Cancer Institute 21 Toronto ON Hospital
30 University of Victoria 20 Vancouver BC university
Table 7: Patents by country of the assignees’ residences
Assignees' residences number of
patents
as % of all patents
claims (average)
Only Canadian assignees 2310 65% 15.6
Foreign coassignees of Canadians 175 5% 16.0
Foreign single assignees 746 21% 17.7
Foreign multiple assignees 7 0.2% 16.0
No assignee 312 9% 14.4
All patents Σ 3550 100% 16.0
Table 8: Summary of information on the seven most important clusters
Toronto Montreal Vancouver Ottawa Edmonton Calgary Sask. Quebec
# of patents 834 466 255 279 153 127 98 57
# of inventors 927 698 411 224 210 91 147 127
# of innovative firms 110 55 44 11 19 11 6 11
Patent quality v. high high v.
high high Firms’ innovative
productivity low low v. high low low
Inventors’ innovative
productivity high high v. high
% of health-related biotech 89% 91% 80% 63% 86% 76% 88% 77% Patent ownership structure Firms 70% 56% 46% 19% 34% 52% 14% 30% Universities 10% 29% 47% 7% 30% 44% 67% 41% other (if share > 10%) 11% hosp. 62% gov. 21% gov. 11% gov. # of prolific* firms 7 2 1 # of highly prolific** universities 1 1 1 1 1 # of prolific* hospitals 3 # of prolific* gov. institutions 1 3 1
* Prolific means here that the number of patents of the assignee is > 20 patents. ** Highly prolific means here that the number of patents of the assignee is > 50.
Figure 1: Shares of patents assigned to the various entities in each cluster (the number in parentheses shows the total number of patents in the cluster)
Figure 2: Proportions of patents by biotechnology field as granted to assignees in each category
0% 10% 20% 30% 40% 50% 60% 70% 80% 90% 100% other individual hospital government university firm 0% 10% 20% 30% 40% 50% 60% 70% 80% 90% 100% other environment-industry agriculture-food health
Figure 3: Biotechnology field composition of patents in each cluster
Figure 4: Collaboration pattern of Canadian biotechnology institutions as evidenced by the patent co-assignment 0% 10% 20% 30% 40% 50% 60% 70% 80% 90% 100% other envir-indu agri-food health Not assigned 9% No sign of collaboration by co-assignment 83% Collaborations with Canadian entities inside clusters 2% Collaborations with Canadian entities outside clusters 1% Collaborations with foreign entities 5%