HAL Id: hal-02473040
https://hal.archives-ouvertes.fr/hal-02473040
Submitted on 26 Nov 2020HAL is a multi-disciplinary open access
archive for the deposit and dissemination of sci-entific research documents, whether they are pub-lished or not. The documents may come from teaching and research institutions in France or abroad, or from public or private research centers.
L’archive ouverte pluridisciplinaire HAL, est destinée au dépôt et à la diffusion de documents scientifiques de niveau recherche, publiés ou non, émanant des établissements d’enseignement et de recherche français ou étrangers, des laboratoires publics ou privés.
Eliane Younes, Volfango Bertola, Cathy Castelain, Teodor Burghelea
To cite this version:
Eliane Younes, Volfango Bertola, Cathy Castelain, Teodor Burghelea. Microscopic flows of a simple yield stress material in the presence of wall slip. Congrès Français de Mécanique CFM2019, Jun 2019, Brest, France. �hal-02473040�
Microscopic flows of a simple yield stress material in
the presence of wall slip
E. Younes
a, V. Bertola
b, C. Castelain
c, T. Burghelea
da. Université de Nantes, CNRS, Laboratoire de Thermique et Energie de Nantes, UMR 6607, La Chantrerie, Rue Christian Pauc, B.P. 50609, 44306 Nantes Cedex 3, France.
Eliane.Younes@univ-nantes.fr
b. Laboratory of Technical Physics, School of Engineering, University of Liverpool, Liverpool, L69 3GH, United Kingdom. Volfango.Bertola@liverpool.ac.uk
c. Université de Nantes, CNRS, Laboratoire de Thermique et Energie de Nantes, UMR 6607, La Chantrerie, Rue Christian Pauc, B.P. 50609, 44306 Nantes Cedex 3, France.
Cathy.Castelain@univ-nantes.fr
d. Université de Nantes, CNRS, Laboratoire de Thermique et Energie de Nantes, UMR 6607, La Chantrerie, Rue Christian Pauc, B.P. 50609, 44306 Nantes Cedex 3, France.
Teodor.Burghelea@univ-nantes.fr
Abstract :
A fundamental problem in the hydrodynamics of yield stress fluids relates to the “wall slip” phenomenon. To tackle this, we have performed systematic measurements of flow fields of a simple yield stress fluid (Carbopol Ultrez 10) in a plane acrylic made micro-channel. By means of epifluorescent microscopy combined with a customly developed Digital Particle Image Velocimetry, times series of velocity fields were measured within a wide range of driving flow rates and three distinct flow regimes were identified: full plug, partial plug and fully yielded. Corresponding to each flow regime, the wall velocity gradients and slip velocities are obtained by interpolating the velocity profiles using a smoothing spline function. Furthermore, by combining the flow field measurements with the macro-rheological measurements of the flow curves, we identify scaling laws of the slip velocity with the wall shear stress. Finally, we present a detailed comparison of the experimentally found scaling laws of the wall slip with results from the literature.
Keywords: Carbopol gel, yield stress, rheology, microchannel, DPIV, wall
slip
1
Introduction
Yield stress fluids represent a broad class of materials that naturally exist in a solid state but, if suffi-ciently forced (e.g. subjected to a large enough stress) they behave as fluids i.e. they flow [1]. Such fluids are encountered in the daily life in a variety of forms including pasty materials commonly related to the food industry (e.g. ketchup, mustard, molten chocolate), construction industry (cements), oil in-dustry (drilling oils), cosmetics (toothpaste, hair gel, creams), pharmaceutical inin-dustry (drug delivery gel capsules, vertebral repair gels etc.).
Most of the yield stress fluids present a shear thinning behaviour beyond the yield point classically described by the Herschel-Bulkley model. It was initially proposed in Refs. [2,3] and it takes the form below:
(
σ = σy+ k| ˙γ |n if σ ≥ σy ˙
γ = 0 if σ < σy (1)
Here σ is the applied stress, σyis the yield stress, ˙γ is the shear rate, k is the consistency of the material and n is the power law index. This model assumes that the solid-fluid transition occurs at a well defined value of the applied stress (the commonly referred to yield stress).
Carbopol gel has been frequently used as a “model” yield stress fluid to study the yielding behaviour of viscoplastic materials [4]. Carbopol polymer is a cross-linked polyacrylic acid particles (COO−H+) with high molecular weight. In an anhydrous state, it is commercialized in the form of a white powder soluble in aqueous solvents. After addition of a neurtralizing agent such as sodium hydroxide (NaOH), a clear gel is obtained. A chemical reaction is created between the acid group of the Carbopol polymer and the hydroxide group that leads to the formation of the gel networks. Carbopol microgels exhibit an elasto-viscoplastic rheological behaviour. The gel networks are maintained for small applied stresses (solid regime). Once the applied stress exceed a certain threshold, the gel networks break completely and the material starts to flow [5].
For over a decade, it has been considered that the Carbopol gel follows the Herschel-Bulkley correlation [6,4]. However, it has been shown recently that the solid-fluid transition does not occur at a well defined value of the applied stress but gradually, i.e. within a finite range of stresses [5,7]. In the current study, we choose the Carbopol gel as a working yield stress fluid because of its low thixotropy, chemical stability and optical transparency.
The flow analysis of a yield stress fluid has been well studied using rheological measurements. Torsional rheometers are used to characterise a yield stress fluid provided that wall slip is eliminated. The presence of slip on the walls of the rheometer geometry complicates the determination of the yield stress [8]. However, the wall slip phenomenon is ubiquitous during flow of pasty materials and may affect the solid-fluid transition.
The study of flow kinematics in a real industrial flow has received limited attention. Ouvrier and Wind-hab in Ref. [9] developed a novel rheological measuring technique based on ultrasonic pulsed echo Doppler technique and pressure difference method in order to characterise the flow behaviour of a non-transparent and highly concentrated suspensions in a cylindrical pipe. The local shear stresses were calculated from the measured pressure drop along the pipe and the wall slip velocity were calculated by extrapolating the velocity profile at the wall.
An experimental investigation was carried out by Ma et al. in Ref. [10]. They propose a model to determine the rheological properties and wall slip behaviour of a petroleum-coke sludge slurry flowing in pipelines by using the traditional Moony method and Tikhonov regularization.
A study of the yielding process in a capillary tube of a 0.2 wt% Carbopol gel has been performed by Pérez-González et al. in Ref. [11]. By combining the Digital Particle Image Velocimetry (DPIV) and classical rheological measurements they found the solid-fluid transition occurs gradually which complicates the determination of the yield stress. To overcome the difficulty of reliably measuring the yield stress they propose an alternative method based on the analysis of the velocity profiles.
Therefore, we present in the current work a detailed experimental investigation of the flow behaviour of a 0.1 wt% Carbopol gel in an acrylic micro-channel in the presence of wall slip using DPIV technique and classical rheological measurements.
The paper is organised as follows. The rheological characterisation of the working fluid is presented in Sec. 2.1. The micro-channel setup design as well as data acquisition are presented in Sec. 2.2. The data analysis is explained in Sec.2.3. A detailed characterisation of the velocity profiles is presented in Sec.3.1. By combining the micro-fluidic and macro-rheological measurements, we identify in Sec.3.2
different scaling laws of the wall slip phenomenon corresponding to different flow regimes. A detailed comparison of the experimentally found scaling laws with results from the literature is presented in Sec.
3.3. The paper closes with a summary of the main conclusions and several perspectives, Sec. 4.
2
Experimental methods
2.1
Preparation and rheological characterisation of the working
fluid
2.1.1 Fluid preparation
The working fluid was an aqueous solution of 0.1 wt% Carbopol Ultrez 10. The solution batch has been prepared according to the following protocol. First, the right amount of anhydrous Carbopol has been dissolved in deionised water using a magnetic stirring device at a speed of 1000 r pm. The degree of mixing/dissolution has been assessed visually by monitoring the optical isotropy of the solution. Next, the pH of the solution has been gradually increased from 3.2 to 7 by gradual titration with a small amounts of a 10 wt% aqueous NaOH solution gradually pipetted while gently mixing the solution. The rheological tests were performed after seeding the carbopol solution with the fluorescent tracers as detailed in Sec. 2.2. The average density of the Carbopol solution was ρf ≈ 1100 kg.m−3.
2.1.2 Rheological measurments
The rheological measurements have been performed using a controlled stress rotational rheometer (Mars III, Thermofischer Scientific) equipped with a nano-torque module. Tests have been performed using a parallel plate geometry with a diameter D = 35 mm and a gap d = 1 mm. To prevent the wall slip, glass paper with an average roughness of 500 µm has been glued on each plate. To account for the addition of the glass paper on the rotating plate of the device, the inertia has been recalibrated. The absence of any wall slip effect was verified by measuring flow curves in subsequent tests performed with several values of the gap and showing that all measurements perfectly overlap. To prevent the evaporation of the solvent during the rheological measurements a thin layer of commercial oil has been added to the free meniscus of the sample.
Rheological measurements have been performed according to the following protocol. First, the sample has been pre-sheared at a constant applied stress larger than the yield stress for 300 s and allowed to relax for another 300 s. Then, to assess the rheological behavior of the Carbopol gel in different deformation regimes, a commonly used rheological tests consisting of loading the material according to an increasing
stress ramp was applied to a fluid sample. The duration of each step was t0= 5 s and the data averaging time per stress value was δ t0= 2 s.
To test the reproducibility and quantitatively assess the instrumental error, each rheological measurement was been repeated three times with a fresh sample.
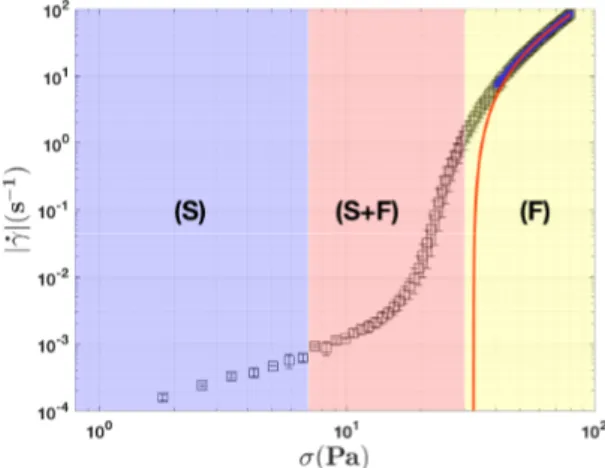
The rheological flow curve is illustrated in Fig.1. Three distinct deformation regimes are observed. For low values of applied stress, the rate of material deformation ˙γ remains constant. This corresponds to a solid-like behaviour of the material, region (S) in Fig. 1. For high values of applied stress (beyond the yield stress), the material becomes fully yielded, region (F) in Fig. 1, and can be modelled with the Herschel-Bulkley equation (Eq.1), the red line in Fig.1. For intermediate values of the applied stresses, the fluid transition is not direct and the behaviour of the material corresponds neither to a solid-like regime nor to a viscous flow regime, region (S+F) in Fig. 1. According to the Herschel-Bulkley fitting, the yield stress of the working material is around σy≈ 32.5 Pa.
Figure 1: Dependence of the shear rate ˙γ on the on the applied stress σ . The full line represents the Herschel - Bulkley fit that gives σy= 32.5 ± 2.5 Pa, K = 2.8 ± 0.215 Pa.sn, n = 0.6403 ± 0.0299. The symbols marking the highlighted regions denote the deformation regimes and are explained in the text:
(S) - solid, (S + F) - solid-fluid coexistence, (F) - fluid.
2.2
Micro-channel design, microscopic flow control and data
ac-quisition protocol
To characterise the kinematics of a yield stress fluid flow for a wide range of flow rate in the presence of wall slip, micro-fluidic experiments have been performed in a plane acrylic micro-channel. The width of the channel is W = 200 µm, its depth is H = 200 µm and its length is L = 4 cm. The micro-channel was machined in an acrylic block with the dimensions 5 cm × 3 cm × 0.5 cm.
The micro-channel chip is mounted on an inverted epifluorescent microscope (Axio Observer A1, serial no3832002215. ), Fig. 2. The microscopic flows have been visualised through a 20X magnification objective (Zeiss EC Plan-NEOFLUAR 20x/0,5) with a numerical aperture NA = 0.35 and a long working distance W D = 70 mm.
The microscopic flows were generated using a high precision micro-syringe pump (KdScientific, model Legato 110). To insure a steady flow rate Q which was crucial for this study, we have used a 10 ml gas
tight syringe (Hamilton, model 1010LT). The flows were illuminated with by a powerful halogen lamp coupled to the inverted microscope.
To visualise the flow, the working fluid was seeded with a minute amount of buoyantly neutral fluorescent tracers with a diameter of 0.92 µm (Fluoresbrite Multifluorescent from Polysciences).
For each flow rate, we have waited for 5 mins before starting the image acquisition in order to avoid the transient states and then a series of 1000 flow images was acquired with a digital camera. For the experiments where the flow rate did not exceed 10 µL/min, we have used a Prosilica GE camera with 16 bit quantisation (model GE680C from Allied Technologies). The maximal frame rate achievable with this camera is 200 f ps. During the experiments with flow rates Q ∈ [10, 23] µL/min, a Mikrotron camera has been used up to a frame rate of 500 f ps. The images were acquired at the mid-plane of the micro-channel and at the mid-length where the laminar flow is fully developed at this position as the Reynolds numbers are very small (Re ≈ 10−9− 10−3).
Figure 2: Schematic view of the microfluidic experimental setup: MCC: channel chip, I: micro-channel inlet, O: micro-micro-channel outlet, AT: adhesive tap, MO: microscope objective, DM: dichroic mir-ror, LP: light emitting lamp, EXF: excitation filter, EMF: emission filter, CCD: digital camera.
2.3
Data analysis
The main tool used to systematically characterise the microscopic flow was an adaptive multi-grid Digital Particle Image Velocimetry (DPIV) (see Refs. [12,13] for a detailed description of the method) entirely developed in house under Matlab (together with the "Image Processing Toolbox") which followed the steps briefly described below. A a background was calculated by averaging all the images of the first time series we have acquired. Second, the average background was subtracted from images. Finally, pairs of pre-processed images separated in time by the inter-frame t1are passed to a multi-pass DPIV algorithm using a sequence of squared interrogation windows with sizes [128, 64, 32, 16, 8]. As a post-processing step, each computed velocity field obtained from the DPIV algorithm was filtered using a median filter. The spatial resolution of the velocity fields was 4.5 µm (44 times smaller than the width of the channel) which suffices for a reliable calculation of the velocity gradients in the proximity of the channel walls. To extract the wall slip velocity we have interpolated each transversal profile of the axial velocity by a smoothing spline function and computed its value at the level of the wall. The velocity gradient near the was calculated by calculating the slope of the last four points of the smoothing spline.
3
Results
3.1
Description of the flow regimes in the presence of wall slip
We focus in the following on the experimental characterisation of the microscopic flow profiles of a Carbopol gel in a steady channel flow for several flow rates.
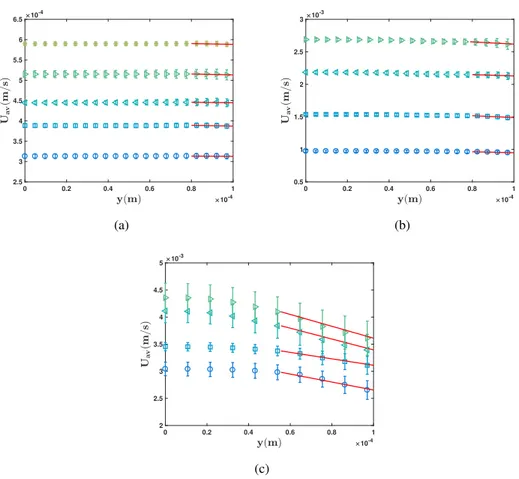
Profiles of the time averaged flow velocity Uav measured according to the method described in Sec.2.3
are presented in Fig.3. The standard deviation of the velocity profiles was smaller than 5% for different values of flow rates. Depending on the magnitude of the constant imposed flow rate Q, three distinct flow regimes are observed in Fig.3.
0 0.2 0.4 0.6 0.8 1 10-4 2.5 3 3.5 4 4.5 5 5.5 6 6.5 10 -4 (a) 0 0.2 0.4 0.6 0.8 1 10-4 0.5 1 1.5 2 2.5 3 10 -3 (b) 0 0.2 0.4 0.6 0.8 1 10-4 2 2.5 3 3.5 4 4.5 5 10 -3 (c)
Figure 3: Velocity profiles for various values of flow rate Q. Panel (a) corresponds to the solid regime for: circles- Q = 1 µl/min, squares- Q = 1.4 µl/min, left triangles- Q = 1.6 µl/min, right triangles Q = 1.8 µl/min, stars- Q = 2 µl/min. Panel (b)corresponds to the transition for: circles-Q= 3.5µl/min, squares- Q = 5.5 µl/min, left triangles- Q = 8 µl/min, right triangles Q = 10 µl/min. Panel(c) corresponds to the fluid regime for: circles- Q = 14 µl/min, squares- Q = 15 µl/min, left triangles- Q = 21 µl/min, right triangles Q = 23 µl/min.
At low driving flow rates (Q < 2 µl/min), a full plug flow regime is observed in Fig. 3(a). The entire Carbopol gel is un-yielded and "slides" over a very thin layer of depleted solvent (water) located in the proximity of the channel walls. The fully plug velocity profiles are characteristic of a solid-like behaviour visible in Fig. 1, region (S).
The Carbopol gel is partially yielded in the proximity of the channel walls (where the velocity gradients are the largest) but a central un-yielded plug may still be observed around the centre-line of the micro-channel, Fig.3(b). The shear stresses are not large enough to yield the material along the entire width. This behaviour may be related to the solid-fluid transition of the material observed in Fig. 1, region
(S+F).
As the flow rate is increased even further (Q > 10 µl/min), the Carbopol gel is fully yielded across the entire width of the channel. The further increase of flow rate translates into additional shear stresses and a shear thinning flow regime is observed in Fig. 3(c) (the local shear stresses exceed the yield stress everywhere across the channel width). The shear thinning velocity profiles are characteristic of a fluid-like regime visible in Fig.1, region (F).
Furthermore, the velocity profiles clearly exhibit a non zero slip behaviour at the channel walls (a non zero slip velocity at y = 1 × 10⁻⁴m) meaning that the gel slip.
3.2
Scaling behaviour at the wall within various flow regimes
Understanding the scaling behaviour of the relevant hydrodynamic quantities (shear stress, shear rate, slip velocity) in the proximity of the wall is of paramount importance to developing reliable microscopic models able to explain the confined flows of viscoplastic materials in the presence of wall slip and for the implementation of numerical simulations. Based on the characterisation of the flow fields presented in Sec.3.1, we study in this section the scaling behaviour for each flow regime previously identified. The dependence of the wall velocity gradients computed according to the procedure detailed in Sec.
2.3on the flow rate Q is presented in Fig. 4(a). In the solid region (S), the material is fully unyielded and, within the instrumental accuracy of our technique, no velocity gradients could be reliably measured near the solid wall. As the flow rate Q is gradually increased, one can clearly notice the existence of two different scaling regimes. For the solid-fluid transition regime (S+F), the wall velocity gradient scales with the flow rate as dUdy|w∝ Q2 (see full line in Fig. 4(a)). A further increase of the flow rate into the fluid regime (F) leads to a different scaling of the wall velocity gradient, dUdy|w∝ Q3(see dashed line in Fig.4(a)).
The measurements of the wall velocity gradients dUdy|wallow one to compute the wall shear stresses τw using the macro-rheological measurements presented in Fig.1. The result of this evaluation is presented in Fig.4(b). Two different scaling regimes of the wall shear rate with the wall shear stress can be clearly observed. The first scaling regime corresponds to a partial yielding of the gel in the vicinity of the wall,
dU dy|w∝ τ
7.99
w (see full line in Fig. 4(b)). Above a critical value of wall shear stress and corresponding to the fluid deformation regime a second scaling is observed,dUdy|w∝ τw4.8(see dashed line in Fig. 4(b)). Due to confinement, the microscopic flows can not be generally described by the Herschel-Bullkley model, see Ref. [14].
The value of the critical wall shear stress defined as the intersection between the two power laws is close to the yield stress measured in the rheometric flow and fitted by the Hurschel-Bulkley equation, see Fig.
(a) (b)
Figure 4: (a)Dependence of the wall velocity gradients on the applied flow rate Q. The full line (–) is a guide for the eye, dUdy|w∝ Q2and the dashed line (– –) is a guide for the eye,dUdy|w∝ Q3.(b)Dependence of the wall velocity gradients on the wall shear stress computed using the rheological measurements and computed wall velocity gradients. The full line (–) is a guide for the eye, dUdy|w∝ τw7.99 and the dashed line (– –) is a guide for the eye, dUdy|w∝ τw4.8. The symbols marking the highlighted regions denote the deformation regimes and are explained in the text: (S) solid, (S + F) solidfluid coexistence, (F) -fluid.
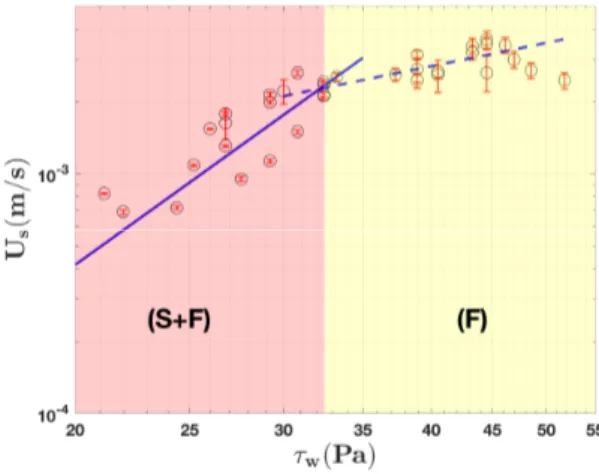
Wall slip behaviour is usually described as the evolution of the wall slip velocity Uswith the wall shear stress τw. This dependence is presented in Fig.5. Because in the solid regime the wall velocity gradients are too small to be reliably measured, we could not use the method described above to reliably compute the wall shear stresses. For higher flow rates (beyond the (S) regime) , again, two distinct scaling laws are observed. Corresponding to the solid-fluid coexistence regime (S+F), Us∝ τw3.55. Within the fully yielded regime (F), Us∝ τw.
Figure 5: Dependence of the wall slip velocity Uson the wall shear stress τw. The full (–) and dashed (– –) lines are guides for the eye, U s ∝ τw3.55, U s ∝ τwrespectively. The symbols marking the highlighted regions denote the deformation regimes and are explained in the text: (S + F) - solid-fluid coexistence,
3.3
Comparison with previous results from the literature
A study of flow kinematics was carried out by Pérez-González et al. in Ref. [11]. The apparent shear rate ˙γa and the wall shear stress τware calculated as ˙γa= 32Q
π D3, τw= ∆P
4DL respectively, where ∆P is the pressure drop between the capillary ends, L and D are respectively the length and the diameter of the borosilicate glass capillary and Q is the flow rate calculated from the integration of the velocity profiles. In their study, three distinct flow regimes are observed: solid-like, transition and fluid-like regimes. The apparent shear rate ˙γascales with the wall shear stress τwas ˙γa∝ τw2.44in the fluid regime. This scaling law differs from the one we observe, dUdy|w∝ τw4.8 (the dashed line in Fig. 4(b)). This difference may be related to the way ˙γais calculated. This formula takes into account the assumption that the velocity profile is parabolic and the slippage does not exist at the capillary walls.
To describe the wall slip behaviour Kaylon proposed in Ref. [8] the following relationship between the slip velocity and the wall shear stress based on Herschel-Bulkley equation:
Us= β (τw)1/nb (2)
Here β relates the slip layer δ to the consistency of the binder fluid mband to its power-law index nb, β = δ
m1/nbb . The Carbopol gel is considered as jammed system of swollen gel micro-particles [4]. As the carbopol gel was prepared with an aqueous solvent, the “binder fluid” might be considered as Newtonian and thus Kb= 10−3Pa.s and nb= 1.
In the fluid regime, Us scales linearly with τw, Us∝ τw (the dashed line in Fig. 5). This assumption confirms the assumption that the “binder fluid” is Newtonian, nb= 1. This is consistent with the scaling law observed in previous study, Ref. [15] while differs from the ones predicted theoratically by Piau in Ref. [4] where Us∝ τw1/3for loosely packed system and Us∝ τw2for closely packed system. The difference from ref. [4] might be related to the fact that the lubricating fluid is considered as non-Newtonian fluid. In our study, the factor β = 70 · 10−6 m.Pa−1.s−1leads to a slip layer of thickness δ ≈ 0.07 µm. This value is of the same order of magnitude as the one found by Jiang et al. in Ref. [16], δ ≈ 0.1 µm. By direct observation of a rheometric microgel flow , Meeker et al. in Ref. [17] observe that Usremains constant for 1 < σ
σy < 1.5 (σ is the applied stress) while in our experiments we can observe that the slip velocity increase linearly with the wall shear stresses, U s ∝ τw.
4
Conclusions, outlook
An experimental investigation of “wall slip” phenomenon in a Carbopol gel flow is carried out in this study. In the first part, we present in Sec.2.1.2a systematic rheological caracterization of Carbopol gel. Rheological measurements has been performed using an accurate rotational rheometer. The flow curve obtained during an increasing stress ramp reveals three distinct deformation regimes. An elastic solid regime that corresponds to low values of applied stresses (below the yield point), a solid-fluid transition corresponds for intermediate stresses (around the yield stress) and a viscous regime observed for high values of applied stresses.
To characterise the “wall slip” phenomenon, a systematic measurements of flow fields of Carbopol gel in a plane acrylic made micro-channel have been performed, Sec.2.2. Bye using a custom Digital Particle Image tool developed in the house, times series of velocity fields were measured within a wide range of driving flow rates. Depending on the magnitude of the constant imposed flow rate Q, three distinct flow
regimes are observed. At low driving flow rates, a full plug flow regime is observed. As the flow rate is gradually increased, the Carbopol gel is partially yielded in the proximity of the channel walls but a central un-yielded plug may still be observed around the centre-line of the micro-channel. As the flow rate is increased even further, the Carbopol gel is fully yielded across the entire width of the channel, see Fig.3.
The accurate measurements of the velocity profiles allow one to obtain the wall velocity gradients and slip velocities via the numerical differentiation of a spline interpolant of the velocity profiles. We use the dependence between the stress and the rate of shear obtained via classical rotational rheometry and we relate the measured wall velocity gradients to the wall stresses in order to obtain experimentally the scaling law(s) for the wall slip phenomenon. Two scaling regimes are observed corresponding to partial and fully yielded flow. For partial yielded flow regime the slip velocity, Usscales with τwas Us∝ τw3.55. A linear scaling law of the slip velocity with the wall shear stresses is found, see Fig.5.
This study helped us to characterise the wall slip phenomenon of a Carbopol flow in a plane micro-channel for different flow regimes. The next step is to propose a model that can describe accurately the wall slip behaviour of a yield stress fluid flow depending on its rheological properties, wall shear stress and slip velocity.
References
[1] P. Coussot, Rheometry of pastes, suspensions and granular materials, John Willey & Sons, 2005. [2] W. H. Herschel and R. Bulkley, Konsistenzmessungen von Gummi-Benzollösungen
Kolloid-Zeitschrift, 39 (1926) 291–300.
[3] W.H. Herschel and T. Bulkley, Measurement of consistency as applied to rubbery benzene solutions, Am. Soc. Test Proc., 26 (1926) 621–633.
[4] J.M. Piau, Carbopol gels: Elastoviscoplastic and slippery glasses made of individual swollen sponges: Meso- and macroscopic properties, constitutive equations and scaling laws, Journal of Non-Newtonian Fluid Mechanics, 144 (2007) 1–29.
[5] A. M. V. Putz and T. I. Burghelea, The solid-fluid transition in a yield stress shear thinning physical gel, Rheol Acta, 48 (2009) 673–689.
[6] S. J. Curran, R. E. Hayes, A. Afacan, M. C. Williams and P. A. Tanguy, Properties of Carbopol Solutions as Models for Yield-Stress Fluids, Journal of Food Science, 67 (2002) 176–180,
[7] T. Divoux, D. Tamarii, C. Barentin and S. Manneville, Transient Shear Banding in a Simple Yield Stress Fluid, Phys. Rev. Lett., 104 (2010) 208–301.
[8] D. M. Kalyon, Apparent slip and viscoplasticity of concentrated suspensions, Journal of Rheology, 49 (2005) 621–640.
[9] B. Ouriev and E. Windhab, Rheological study of concentrated suspensions in pressure-driven shear flow using a novel in-line ultrasound Doppler method, Experiments in Fluids, 32 (2002) 204–211. [10] Wall slip and rheological behavior of petroleum-coke sludge slurries flowing in pipelines, X. Ma
[11] J. Pérez-González, J. López-Durán, B. Marín-Santibáñez and F. Rodríguez-González, Rheo-PIV of a yield-stress fluid in a capillary with slip at the wall, Rheologica Acta, 51 (2012) 937–946. [12] F. Scarano and M. L. Rhiethmuller, Advances in iterative multigrid PIV image processing, Exp.
Fluids, 29 (2001).
[13] M. Raffel, C. E. Willert, S. T. Wereley and J. Kompenhans, Particle Image Velocimetry: A Practical Guide (Experimental Fluid Mechanics), 2007
[14] Y. Liu, D. Lorusso, D. W. Holdsworth, T. L. Poepping and J. R. de Bruyn, Effect of confinement on the rheology of a yield-stress fluid, Journal of Non-Newtonian Fluid Mechanics, 261 (2018) 25–32. [15] A. Poumaere, M. Moyers-Gonzalez, C. Castelain and T. Burghelea Unsteady laminar flows of a Carbopol gel in the presence of wall slip ", Journal of Non-Newtonian Fluid Mechanics ", 205 (2014) 28–40.
[16] T. Q. Jiang, A. C. Young, and A. B. Metzner, The rheological characterization of HPG gels: Mea-surement of slip velocities in capillary tubes, Rheologica Acta, 25 (1986) 397–404.
[17] Steven P. Meeker and Roger T. Bonnecaze and Michel Cloitre, Slip and flow in pastes of soft particles: Direct observation and rheology, Journal of Rheology, 48 (2004) 1295–1320.