Titre:
Title:
Ultrasonication of spray- and freeze-dried cellulose nanocrystals in water
Auteurs:
Authors:
Quentin Beuguel, Jason Robert Tavares, Pierre J. Carreau et Marie-Claude Heuzey
Date: 2018
Type: Article de revue / Journal article
Référence:
Citation:
Beuguel, Q., Tavares, J. R., Carreau, P. J. & Heuzey, M.-C. (2018). Ultrasonication of spray- and freeze-dried cellulose nanocrystals in water. Journal of Colloid and Interface Science, 516, p. 23-33. doi:10.1016/j.jcis.2018.01.035
Document en libre accès dans PolyPublie
Open Access document in PolyPublie URL de PolyPublie:
PolyPublie URL: https://publications.polymtl.ca/3004/
Version: Version finale avant publication / Accepted versionRévisé par les pairs / Refereed Conditions d’utilisation:
Terms of Use: CC BY-NC-ND
Document publié chez l’éditeur officiel
Document issued by the official publisher Titre de la revue:
Journal Title: Journal of Colloid and Interface Science (vol. 516) Maison d’édition:
Publisher: Elsevier URL officiel:
Official URL: https://doi.org/10.1016/j.jcis.2018.01.035 Mention légale:
Legal notice: "In all cases accepted manuscripts should link to the formal publication via its DOI"
Ce fichier a été téléchargé à partir de PolyPublie, le dépôt institutionnel de Polytechnique Montréal
This file has been downloaded from PolyPublie, the institutional repository of Polytechnique Montréal
1 2 3 4 5 6 7 8 9 10 11 12 13 14 15 16 17 18 19 20 21 22 23 24 25 26 27 28 29 30 31 32 33 34 35 36 37 38 39 40 41 42 43 44 45 46 47 48 49 50 51 52 53 54 55 56 57 58 59 60 61
Ultrasonication of spray- and freeze-dried cellulose nanocrystals in water
1Quentin BEUGUEL, Jason R. TAVARES, Pierre J. CARREAU, Marie-Claude
2
HEUZEY
3
Department of Chemical Engineering, CREPEC – Research Center on High Performance
4
Polymer and Composite Systems, Polytechnique Montreal, Montreal, QC, H3T 1J4, Canada.
5
Corresponding author: Marie-Claude Heuzey (E-mail: marie-claude.heuzey@polymtl.ca, +1 6 (514) 340-4711 ext. 5930 7 8 Abstract 9 10
The structural and rheological properties of aqueous suspensions of spray-dried
11
cellulose nanocrystals (CNCs) were investigated and compared to those of freeze-dried. The
12
cellulose nanocrystals were obtained from sulfuric acid hydrolysis of wood pulp.
13
Ultrasonication was used to disperse cellulose nanocrystals in Milli-Q water and the power
14
applied during ultrasonication was shown to be the controlling parameter for their dispersion,
15
more than total energy. Dynamic light scattering measurements showed a decrease of the
16
average hydrodynamic diameter down to the same limiting value, i.e. ~ 75 nm, for both spray
17
and freeze-dried cellulose nanocrystals. Since the same maximum dispersion state was
18
reached for both CNC types, it indicated that the spray drying process did not limit dispersion,
19
provided that sufficient ultrasonication was provided. Moreover, no desulfation occurred
20
during ultrasonication at ambient temperature. Strong ultrasonication also caused a decrease
21
of intrinsic viscosity, along with an increase in maximum packing concentration. These
22
properties were correlated to agglomerates break-up, which released both ions and water in
23
suspension. The ionic strength increase may lead to a thinner electrostatic double layer
24
surrounding the cellulose nanocrystals, reducing their apparent concentration.
25 26
Keywords: cellulose nanocrystals (CNCs); spray drying; ultrasonication; aqueous
27
suspension; structure; rheology
28 29
*4c: Unmarked Revised manuscript
1 2 3 4 5 6 7 8 9 10 11 12 13 14 15 16 17 18 19 20 21 22 23 24 25 26 27 28 29 30 31 32 33 34 35 36 37 38 39 40 41 42 43 44 45 46 47 48 49 50 51 52 53 54 55 56 57 58 59 60 1. Introduction 1 2
Since the early 2000s, biodegradable and biosourced cellulose nanocrystals (CNCs)
3
have been widely studied for their high stiffness and large aspect ratio, in order to improve the
4
mechanical properties of thermoplastics [1–3]. The CNC source and extraction method
5
influence their final physicochemical properties [4–8]. Surface ionic groups and high polarity
6
favor CNC dispersion at the nanoscale in water [9] or in polar thermoplastics prepared by
7
solution mixing [6,10,11]. However, only a few approaches for non-polar thermoplastic
8
nanocomposite elaboration by melt mixing have been investigated [12–14]. This is in large
9
part because of dispersion issues: spray or freeze-drying processes [9] are used to prepare
10
CNCs [15], but these cause strong particle agglomeration [16,17]. Thus CNCs are difficult to
11
redisperse for chemical modification [18,19] or to obtain nanocomposites. Spray- and
freeze-12
drying processes lead to various CNC powder properties [20], especially in terms of bulk
13
density and porosity [21,22], suggesting different possible dispersion states in a solvent [9].
14
Agglomerate break-up is difficult to achieve, especially for the smallest ones [21], but can be
15
achieved through ultrasonication. This process, based on cavitation phenomena [23], was
16
demonstrated to be efficient to redisperse CNCs in aqueous suspensions [24–26]. An
17
ultrasonication time of a few hundreds of seconds [27–29] or an energy of a few thousand
18
joules per gram of CNCs [9,30] enables the break-up of agglomerates. Moreover, ultrasounds
19
could also cause disruption of the electrostatic double layer surrounding the CNC particles
20
[24]. However, the influence of these parameters has scarcely been investigated. Rheological
21
properties may provide an interesting avenue, as these have been widely studied for
22
electrostabilized colloidal suspensions, taking into account both the particle size and their
23
electrostatic double layer thickness [31,32]. The interest of rheology as a tool to characterize
24
CNC aqueous suspensions was demonstrated recently [33], with three
concentration-25
dependent behaviors identified: i) isotropic at low concentrations, ii) lyotropic liquid crystal
26
due to the chiral nematic structure [34,35] of CNCs, at intermediate concentrations and,
27
finally, iii) gel, at high concentrations [30,36]. The threshold concentrations can be correlated
28
with the nanoparticle aspect ratio [33]. The surface groups [37] and their charge density
29
[38,39] also affect the rheological behavior of CNC suspensions. For example, Shafiei-Sabet
30
et al. [38] showed lower viscosity values for aqueous suspensions containing CNCs with a
31
higher content of ionic groups on their surface. On the other hand, the addition of salts can
32
modify the electrostatic double layer and disturb the electrostatic repulsion, which first
33
1 2 3 4 5 6 7 8 9 10 11 12 13 14 15 16 17 18 19 20 21 22 23 24 25 26 27 28 29 30 31 32 33 34 35 36 37 38 39 40 41 42 43 44 45 46 47 48 49 50 51 52 53 54 55 56 57 58 59 60 61
temperatures [43] or ultrasonication energy [30] may change the rheological behavior of CNC
1
suspensions, by increasing the size of chiral nematic domains. Models based on the Einstein
2
equation [44] for hard sphere suspensions have been proposed to explain the rheological
3
behavior of CNC suspensions, using intrinsic viscosity data. For example, the Huggins [45]
4
and Fedors [46] models, classically used for polymers in dilute and semi-dilute regimes, have
5
been adapted to fit the relative viscosity variations of CNC suspensions as a function of
6
concentration [36,40,47–49]. However, no consensus on the mechanisms and parameters
7
controlling the rheological properties of these suspensions has been reached.
8
The aim of this study is to improve our knowledge on the behavior of CNCs in aqueous
9
suspensions, accounting for their industrial preparation method (spray drying), without
10
additional modification. Moreover, special attention is paid to the ultrasonication method used
11
to redisperse CNCs, both in terms of energy and power.
12 13
2. Materials and methods
14 15
The CNCs were obtained from sulfuric acid hydrolysis of wood pulp [7], inducing sulfate half
16
ester groups O-SO3H on the CNC surface [50], easily deprotonated due to their low pKa close
17
to 0. CNCs used in this study were supplied, in dry form after neutralization with sodium
18
hydroxide (NaOH) and spray or freeze drying processes [9], by CelluForce (Montreal,
19
Canada) and FPInnovations (Pointe Claire, Canada), respectively. The density of CNCs was
20
taken equal to 1,540 kg.m-3.
21 22
CNC suspensions at = 5 wt% were ultrasonicated using a Sonics & Materials
23
VCX500 probe, operating at 20 kHz, with power P of 10, 50 and 90 W and energy E ranging
24
from 2,500 to 10,000 J/gCNC. The volume in the glass container used was ~ 40 cm3 (2.9 cm
25
height by 2.1 cm radius); it was placed in an ice bath while ultrasonication was applied in
26
various pulse cycles: 10 s ON / 1 s OFF for P = 10 W, and of 1 s ON / 1 s OFF for P = 50 and
27
90 W, to avoid overheating. Then, the CNC suspensions were diluted with Milli-Q water (at
28
18.2 M.cm)to obtain a weight fraction range from 0 to 5 wt%.
29 30
1 2 3 4 5 6 7 8 9 10 11 12 13 14 15 16 17 18 19 20 21 22 23 24 25 26 27 28 29 30 31 32 33 34 35 36 37 38 39 40 41 42 43 44 45 46 47 48 49 50 51 52 53 54 55 56 57 58 59 60
The electric conductivity of spray-dried CNC suspensions before and after an
1
ultrasonication at P = 50 W and E = 10,000 J/gCNC was measured at room temperature using a
2
conductimeter Inolab pH/Ion/Cond 750 (WTW). The average value of was calculated from
3
5 measurements and the data are accurate to ± 20 µS/cm.
4 5
Quantitative elemental analysis was performed with a Tabletop Hitachi TM3030+
6
scanning electron microscope (SEM), operating at 15kV and equipped with X-Ray
7
spectroscopy (EDX). Such analyses were conducted on CNC powders or flat films obtained
8
after a slow drying of the suspension under vacuum. The number of sulfate groups attached
9
on the CNC surface was determined from measurements before and after suspension dialysis
10
in Milli-Q water. 25 mL of the CNC suspension ( = 1 wt%) was dialysed for 2 h through a
11
Spectra/Por 2 12-14 kDa Standard Regenerated Cellulose porous membrane (Spectrumlabs)
12
using 2.5 L of water. This step was repeated three times for each sample. For all samples, the
13
average atomic ratio of sulfur to carbon (S/C) was obtained from 10 measurements of X-rays
14
emitted (acquired for 60 s, each), on different areas.
15 16
Nanometer-scale observations were performed using a Jeol JEM 2100F transmission
17
electronic microscope (TEM) bright field imaging, under focus to maximize contrast,
18
operating at 200 kV. The suspensions were diluted to = 0.001 wt% and dried, on copper
19
TEM grids (Electron Microscopy Sciences) with a thin film (5 – 6 nm) of pure carbon
20
deposited on one side (CF200-Cu), for 30 min. The average length L0, diameter d0 and aspect
21
ratio p0 of individual CNCs were measured on 100 particles at least for each sample. The
22
average values are accurate to ± 10%.
23 24
Micrometer-scale observations were performed in order to show any isotropic or
25
anisotropic structures in the CNC suspensions ( ranging from 3 to 7 wt%). These were
26
conducted with a Zeiss Axio Scope A1 optical microscope, equipped with a QImaging
27
QICAM-12-bit camera and cross polarizer.
28 29
Zeta potential measurements, related to the particle electrophoretic mobility through the
30
Smoluchowski equation [51], were performed on 0.2 wt% CNC suspensions (prepared in
31
different conditions) at 25 °C, using a Malvern Zetasizer Nano-ZS (DTS1070 cell). These
32
measurements characterized the particle charge density, quasi-independently of their size
1 2 3 4 5 6 7 8 9 10 11 12 13 14 15 16 17 18 19 20 21 22 23 24 25 26 27 28 29 30 31 32 33 34 35 36 37 38 39 40 41 42 43 44 45 46 47 48 49 50 51 52 53 54 55 56 57 58 59 60 61
[52]. The average value of 5 successive measurements (10 runs of 15 s each) was determined.
1
The same instrument was used to measure the particle size by dynamic light scattering (DLS).
2
Tests were carried out in backscattering mode at an angle of 173°. The particle number and
3
volume size distributions were inferred from the intensity, considering refractive and
4
adsorption indices of 1.59 and 0.01, respectively. Each curve was an average measured for
5
three different fractions ( = 0.05, 0.1 and 0.2 wt%), all of them obtained from 5 successive
6
measurements of 10 runs of 15 s each. Volume average Dv and number average Dn diameters
7
were calculated to determine the average polydispersity index Dv/Dn. The Z-average,
8
representing the intensity-weighted mean hydrodynamic diameter, was also reported. These
9
values are accurate to ± 10 %.
10 11
Rheological tests were carried out using a controlled stress rheometer, MCR502 (Anton
12
Paar), equipped with a double-wall Couette flow geometry. Time sweep measurements in the
13
linear domain showed that the viscoelastic properties of the CNC suspension ( = 3 wt%)
14
were stable for 10 h. In addition, for all suspensions, frequency sweep ( ranging from 100
15
rad.s-1 to 10-2 rad.s-1) at a strain within the linear viscoelastic regime, and shear rate (
16
ranging from 0.5 to 500 s-1) tests were performed. These tests were conducted at T = 25°C,
17
within a maximum time frame of 10 h after ultrasonication. All rheological tests were
18
performed after a pre-shear of 100 s at 10 s-1 and a rest time of 180 s, to homogenize the
19
suspensions. Rheological tests were reproducible to ± 10%.
20 21
3. Results
22 23
3.1 Ionic charge properties
24 25
The conductivity of a 5 wt% spray-dried CNC suspension, without salt addition (pH
26
close to 6.8), before and after a strong ultrasonication (P = 50 W and E = 10,000 J/gCNC)
27
increases from ~ 400 to 540 µS.cm-1 attributed to the higher number of ions available in
28
water, as observed by Beck et al. [24]. According to Sposito’s [53] work on soil solutions, the
29
empirical relation of Marion-Babcock [54] between the ionic strength (in mol.m-3) and the
30
electrical conductivity (in dS.m-1) is accurate for ionic strengths up to about 300 mol.m-3:
31
logI 1.1591.009log (1)
1 2 3 4 5 6 7 8 9 10 11 12 13 14 15 16 17 18 19 20 21 22 23 24 25 26 27 28 29 30 31 32 33 34 35 36 37 38 39 40 41 42 43 44 45 46 47 48 49 50 51 52 53 54 55 56 57 58 59 60
Using Eq.1, the ionic strength I increases from 5.7 to 7.7 mol.m-3, before and after a
1
strong ultrasonication. Then, the Debye-Hückel length -1, characterizing the electrostatic
2
double layer thickness can be calculated [55]:
3 I N e T k K A B r 20 1 2 (2) 4
where r, r, kB, T, e and NA are the relative and vacuum permittivity, the Boltzmann constant,
5
the temperature, the net charge of an electron and the Avogadro’s number, respectively. -1
6
is ranging from ~ 4.1 to 3.5 nm for non- and strong ultrasonicated CNC suspensions, close to
7
the value estimated by titration to neutralize never-dried CNC suspension (pH close to 3) with
8
NaOH solution up to a pH = 7. Indeed, the addition of ~ 4 mL of NaOH at 100 mol.m-3 was
9
necessary to neutralize 40 mL of the 5 wt% never-dried CNC suspension. The resulting ionic
10
strength related to the ion concentration was calculated from Eq. (3) [49]:
11
i i i z C I 2 2 1 (3) 12where Ci is the molar concentration of solvated ions and zi their valence, resulting in I = 10
13
mol.m-3 and Debye-Hückel length -1 of 3.1 nm (Eq. 2), in agreement with the above
14
estimates.
15 16
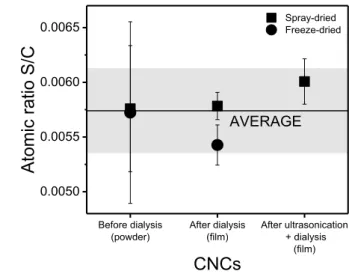
Figure 1 presents the S/C atomic ratio measured by EDX for spray-dried and
freeze-17
dried CNC suspensions, before and after dialysis, and after ultrasonication at P = 50 W and E
18 = 10,000 J/gCNC. 19 20 21 Before dialysis
(powder) After dialysis(film) After ultrasonication + dialysis (film) 0.0050 0.0055 0.0060 0.0065 Spray-dried Freeze-dried Atomic ratio S/C CNCs AVERAGE 22
Figure 1: Atomic ratio S/C for CNC suspensions. The grey area represents the average standard deviation. 23
1 2 3 4 5 6 7 8 9 10 11 12 13 14 15 16 17 18 19 20 21 22 23 24 25 26 27 28 29 30 31 32 33 34 35 36 37 38 39 40 41 42 43 44 45 46 47 48 49 50 51 52 53 54 55 56 57 58 59 60 61 1
The standard deviation for the S/C ratio measured for the CNC powders before dialysis
2
is higher than for CNC flat films after dialysis and could be due to surface topography. For all
3
samples, the S/C atomic ratio is close to 0.0057, corresponding to 3.4 O-SO3H groups per 100
4
anhydroglucose units and a substitution degree SD ~ 1.15%, considering three hydroxyl
5
groups (OH) per glucose unit, in the same order of magnitude as the value reported by
6
Sojoudiasli et al. [56], using X-Ray photoelectronic spectroscopy (XPS). Let us note that
7
using SD as a comparative value makes sense, but it does not distinguish between the groups
8
available at the external surface of the CNCs from the internal ones not accessible for
9
subsequent reaction [57], nor does it provide information on the OH groups conformation and
10
reactivity [58]. SD defined as such cannot reach 100%. Finally, whatever the CNC used or the
11
ultrasonication treatment, a similar -potential (~ - 48 mV), characterizing the particle charge
12
density, was measured for ultrasonicated particles (Supporting Information, Table S1), close
13
to the value obtained by Zhong et al. [59].
14 15
3.2 Structural properties
16 17
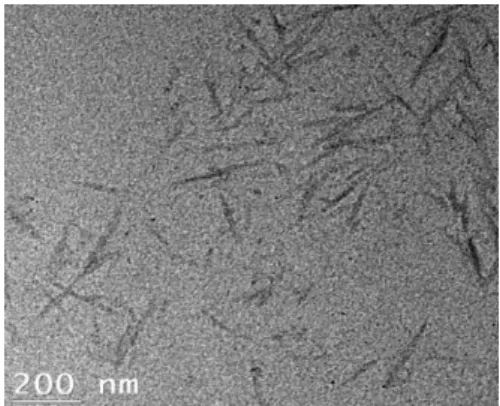
Figure 2 shows a TEM image of a spray-dried CNC suspension after ultrasonication at
18
P = 50 W and E = 10,000 J/gCNC, with = 0.001 wt%. Spray-dried CNC nanorods in Figure 2
19
have an average length L0 ~ 165 nm and diameter d0 ~ 13 nm, corresponding to an aspect ratio
20
p0 ~ 12.5: these values are similar to those of freeze-dried samples (for any level of
21
ultrasonication) and close to the values obtained by Lenfant et al. [42]. The ultrasonication
22
method used in this work does not break nanoparticles, in disagreement with the finding of
23
Csiszar et al. [29]. It is worth pointing out that in TEM individual CNCs may be mistaken
24
with very small bundles of CNCs and high resolution atomic force microscope (AFM) would
25
provide more accurate values, according to Uhlig et al. [60].
26 27
1 2 3 4 5 6 7 8 9 10 11 12 13 14 15 16 17 18 19 20 21 22 23 24 25 26 27 28 29 30 31 32 33 34 35 36 37 38 39 40 41 42 43 44 45 46 47 48 49 50 51 52 53 54 55 56 57 58 59 60
Figure 2: TEM image of a spray-dried CNC suspension. 1
2
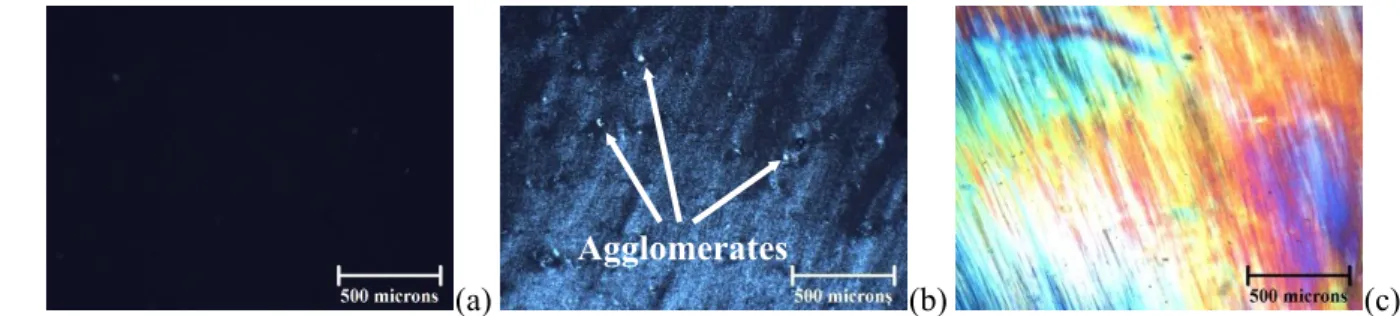
Figure 3 presents optical micrographs for a spray-dried CNC suspension ultrasonicated
3
at P = 10 W and E = 10,000 J/gCNC, with = 3-7 wt%. As the CNC concentration increases the
4
polarized light intensity increases from none at = 3 wt% (isotropic, Figure 3.a) to full
5
iridescence at = 7 wt% (Figure 3.c) [43], characteristic of the anisometric behavior of the
6
suspension and in agreement with the chiral nematic structure adopted by CNCs [35].
7
Moreover, some agglomerates of a few micrometers are clearly observed in Figure 3.b. These
8
suggest a double structuration of CNCs in aqueous suspensions: i) at the microscale, there are
9
some agglomerates while ii) at the nanoscale, the orientation of CNC nanoparticles leads to
10
iridescence of the suspension.
11 12
(a) (b) (c)
13
Figure 3: Optical micrographs for spray-dried CNC suspensions ultrasonicated at P = 10 W and E = 10,000 14
J/gCNC with = 3 wt% (a), 5 wt% (b) and 7 wt% (c).
15 16
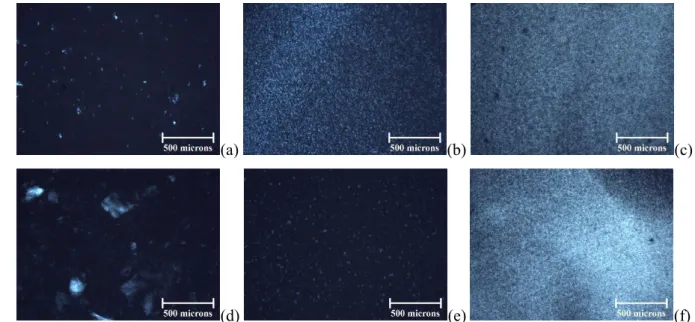
Figure 4 presents optical micrographs of spray-dried (a-c) and freeze-dried (d-f) 4 wt%
17
CNC suspensions, respectively, after different ultrasonication treatments. A double structure
18
is also observed in Figure 4, with very bright points and diffuse iridescence, due to
19
agglomerates and nanostructuration of CNCs, respectively. The fingerprint texture of CNC
20
agglomerates seen in Figure 4.d could be related to a local chiral nematic structure [35].
21
Increased ultrasonication power or energy leads to the break-up of agglomerates in single
22
particles. For a same total energy, the break-up of agglomerates is clearly more efficient for
23
the power of P = 50 W (Figures 4.b and e) compared to P = 10 W (Figures 4.a and d). These
24
phenomena are observable for spray-dried CNC suspensions (Figures 4.a-c), but they are
25
more intense for the freeze-dried CNC suspensions (Figures 4.d-f).
26 27
1 2 3 4 5 6 7 8 9 10 11 12 13 14 15 16 17 18 19 20 21 22 23 24 25 26 27 28 29 30 31 32 33 34 35 36 37 38 39 40 41 42 43 44 45 46 47 48 49 50 51 52 53 54 55 56 57 58 59 60 61 (a) (b) (c) 1 (d) (e) (f) 2
Figure 4: Optical micrographs of a spray-dried (a-c) and freeze-dried (d-f) 4 wt% CNC suspension after 3
ultrasonication at P = 10 W and E = 5,000 J/gCNC (a); at P = 50 W and E = 5,000 J/gCNC (b); P = 50 W and E =
4
10,000 J/gCNC (c); P = 10 W and E = 2,500 J/gCNC (d); P = 50 W and E = 2,500 J/gCNC (e) and P = 50 W and E =
5
10,000 J/gCNC (f).
6 7
Figure 5 reports the particle equivalent hydrodynamic diameter (d) distributions of CNC
8
particles for spray-dried (a and b) and freeze-dried (c and d) suspensions, respectively, in
9
intensity (a, c) and number (b, d), following different ultrasonication treatments. The light
10
intensity diffused by larger particles is more important and the intensity-based size
11
distribution (Figure 5.a and c) tends to highlight the larger CNC particles in suspension. These
12
data are then used to determine the number-based distributions (Figure 5.b and d). Figure 5.a
13
and c show large particles (d > 100 nm), especially for low ultrasonication in terms of power
14
and/or energy. By increasing both ultrasonication power and energy, the curves shift towards
15
smaller hydrodynamic diameters, confirming that ultrasonication breaks large particles or
16
agglomerates, in agreement with the optical microscope observations of Figure 4. However,
17
the number size distributions indicate a larger number of small particles, with diameters close
18
to a few tens of nanometers (Figure 5.b and d). Ultrasonication does not have the same effect
19
on spray-dried (Figure 5.a and b) and freeze-dried (Figure 5.c and d) suspensions, and the
20
diameter decrease is clearer for the freeze-dried CNC suspensions.
1 2 3 4 5 6 7 8 9 10 11 12 13 14 15 16 17 18 19 20 21 22 23 24 25 26 27 28 29 30 31 32 33 34 35 36 37 38 39 40 41 42 43 44 45 46 47 48 49 50 51 52 53 54 55 56 57 58 59 60 101 102 103 0 5 10 15 20 25 30 a)
Intensit
y [
%]
d [nm]
P = 10 W ; E = 5,000 J/gCNC P = 10 W ; E = 7,500 J/gCNC P = 10 W ; E = 10,000 J/gCNC P = 50 W ; E = 5,000 J/gCNC P = 50 W ; E = 10,000 J/gCNC 101 102 103 0 5 10 15 20 25 30 b)Number [%]
d [nm]
P = 10 W ; E = 5,000 J/gCNC P = 10 W ; E = 7,500 J/gCNC P = 10 W ; E = 10,000 J/gCNC P = 50 W ; E = 5,000 J/gCNC P = 50 W ; E = 10,000 J/gCNC 1 101 102 103 0 5 10 15 20 25 30 c)Intensit
y [
%]
d [nm]
P = 10 W ; E = 2,500 J/gCNC P = 10 W ; E = 5,000 J/gCNC P = 50 W ; E = 2,500 J/gCNC P = 50 W ; E = 10,000 J/gCNC 101 102 103 0 5 10 15 20 25 30 d)Number [%]
d [nm]
P = 10 W ; E = 2,500 J/gCNC P = 10 W ; E = 5,000 J/gCNC P = 50 W ; E = 2,500 J/gCNC P = 50 W ; E = 10,000 J/gCNC 2Figure 5: Hydrodynamic CNC diameter distributions in intensity (a, c) and number (b, d) for spray-dried (a, b) 3
and freeze-dried (c, d) suspensions.
4 5
Figure 6 presents the Z-average hydrodynamic mean diameter of CNC particles and the
6
polydispersity index Dv/Dn as a function of ultrasonication energy for spray-dried (a) and
7
freeze-dried (b) CNC suspensions ultrasonicated at P = 10 and 50 W. Overall, the Z-average
8
diameter and polydispersity index decrease with both power and energy of ultrasonication and
9
clearly reach the same limiting values for spray-dried (Figure 6.a) and freeze-dried (Figure
10
6.b) CNC particles. Moreover, the power seems to be the main parameter governing this
11
decrease. For both power values (P = 10 and 50 W), the minimum Z-average diameter of the
12
CNC particles is ~ 75 nm (in agreement with the value measured by Beck et al. [9]) and the
13
polydispersity index reaches ~ 2 for both the spray-dried and freeze-dried suspensions at E =
14
10,000 J/gCNC. The theoretical equivalent hydrodynamic diameter Dz can be calculated from
15
the Stokes-Einstein relation:
1 2 3 4 5 6 7 8 9 10 11 12 13 14 15 16 17 18 19 20 21 22 23 24 25 26 27 28 29 30 31 32 33 34 35 36 37 38 39 40 41 42 43 44 45 46 47 48 49 50 51 52 53 54 55 56 57 58 59 60 61 t s B z k TD D 3 (4) 1
where kB, T, s and Dt are the Boltzmann constant, the temperature, the solvent viscosity
2
and the translational diffusion coefficient, respectively. As used by de Souza Lima et al. [61]
3
for CNCs, the translational diffusion coefficient Dt is written for rod-like shaped particles
4 [62,63]: 5
0.5( )
3 0
L T k D s B t (5) 6 with ln(2L0 /d0) 7 and
0.8070.15/
13.5/
237/
322/
4 8
0
.
193
0
.
15
/
8
.
1
/
2
18
/
3
9
/
4 9 10Recently, in the case of CNCs, Fraschini et al. [64] proposed to modify the translational
11
diffusion coefficient Dt using the Perrin factor S [65] for cylinder-shaped particles:
12
S
L
T
k
D
s B t 03
(6) 13 withS
32
3
(
L
0/
d
0()
f
/
f
0))
1 14 and 15 3 0 0 2 0 0 0 0 01
.
009
0
.
01395
ln(
/
)
0
.
0788
ln(
/
)
0
.
00604
ln(
/
)
/
f
L
d
L
d
L
d
f
16 17Taking the average dimensions of CNC nanoparticles measured by TEM (L0 ~ 165 nm
18
and d0 ~ 13 nm) and considering the influence of the electrostatic double layer thickness (-1=
19
3.5 nm, (x 2)) on the effective diameter in aqueous suspensions, Dz = 79.9 nm and Dz = 66.3
20
nm (Eq.4), using Eq.5 and Eq.6 for Dt, respectively. These theoretical values are in good
21
agreement with the Z-average limiting value measured by DLS (~ 75 nm). In the case of
22
ultrasonicated suspensions at P = 50 W, these plateau values are obtained at lower energies
23
(between 2,500 and 5,000 J/gCNC). Finally, it is worth pointing out that the initially increasing
24
values reported for the spray-dried CNC suspension ultrasonicated at P = 10 W when E is
25
increased from 5,000 J/gCNC to 7,500 J/gCNC (Figure 6.a) suggest difficulties to perfectly control
26
the CNC dispersion state and particle size homogeneity at a low ultrasonication power.
1 2 3 4 5 6 7 8 9 10 11 12 13 14 15 16 17 18 19 20 21 22 23 24 25 26 27 28 29 30 31 32 33 34 35 36 37 38 39 40 41 42 43 44 45 46 47 48 49 50 51 52 53 54 55 56 57 58 59 60 1 2 0 2500 5000 7500 10000 50 75 100 125 150 175 200 225 250 a) Spray-dried P = 10 W Spray-dried P = 50 W Energy [J/gCNC] Z-Average [nm] LIMIT 1 2 3 4 5 6 7 8 9 10 Polydi spersity inde x 0 2500 5000 7500 10000 50 75 100 125 150 175 200 225 250 b) Freeze-dried P = 10 W Freeze-dried P = 50 W Energy [J/gCNC] Z-Average [nm] 1 2 3 4 5 6 7 8 9 10 LIMIT Polydi spersity inde x 3
Figure 6: Z-average hydrodynamic diameter (in black) and polydispersity index (in red) as a function of 4
ultrasonication energy for spray-dried (a) and freeze-dried (b) CNC suspensions ultrasonicated at P = 10 (open
5
symbols) and 50 W (filled symbols). The grey area represents the error bar corresponding to the limiting values.
6 7
In the case of the spray-dried CNC suspensions, ultrasounds seem to gradually erode a
8
few large agglomerates, in agreement with a less marked size decreases observed in the DLS
9
data (Figures 5 and 6). However, the break-up of regular size agglomerates occurs for
freeze-10
dried CNC suspensions, down to individual CNCs or very small bundles. For the same power,
11
higher energy seems to be necessary to achieve the dispersion of spray-dried CNCs.
12 13 14 3.3 Rheological properties 15 16
The rheological behavior of aqueous suspensions (in the semi-dilute regime < gelation)
17
is presented and discussed in this section. Figure 7 shows the elastic G’ (a) and loss G” (b)
18
moduli as functions of angular frequency and the complex * and shear viscosities (c) as
19
functions of angular frequency or shear rate , for spray-dried 0 - 5 wt% CNC suspensions
20
ultrasonicated at P = 50 W and E = 10,000 J/gCNC. No significant elastic modulus could be
21
measured for the suspensions containing less than 4 wt% CNCs and G’ (Figure 7.a) is smaller
22
than G” (Figure 7.b) over the whole frequency range, as expected for a liquid-like behavior.
23
For suspensions containing less than 4 wt% CNCs a Newtonian behavior is observed at low
24
frequencies (Figure 7.c), characterized by 0. The suspensions containing 4 and 5 wt% CNCs
25
exhibit a viscoelastic behavior with slight shear-thinning viscosity curves at low frequencies
1 2 3 4 5 6 7 8 9 10 11 12 13 14 15 16 17 18 19 20 21 22 23 24 25 26 27 28 29 30 31 32 33 34 35 36 37 38 39 40 41 42 43 44 45 46 47 48 49 50 51 52 53 54 55 56 57 58 59 60 61
and shear rates, followed by a pseudo Newtonian plateau 0 (Figure 7.c) at intermediate
1
frequencies and shear rates. Similar results have already been reported in the literature
2
[30,36], and the suspension behavior shifts from isotropic ( = 1–3 wt%) to lyotropic liquid
3
crystal behavior ( = 4 - 5 wt%), due to the chiral nematic structure of CNCs, in agreement
4
with the onset of iridescence (Figure 3). Moreover, the Cox-Merz rule is not valid for
5
lyotropic liquid crystal (Figure 7.c), as mentioned by Urena Benavides et al. [43]. Finally, for
6
all suspensions, the orientation of CNCs in the flow direction leads to another shear-thinning
7
behavior above a critical shear rate c, quasi-independent of volume fraction.
8 9 10-1 100 101 10-3 10-2 10-1 100 0 wt% 1 wt% 2 wt% 3 wt% 4 wt% 5 wt% G' [Pa] [rad.s-1] a) 10 10-1 100 101 10-3 10-2 10-1 100 G'' [Pa] [rad.s-1] b) 10-1 100 101 102 10-3 10-2 10-1 * [P a.s] ; [P a.s] c) .
c
o . [rad.s-1] ; [s-1] 11Figure 7: Elastic modulus G’ (a), loss modulus G” (b) and complex and shear viscosities (c) as functions of 12
angular frequency (open symbols) and shear rate (filled symbols) for spray-dried 0-5 wt% CNC suspensions
13
ultrasonicated at P = 50 W and E = 10,000 J/gCNC.
14 15
The critical shear rate c was estimated for both spray and freeze-dried samples after
16
different ultrasonication treatments from viscosity data presented in the supporting
1 2 3 4 5 6 7 8 9 10 11 12 13 14 15 16 17 18 19 20 21 22 23 24 25 26 27 28 29 30 31 32 33 34 35 36 37 38 39 40 41 42 43 44 45 46 47 48 49 50 51 52 53 54 55 56 57 58 59 60
information (Supporting Information, Figure S1). The Péclet number, Pe, characterizes the
1
balance between the Brownian motion and hydrodynamic forces. Pe = 1 corresponds to the
2
limit between Newtonian plateau (Pe <1) and shear thinning due to particle orientation in the
3
flow direction (Pe >1). In the case of rod-like particles of aspect ratio p, the rotational Péclet
4
number, Perot is defined by [32] :
5 3 Pe 3 (lns 0.8) rot B L k T p
3 sLL33
(7) 6where s is the viscosity of the solvent, L the particle length, kB the Boltzmann constant and T
7
the temperature. Perot = 1 corresponds to the critical shear rate, c and Figure 8 plots the
8
variation of c as a function of the ultrasonication energy for spray-dried (a) and freeze-dried
9
CNC suspensions ultrasonicated at P = 10 and 50 W. For both spray-dried and freeze-dried
10
CNCs, the critical shear rate c increases and seems to tend towards the same limiting value
11
with increasing energy, especially when the power is high (Figure 8). Using Eq. 7, the
12
increase of c for Perot = 1 is related to the decrease of L and the increase of p with
13
agglomerate break-up, and can be related to DLS measurements of Figure 6. However,
14
assuming that p = 12.5, the limiting value of c ~ 25 s-1 leads to L ~ 650 nm, which is three
15
times larger than CNC length measured from TEM images (L ~ 165 nm, Figure 2). This
16
suggests that c, corresponding to Perot = 1, is graphically underestimated and p is
17
overestimated by TEM and does not consider the larger effective diameter of CNC particles in
18
water (~ 20 nm) due to their electrostatic double layer thickness characterized by the Debye
19 length -1= 3.5 nm. 20 21 0 2,500 5,000 7,500 10,000 0 5 10 15 20 25 30 a) Spray dried P = 10 W Spray dried P = 50 W Energy [J/gCNC] LIMIT [s c -1 ] 0 2,500 5,000 7,500 10,000 0 5 10 15 20 25 30 b) Freeze dried P = 10 W Freeze dried P = 50 W c [s -1 ] Energy [J/gCNC] LIMIT 22
1 2 3 4 5 6 7 8 9 10 11 12 13 14 15 16 17 18 19 20 21 22 23 24 25 26 27 28 29 30 31 32 33 34 35 36 37 38 39 40 41 42 43 44 45 46 47 48 49 50 51 52 53 54 55 56 57 58 59 60 61
Figure 8: Critical shear rate c as a function of ultrasonication energy for spray-dried (a) and freeze-dried (b)
1
CNC suspensions ultrasonicated at P = 10 and 50 W. The grey area represents the error bar corresponding to the
2
limiting value.
3 4
Figure 9 presents the relative viscosity r, defined as the ratio of the pseudo Newtonian
5
plateau or the Newtonian viscosity 0 of the suspensions, depending on the CNC
6
concentration (Supporting Information, Figure S1), to that of water, as a function of CNC
7
concentration c (g.mL-1) for spray-dried (a) and freeze-dried (b) CNC suspensions following
8
various ultrasonication treatments. The experimental data of Figure 9 are fitted with the
9
Fedors model [46], used for suspensions in dilute and semi-dilute regimes in the presence of
10
agglomerates, defined by:
11
c cm 1 1 ) 1 ( 2 1 r (8) 12with c 1
eau in g.mL-1; cm the maximum packing concentration and [] the intrinsic13
viscosity in mL.g-1 equal to the sum of the rigid body []
0 and the electroviscous []el
14
contributions of particles [49,66].
15 16
Assuming p = 12.5 for all suspensions and using the following Simha relation for
17
nanorods [67] validated by Boluk et al. [40] in the case of CNCs:
18 19
) 5 . 0 2 (ln 5 ) 5 . 1 2 (ln 15 15 14 2 2 0 pp pp
(9) 20we obtain []0 ~ 18.5 = 12 mL.g-1 (changing the CNC concentration in g.mL-1). The values
21
for cm, and [] = []0 + []el (in mL.g-1) are listed in Table 1 for all suspensions.
1 2 3 4 5 6 7 8 9 10 11 12 13 14 15 16 17 18 19 20 21 22 23 24 25 26 27 28 29 30 31 32 33 34 35 36 37 38 39 40 41 42 43 44 45 46 47 48 49 50 51 52 53 54 55 56 57 58 59 60 0.00 0.01 0.02 0.03 0.04 0.05 0 50 100 150 200 250 300 a) P = 10 W; E = 5,000 J/gCNC P = 10 W; E = 7,500 J/gCNC P = 10 W; E = 10,000 J/gCNC P = 50 W; E = 2,500 J/gCNC P = 50 W; E = 5,000 J/gCNC P = 50 W; E = 10,000 J/gCNC P = 90 W; E = 10,000 J/gCNC Fedors model r c [g.mL-1] 0.00 0.01 0.02 0.03 0.04 0.05 0 50 100 150 200 250 300 b) P = 10 W; E = 2,500 J/gCNC P = 10 W; E = 5,000 J/gCNC P = 50 W; E = 2,500 J/gCNC P = 50 W; E = 10,000 J/gCNC Fedors model r c [g.mL-1] 1 2
Figure 9: Relative viscosity r as a function of concentration for spray-dried (a) and freeze-dried (b) CNC
3
suspensions. Lines correspond to the Fedors model fits.
4 5
Table 1. Maximum concentration c max and intrinsic viscosity [] for CNC suspensions
6 CNCs Power (W) (J/gEnergy CNC) Fedors model cm (g.mL-1) [] = []0 + []el (mL.g-1) [] []0 []el Spray-dried 10 5,000 0.067 105 12 93 7,500 0.075 100 88 10,000 ~ 0.11 50 2,500 0.075 100 88 5,000 ~ 0.11 10,000 90 10,000 ~ 0.11 100 88 Freeze-dried 10 2,500 0.024 210 198 5,000 0.029 200 188 50 2,500 0.103 110 98 10,000 ~ 0.11 100 88 7
For all suspensions, r increases with c up to a maximum packing concentration cm
8
where r tends towards infinity, a trend especially visible in the case of freeze-dried
9
suspensions that have been weakly ultrasonicated. Moreover, cm increases and []el (or [])
10
decreases with increasing ultrasonication power or energy (Table 1). These values are in
11
agreement with those reported in the literature [49]. The decrease of the particle size (Figure
12
6) leads to decreased suspension viscosity and increased cm, until a same maximum value (cm
1 2 3 4 5 6 7 8 9 10 11 12 13 14 15 16 17 18 19 20 21 22 23 24 25 26 27 28 29 30 31 32 33 34 35 36 37 38 39 40 41 42 43 44 45 46 47 48 49 50 51 52 53 54 55 56 57 58 59 60 61
size measured by DLS (Figure 6). Finally, Figure 10 presents a master curve of r as a
1
function of c/cm. This master curve can also be fitted by Fedors model substituting c by ceff =
2 0.11 c/cm. 3 4 0.0 0.2 0.4 0.6 0.8 1.0 0 50 100 150 200 250 300 Spray dried P = 10 W; E = 5,000/gCNC Spray dried P = 10 W; E = 7,500/gCNC Spray dried P = 10 W; E = 10,000/gCNC Spray dried P = 50 W; E = 2,500/gCNC Spray dried P = 50 W; E = 5,000/gCNC Spray dried P = 50 W; E = 10,000/gCNC Spray dried P = 90 W; E = 10,000/gCNC Freeze dried P = 10 W; E = 2,500/gCNC Freeze dried P = 10 W; E = 5,000/gCNC Freeze dried P = 50 W; E = 2,500/gCNC Freeze dried P = 50 W; E = 10,000/gCNC Fedors model r c/cm 5
Figure 10: Master curve for the relative viscosity, r, as a function of concentration c reduced by the maximum
6
packing concentration cm. The line corresponds to the fit of the Fedors model.
7 8
To summarize, spray- and freeze-dried CNCs have the same number of sulfate half ester
9
groups measured by EDX. The same optimal dispersion state can clearly be reached for both
10
CNC types, as illustrated by hydrodynamic diameter measurements and rheological
11
properties. Increased power and energy of ultrasonication decrease particle size by breaking
12
agglomerates into single nanoparticles or very small bundles, as observed with optical
13
microscopy and dynamic light scattering measurements. This particle size decrease is
14
correlated to a maximum packing concentration increase and an intrinsic viscosity reduction.
15
Spray-dried CNCs require more energy to achieve their maximum dispersion in water.
16
Moreover, ionic conductivity measurements suggest an increase of the average number of
17
ionic groups available in the aqueous suspensions.
18 19 4. Discussion 20 21
Because no decrease of the S/C ratio is observed by EDX (Figure 1) after a strong
22
ultrasonication and dialysis (which would have removed free ions), we conclude that all
O-23
SO3H groups remain attached to the spray- and freeze-dried CNC surface. This result clearly
24
demonstrates the absence of desulfation under ultrasonication, often reported as possible [38].
25
Thermodynamics support this result as well. Indeed, the maximum energy released as work
26
during ultrasonication can be estimated as E ~ 5,500 kJ.kg-1 = 100 kJ.mol-1. This calculation is
1 2 3 4 5 6 7 8 9 10 11 12 13 14 15 16 17 18 19 20 21 22 23 24 25 26 27 28 29 30 31 32 33 34 35 36 37 38 39 40 41 42 43 44 45 46 47 48 49 50 51 52 53 54 55 56 57 58 59 60
based on the implosion of a cavitation vapor bubble from maximum temperature T = 1,000 °C
1
and pressure P = 40 MPa to ambient conditions, with an enthalpy and speed losses of h ~
2
4,400 kJ.kg-1 and v ~ 1,500 m.s-1, respectively. An energy of 100 kJ.mol-1 is not sufficient to
3
break O-S covalent bonds [24], characterized by E~ 500 kJ.mol-1 [68]. On the other hand,
4
increase of the energy or power of ultrasonication breaks agglomerates in individual
5
nanoparticles or very small bundles, down to the same limiting hydrodynamic diameter (~ 75
6
nm, Figure 6) for both spray- and freeze-dried CNCs. The maximum critical shear rate
7
(Figure 8) and the minimum reduced viscosity (Figure 9) values correspond to the maximum
8
dispersion state of CNCs in water reported for both spray and freeze-dried suspensions, hence,
9
probably related to the substitution degree on CNC surface, controlled by sulfuric acid
10
hydrolysis conditions [4]. The break-up of the smallest agglomerates observed by optical
11
microscopy (Figures 4.a-c) and measured by DLS in the case of spray-dried CNC suspensions
12
(Figures 5.a and b) is not favored because of their high cohesion strength (in the range of 104
13
– 109 Pa for agglomerates diameter ranging from 50 to 0.5 µm without porosity. The cohesion
14
strength could decrease by two decades for high porosity [21]). The less inter-agglomerated
15
macroporous structure (pore size > 1 µm) of spray-dried CNCs (characterized by an higher
16
powder bulk density) could favor the formation of smaller agglomerates. That morphology
17
would reduce water absorption inside large agglomerates and decelerate break-up in the first
18
minutes of ultrasonication; this could however be adjusted by changing the spray-drying
19
conditions [20]. The dispersion mechanism occurring during ultrasonication, based on
20
cavitation, can overcome the hydrogen and/or van der Waals bonds between CNCs with
21
binding energy on the order of 10 kJ.mol-1 [17,21,69] (below the maximum energy released
22
by cavitation E ~ 100 kJ.mol-1). Time or total energy applied during ultrasonication controls
23
the number of implosions [28], but the instantaneous efficiency of cavitation is as low as the
24
power is weak, according to the relation between the amplitude imposed and the bubble
25
volume generated [23]. For the same lower energy (E < 5,000 J/gCNC), the use of P = 50 W
26
enhances the CNC dispersion compared to P = 10 W. Moreover, we need to mention that
27
before ultrasonication, the viscosity of spray-dried CNC aqueous suspensions is lower (close
28
to that of water) than that of freeze-dried CNC suspensions. This could favor cavitation,
29
especially in the case of a low ultrasonication power. Finally, based on the conditions used by
30
Peng et al. [70] for spray- and freeze-drying a 2 wt% CNC suspension, we can estimate the
31
energy required to dry 1 g of CNC (and thus remove 49 g of water), neglecting the residual
32
moisture. The average specific heat capacities of cellulose (CpCNC = 1 J.g-1.°C-1 [71]), liquid
1 2 3 4 5 6 7 8 9 10 11 12 13 14 15 16 17 18 19 20 21 22 23 24 25 26 27 28 29 30 31 32 33 34 35 36 37 38 39 40 41 42 43 44 45 46 47 48 49 50 51 52 53 54 55 56 57 58 59 60 61
used to calculate the energy required to bring the suspension temperature from 20 °C to
1
drying temperatures. The water enthalpy of vaporization at 90 °C (outlet temperature in the
2
spray-dryer), Hvap = 2283 J.g-1 [73], that of freezing at 0 °C, Hfre = 335 J.g-1 [74], and that
3
of sublimation at -80 °C (temperature in the freeze dryer), Hsub = 2830 J.g-1 [75] not
4
significantly dependent on the pressure, were taken to determine the energy needed for the
5
water phase transformations. This thermodynamic approach yields energy requirements
6
around 126 and 168 kJ/gCNC (or 2.6 and 3.4 kJ per g of water removed) for spray- and
freeze-7
drying processes, respectively. The ratio of these energy requirements is roughly the same
8
order of magnitude as compared to values taken from examples in the food industry [74]
9
(spray-drying consumes about 3.5 - 5 kJ per g of water removed while freeze-drying
10
consumes more than 6 kJ per g of water removed). If spray-dried CNCs required a little more
11
ultrasonication energy to achieve their dispersion in water, this drying process is clearly less
12
energy consuming, encouraging its development.
13
The decrease of the relative viscosity shown in Figure 9 of CNC suspensions is
14
correlated with the decrease of the particle size observed by DLS (Figure 6) as already
15
reported in the literature [38], but it contradicts theories generally used for electrostatically
16
stabilized colloidal suspensions of rigid particles [32]. It also apparently contradicts the
17
mechanism proposed by Beck et al. [24] based on ejected ions from the bound-water layer
18
(explaining the ionic conductivity increase after ultrasonication), which is supposed to
19
increase the electrostatic double layer thickness. Indeed, in the case of electrostabilized hard
20
spheres, a particle size decrease or a thicker electrostatic layer (for example due to a lower
21
ionic strength) leads to an higher apparent volume occupied by particles and their electrostatic
22
double layer [31], amplifying electroviscous effects [55,76]. Since the same charge density
23
was measured for all suspensions (-potential ~ 48 mV – Supporting Information, Table S1)
24
and the particle size decreased after strong ultrasonication, the reduction of the viscoelastic
25
properties could be related to the ionic strength I, hence, to a thinner electrostatic double layer
26
[41]. In our case, we suggest that these ions were probably trapped with water inside
27
agglomerates before ultrasonication and released after agglomerate break-up. It may reduce
28
the thickness of the electrostatic double layer [49], in agreement with the decrease of []el
29
reported in Table 1, especially as the agglomerate break-up probably increases the CNC
30
aspect ratio and the rigid body contribution []0. In the same way, large porous CNC
31
agglomerates can trap water, which increases the apparent CNC concentration. These
32
arguments could explain the important viscosity increases shown in Figure 9 in the presence
1 2 3 4 5 6 7 8 9 10 11 12 13 14 15 16 17 18 19 20 21 22 23 24 25 26 27 28 29 30 31 32 33 34 35 36 37 38 39 40 41 42 43 44 45 46 47 48 49 50 51 52 53 54 55 56 57 58 59 60
of large agglomerates, in agreement with the drastic cm decreases reported in Table 1. In other
1
words, the ions and water released in water by breaking agglomerates prevent CNC gelation.
2 3 4 5. Conclusion 5 6
The optimal dispersion state attainable for spray-dried cellulose nanocrystals (CNCs) in
7
water is comparable to that of freeze-dried CNCs, (mean hydrodynamic diameter ~ 75 nm). In
8
aqueous suspensions, ultrasonication improves their dispersion state by breaking
9
agglomerates without demonstrably causing desulfation (as many had previously
10
hypothesized). Ultrasonication efficiency, based on cavitation, is strongly dominated by the
11
power level (even more than energy) of the probe, which must be high to favor CNC
12
dispersion. This consideration is often obscured in the literature. Moreover, spray-dried CNCs
13
need more energy than their freeze-dried counterparts to achieve maximum dispersion in
14
water. However, the energy required for the spray-drying process compared to freeze-drying
15
favors the use of spray-dried CNCs. As the dispersion state of CNC is improved, rheological
16
properties show increases of the critical shear-rate (shear rate above which shear-thinning is
17
observed) and the maximum packing concentration until the same limiting values of 25 s-1
18
and 0.11 g.mL-1, respectively, for both well dispersed spray- and freeze-dried CNC
19
suspensions. Agglomerates break-up releases both ions and water in suspensions, preventing
20
gel formation. The relationships between structure and rheology have been demonstrated
21
using the Péclet number and Fedors model, based on intrinsic viscosity and maximum
22
packing concentration, leading to a master curve representation of the various
23
systems/conditions. This study highlights processing considerations for the optimal dispersion
24
and use of spray-dried cellulose nanocrystals, and demonstrates the interest of rheology as a
25
tool to characterize these complex colloidal suspensions.
26 27
6. Acknowledgments
28 29
FPInnovations and CelluForce are acknowledged for providing the freeze-dried and
30
spray-dried CNCs, respectively. We also thank NSERC, PRIMA Québec and FPInnovations
31
for their financial support. The authors are grateful to Dr. Wadood Hamad of FPInnovations
32
for his helpful suggestions. Finally, we would like to mention the help of Mr. Philippe Massé
1 2 3 4 5 6 7 8 9 10 11 12 13 14 15 16 17 18 19 20 21 22 23 24 25 26 27 28 29 30 31 32 33 34 35 36 37 38 39 40 41 42 43 44 45 46 47 48 49 50 51 52 53 54 55 56 57 58 59 60 61
with TEM observations, Prof. Daria Camilla Boffito with ultrasonication and Mr. Valentin
1
Ponce with rheometry.
2 3
7. References
4 5
[1] S.J. Eichhorn, A. Dufresne, M. Aranguren, N.E. Marcovich, J.R. Capadona, S.J.
6
Rowan, C. Weder, W. Thielemans, M. Roman, S. Renneckar, W. Gindl, S. Veigel, J.
7
Keckes, H. Yano, K. Abe, M. Nogi, A.N. Nakagaito, A. Mangalam, J. Simonsen, A.S.
8
Benight, A. Bismarck, L.A. Berglund, T. Peijs, Review: current international research
9
into cellulose nanofibres and nanocomposites, J. Mater. Sci. 45 (2010) 1–33.
10
doi:10.1007/s10853-009-3874-0.
11
[2] G. Siqueira, J. Bras, A. Dufresne, Cellulosic Bionanocomposites: A Review of
12
Preparation, Properties and Applications, Polymers (Basel). 2 (2010) 728–765.
13
doi:10.3390/polym2040728.
14
[3] R.J. Moon, A. Martini, J. Nairn, J. Simonsen, J. Youngblood, Cellulose nanomaterials
15
review: structure, properties and nanocomposites, Chem. Soc. Rev. 40 (2011) 3941.
16
doi:10.1039/c0cs00108b.
17
[4] S. Beck-Candanedo, M. Roman, D.G. Gray, Effect of Reaction Conditions on the
18
Properties and Behavior of Wood Cellulose Nanocrystal Suspensions,
19
Biomacromolecules. 6 (2005) 1048–1054. doi:10.1021/bm049300p.
20
[5] W.Y. Hamad, T.Q. Hu, Structure-process-yield interrelations in nanocrystalline
21
cellulose extraction, Can. J. Chem. Eng. 88 (2010) n/a-n/a. doi:10.1002/cjce.20298.
22
[6] Y. Habibi, L.A. Lucia, O.J. Rojas, Cellulose Nanocrystals: Chemistry, Self-Assembly,
23
and Applications, Chem. Rev. 110 (2010) 3479–3500. doi:10.1021/cr900339w.
24
[7] L. Brinchi, F. Cotana, E. Fortunati, J.M. Kenny, Production of nanocrystalline cellulose
25
from lignocellulosic biomass: Technology and applications, Carbohydr. Polym. 94
26
(2013) 154–169. doi:10.1016/j.carbpol.2013.01.033.
27
[8] J. Bouchard, M. Méthot, C. Fraschini, S. Beck, Effect of oligosaccharide deposition on
28
the surface of cellulose nanocrystals as a function of acid hydrolysis temperature,
29
Cellulose. 23 (2016) 3555–3567. doi:10.1007/s10570-016-1036-5.
30
[9] S. Beck, J. Bouchard, R. Berry, Dispersibility in Water of Dried Nanocrystalline
31
Cellulose, Biomacromolecules. 13 (2012) 1486–1494. doi:10.1021/bm300191k.
32
[10] Long Jiang, E. Morelius, Jinwen Zhang, M. Wolcott, J. Holbery, Study of the
Poly(3-33
hydroxybutyrate-co-3-hydroxyvalerate)/Cellulose Nanowhisker Composites Prepared
1 2 3 4 5 6 7 8 9 10 11 12 13 14 15 16 17 18 19 20 21 22 23 24 25 26 27 28 29 30 31 32 33 34 35 36 37 38 39 40 41 42 43 44 45 46 47 48 49 50 51 52 53 54 55 56 57 58 59 60
by Solution Casting and Melt Processing, J. Compos. Mater. 42 (2008) 2629–2645.
1
doi:10.1177/0021998308096327.
2
[11] D. Bagheriasl, P.J. Carreau, B. Riedl, C. Dubois, W.Y. Hamad, Shear rheology of
3
polylactide (PLA)–cellulose nanocrystal (CNC) nanocomposites, Cellulose. 23 (2016)
4
1885–1897. doi:10.1007/s10570-016-0914-1.
5
[12] K. Ben Azouz, E.C. Ramires, W. Van den Fonteyne, N. El Kissi, A. Dufresne, Simple
6
Method for the Melt Extrusion of a Cellulose Nanocrystal Reinforced Hydrophobic
7
Polymer, ACS Macro Lett. 1 (2012) 236–240. doi:10.1021/mz2001737.
8
[13] V. Khoshkava, M.R. Kamal, Effect of Surface Energy on Dispersion and Mechanical
9
Properties of Polymer/Nanocrystalline Cellulose Nanocomposites, Biomacromolecules.
10
14 (2013) 3155–3163. doi:10.1021/bm400784j.
11
[14] H. Sojoudiasli, M.C. Heuzey, P.J. Carreau, Mechanical and morphological properties
12
of cellulose nanocrystal (CNC)-polypropylene composites, Polym. Compos. (2016) 1–
13
9.
14
[15] S. Beck, J. Bouchard, Effect of storage conditions on cellulose nanocrystal stability,
15
Tappi J. 13 (2014) 9–17.
16
[16] M.I. Voronova, A.G. Zakharov, O.Y. Kuznetsov, O. V Surov, The effect of drying
17
technique of nanocellulose dispersions on properties of dried materials, Mater. Lett. 68
18
(2012) 164–167. doi:10.1016/j.matlet.2011.09.115.
19
[17] J. Han, C. Zhou, Y. Wu, F. Liu, Q. Wu, Self-Assembling Behavior of Cellulose
20
Nanoparticles during Freeze-Drying: Effect of Suspension Concentration, Particle Size,
21
Crystal Structure, and Surface Charge, Biomacromolecules. 14 (2013) 1529–1540.
22
doi:10.1021/bm4001734.
23
[18] A. Dufresne, Nanocellulose: a new ageless bionanomaterial, Mater. Today. 16 (2013)
24
220–227. doi:10.1016/j.mattod.2013.06.004.
25
[19] T. Javanbakht, W. Raphael, J.R. Tavares, Physicochemical properties of cellulose
26
nanocrystals treated by photo-initiated chemical vapour deposition (PICVD), Can. J.
27
Chem. Eng. 94 (2016) 1135–1139. doi:10.1002/cjce.22473.
28
[20] Peng Y., Yousoo H., Gardner J.D., Y. Peng, H. Yousoo, D.J. Gardner, Spray-drying
29
cellulose nanofibrils: effect of drying process parameters on particle morphology and
30
size distribution, Wood Fiber Sci. 44 (2012) 1–14.
31
[21] V. Khoshkava, M.R.R. Kamal, Effect of drying conditions on cellulose nanocrystal
32
(CNC) agglomerate porosity and dispersibility in polymer nanocomposites, Powder
33
1 2 3 4 5 6 7 8 9 10 11 12 13 14 15 16 17 18 19 20 21 22 23 24 25 26 27 28 29 30 31 32 33 34 35 36 37 38 39 40 41 42 43 44 45 46 47 48 49 50 51 52 53 54 55 56 57 58 59 60 61
[22] P. Lu, Y.-L. Hsieh, Preparation and properties of cellulose nanocrystals: Rods, spheres,
1
and network, Carbohydr. Polym. 82 (2010) 329–336.
2
doi:10.1016/j.carbpol.2010.04.073.
3
[23] B.E.E. Noltingk, E.. A. Neppiras, Cavitation produced by Ultrasonics, Proc. Phys. Soc.
4
Sect. B. 63 (1950) 674–685. doi:10.1088/0370-1301/63/9/305.
5
[24] S. Beck, J. Bouchard, R. Berry, Controlling the Reflection Wavelength of Iridescent
6
Solid Films of Nanocrystalline Cellulose, Biomacromolecules. 12 (2011) 167–172.
7
doi:10.1021/bm1010905.
8
[25] Z. Lu, L. Fan, H. Zheng, Q. Lu, Y. Liao, B. Huang, Preparation, characterization and
9
optimization of nanocellulose whiskers by simultaneously ultrasonic wave and
10
microwave assisted, Bioresour. Technol. 146 (2013) 82–88.
11
doi:10.1016/j.biortech.2013.07.047.
12
[26] Y. Cao, P. Zavattieri, J. Youngblood, R. Moon, J. Weiss, The relationship between
13
cellulose nanocrystal dispersion and strength, Constr. Build. Mater. 119 (2016) 71–79.
14
doi:10.1016/j.conbuildmat.2016.03.077.
15
[27] X.M. Dong, J.-F. Revol, D.G. Gray, Effect of microcrystallite preparation conditions
16
on the formation of colloid crystals of cellulose, Cellulose. 5 (1998) 19–32.
17
doi:10.1023/A:1009260511939.
18
[28] S. Sumari, A. Roesyadi, S. Sumarno, Effects of ultrasound on the morphology, particle
19
size, crystallinity, and crystallite size of cellulose, Sci. Study Res. Chem. Chem. Eng.
20
Biotechnol. Food Ind. 14 (2013) 229–239.
21
[29] E. Csiszar, P. Kalic, A. Kobol, E.D.P. Ferreira, The effect of low frequency ultrasound
22
on the production and properties of nanocrystalline cellulose suspensions and films,
23
Ultrason. Sonochem. 31 (2016) 473–480. doi:10.1016/j.ultsonch.2016.01.028.
24
[30] S. Shafiei-Sabet, W.Y. Hamad, S.G. Hatzikiriakos, Rheology of Nanocrystalline
25
Cellulose Aqueous Suspensions, Langmuir. 28 (2012) 17124–17133.
26
doi:10.1021/la303380v.
27
[31] F.M. Horn, W. Richtering, J. Bergenholtz, N. Willenbacher, N.J. Wagner,
28
Hydrodynamic and Colloidal Interactions in Concentrated Charge-Stabilized Polymer
29
Dispersions, J. Colloid Interface Sci. 225 (2000) 166–178. doi:10.1006/jcis.1999.6705.
30
[32] J. Mewis, N.J. Wagner, Introduction to colloid science and rheology, in: Colloid.
31
Suspens. Rheol., Cambridge University Press, Cambridge, 2011: pp. 1–35.
32
doi:10.1017/CBO9780511977978.004.
33
[33] M.M. de Souza Lima, R. Borsali, Rodlike Cellulose Microcrystals: Structure,
1 2 3 4 5 6 7 8 9 10 11 12 13 14 15 16 17 18 19 20 21 22 23 24 25 26 27 28 29 30 31 32 33 34 35 36 37 38 39 40 41 42 43 44 45 46 47 48 49 50 51 52 53 54 55 56 57 58 59 60
Properties, and Applications, Macromol. Rapid Commun. 25 (2004) 771–787.
1
doi:10.1002/marc.200300268.
2
[34] S.-L. Tseng, A. Valente, D.G. Gray, Cholesteric liquid crystalline phases based on
3
(acetoxypropyl)cellulose, Macromolecules. 14 (1981) 715–719.
4
doi:10.1021/ma50004a049.
5
[35] J.P.F. Lagerwall, C. Schütz, M. Salajkova, J. Noh, J. Hyun Park, G. Scalia, L.
6
Bergström, Cellulose nanocrystal-based materials: from liquid crystal self-assembly
7
and glass formation to multifunctional thin films, NPG Asia Mater. 6 (2014) e80.
8
doi:10.1038/am.2013.69.
9
[36] M. Bercea, P. Navard, Shear Dynamics of Aqueous Suspensions of Cellulose
10
Whiskers, Macromolecules. 33 (2000) 6011–6016. doi:10.1021/ma000417p.
11
[37] J. Araki, M. Wada, S. Kuga, T. Okano, Influence of surface charge on viscosity
12
behavior of cellulose microcrystal suspension, J. Wood Sci. 45 (1999) 258–261.
13
doi:10.1007/BF01177736.
14
[38] S. Shafeiei-Sabet, W.Y. Hamad, S.G. Hatzikiriakos, S. Shafiei-Sabet, W.Y. Hamad,
15
S.G. Hatzikiriakos, S. Shafeiei-Sabet, W.Y. Hamad, S.G. Hatzikiriakos, S.
Shafiei-16
Sabet, W.Y. Hamad, S.G. Hatzikiriakos, Influence of degree of sulfation on the
17
rheology of cellulose nanocrystal suspensions, Rheol. Acta. 52 (2013) 741–751.
18
doi:10.1007/s00397-013-0722-6.
19
[39] K.J. Le Goff, C. Gaillard, C. Garnier, T. Aubry, Electrostatically driven modulation of
20
the reinforcement of agarose hydrogels by cellulose nanowhiskers, J. Appl. Polym. Sci.
21
133 (2016) n/a-n/a. doi:10.1002/app.43063.
22
[40] Y. Boluk, R. Lahiji, L. Zhao, M.T. McDermott, Suspension viscosities and shape
23
parameter of cellulose nanocrystals (CNC), Colloids Surfaces A Physicochem. Eng.
24
Asp. 377 (2011) 297–303. doi:10.1016/j.colsurfa.2011.01.003.
25
[41] S. Beck, J. Bouchard, Ionic strength control of sulfated cellulose nanocrystal
26
suspension viscosity, Tappi J. 15 (2016) 363–372.
27
[42] G. Lenfant, M.-C.C. Heuzey, T.G.M. van de Ven, P.J. Carreau, A comparative study of
28
ECNC and CNC suspensions: effect of salt on rheological properties, Rheol. Acta. 56
29
(2017) 51–62. doi:10.1007/s00397-016-0979-7.
30
[43] E.E. Ureña-Benavides, G. Ao, V.A. Davis, C.L. Kitchens, Rheology and Phase
31
Behavior of Lyotropic Cellulose Nanocrystal Suspensions, Macromolecules. 44 (2011)
32
8990–8998. doi:10.1021/ma201649f.
33