Development Of Sustained Release Tablets Containing Solid Dispersions Of Baclofen
22
0
0
Texte intégral
(2) K. H. Janardhana et al.. J. Fundam Appl Sci. 2013, 5(2), 220-239. 221. 1. INTRODUCTION One of the most promising methods of promoting the dissolution of poorly water-soluble drugs is the delivery of a solid dispersion via an efficient carrier. Polyethylene glycol, poloxamer are most widely used solid dispersion carriers because of their strong hydrophilic properties and ability to form molecular adducts with many compounds1. Sustained release (SR) systems are known to maintain therapeutically effective concentrations of drugs with short elimination half-lives in circulation over an extended period. The SR dosage forms that release drugs pH independently in the gastrointestinal tract are preferred to avoid numerous biopharmaceutical variables and to reduce intra and inter individual variations in bioavailability. Moreover, SR dosage forms containing poorly water-soluble drugs require both solubilization and release-modulation for therapeutic efficacy2,3. Solid dispersion technology is the science of dispersing one or more active ingredients in an inert matrix in the solid stage in order to achieve increased dissolution rate, sustained release of drugs, altered solid state properties, enhanced release of drugs from ointment and suppository bases, and improved solubility and stability4. Sustained release dosage forms containing solid dispersion granules (SD-SR) are an attractive pharmaceutical approach to improve the dissolution rate of poorly water-soluble drugs and drugs with short elimination half life5. Baclofen is an oral and injectable medication that relaxes skeletal muscles, the muscles that move the skeleton (and also called striated muscle)6. Chemically, baclofen is related to gammaaminobutyric acid (GABA), a naturally-occurring neurotransmitter in the brain. Neurotransmitters are chemicals that nerves use to communicate with one another. GABA released by some nerves causes the activity of other nerves to decrease. Baclofen blocks the activity of nerves within the part of the brain that controls the contraction and relaxation of skeletal muscle. It is used for treating spasm of skeletal muscles, muscle clonus, rigidity, and pain caused by disorders such as multiple sclerosis7,8. It is also injected into the spinal cord (intrathecal) for management of severe spasticity. The present study was aimed to prepare free-flowing SD granules using polymers like PEG 6000, Poloxamer 188 along with an adsorbent and then obtain a SD-SR tablet for release of a poorly water-soluble drug. The SDSR tablet was prepared via direct compression of SD granules..
(3) K. H. Janardhana et al.. J. Fundam Appl Sci. 2013, 5(2), 220-239. 222. 2. MATERIALS AND METHODS 2.1. Materials Baclofen was purchased from Medilux laboratories Pvt. Ltd, New Delhi. Carbopol 934, PEG 6000, Poloxamer 188, Potassium Dihydrogen Phosphate, Sodium Hydroxide Pellets, HPMC K 4 M was obtained from Yarrow Chem Products, Mumbai. Calcium phosphate dibasic was obtained from Himedia laboratories Pvt. Ltd, Mumbai. HPMC K 100 was obtained from Rolex Laboratory, Mumbai. Hydrochloric Acid was obtained from RFCL Limited, New Delhi. All other chemicals used were of analytical grade. 2.2.Preparation of SD granules The solid dispersion granules were prepared by hot melt method. In this study poloxamer 188 was used as a carrier and carbopol 934 was used as an adsorbent. Poloxamer 188 was melted in a beaker using a water bath and baclofen was added slowly with stirring to obtain a homogenous mixture. Carbopol 934 was added gradually to the molten mixture with continuous stirring. The dispersion was cooled in deep freezer at -200C which was followed by passing through a sieve 400µ m in diameter. The weight ratio of drug and carrier were between 1:1 to 1:2, whereas the ratio of drug and adsorbent was between 1:0.5 to 1:1. A physical mixture was obtained by mixing drug, carrier and adsorbent by using spatula. 2.3.Fourier Transform Infrared spectroscopic studies The FTIR spectra of pure baclofen, carbapol934, poloxamer 188, PEG 6000, solid dispersion products, physical mixture of polymers and drug were studied. A small amount of drug was mixed with the spectroscopic grade of KBr and triturated for uniform mixing. The prepared mixture is filled in a palate and was exposed to the IR beam and spectra were recorded in the range of 4004000cm-1 by using FTIR spectrophotometer (FTIR 8400 Shimadzu, Japan). 2.4.Differential scanning calorimetric analysis 2mg of sample was placed in a 50 µL perforated aluminium pan and sealed. Heat runs for each sample were set from 50C to 3000C using nitrogen as purging gas and the samples were analyzed. Thermograms of the samples (Baclofen, Poloxamer 188, PEG 6000, Carbopol 934, solid dispersion product of baclofen with poloxamer 188 and solid dispersion product of baclofen with PEG 6000) were recorded. 2.5. X-Ray Diffraction Analysis.
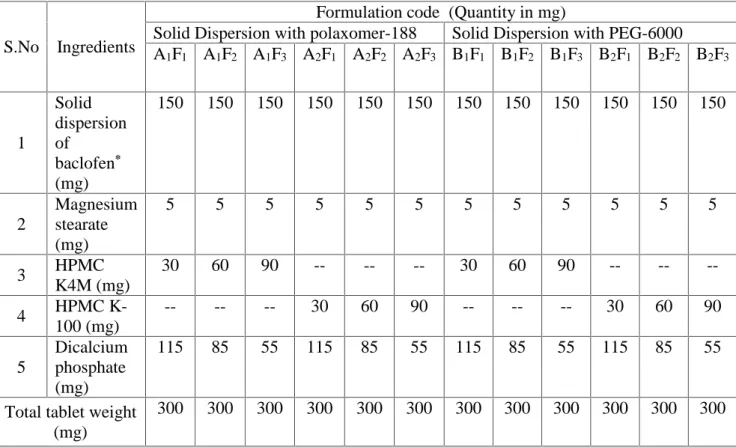
(4) K. H. Janardhana et al.. J. Fundam Appl Sci. 2013, 5(2), 220-239. 223. The powder X-RD patterns of drug, β-Cyclodextrin, and complexes were recorded by using Philips Holland -PW 1710 scanner with filter Cu radiation over the interval 5-60°/2θ. The operation data were as follows: voltage 35 kV, current 20 mA, filter Cu and scanning speed 1°/min. 2.6.Micromeritic properties of SD granules Carr’s compressibility index, Bulk density, Angle of repose and Hausner’s ratio were determined as per Indian Pharmacopoeia9. 2.7. Tablet preparation containing SD granules Sustained release tablets containing solid dispersions of baclofen equivalent to 50mg was prepared via direct compression. Solid dispersion granules were mixed with varying amounts of HPMC K4M and HPMC K100 as sustaining agent. Dicalcium phosphate is used as tableting agent, and magnesium stearate as a lubricant. A homogenous blend was passed through a 250µm sieve and then directly compressed into tablets using 8 mm punch in a single rotary tablet press (Rimek RSB4 minipress, Cadmach). The formula for the tablets are shown in table 1..
(5) K. H. Janardhana et al.. J. Fundam Appl Sci. 2013, 5(2), 220-239. 224. Table 1. Formulation of Baclofen sustained release tablets containing solid dispersion granules * Amount of baclofen in solid dispersion is 50mg Pre and Post compression parameters. S.No. Ingredients. Solid dispersion 1 of baclofen* (mg) Magnesium 2 stearate (mg) HPMC 3 K4M (mg) HPMC K4 100 (mg) Dicalcium 5 phosphate (mg) Total tablet weight (mg). Formulation code (Quantity in mg) Solid Dispersion with polaxomer-188 Solid Dispersion with PEG-6000 A1F1 A1F2 A1F3 A2F1 A2F2 A2F3 B1F1 B1F2 B1F3 B2F1 B2F2 B2F3 150. 150. 150. 150. 150. 150. 150. 150. 150. 150. 150. 150. 5. 5. 5. 5. 5. 5. 5. 5. 5. 5. 5. 5. 30. 60. 90. --. --. --. 30. 60. 90. --. --. --. --. --. --. 30. 60. 90. --. --. --. 30. 60. 90. 115. 85. 55. 115. 85. 55. 115. 85. 55. 115. 85. 55. 300. 300. 300. 300. 300. 300. 300. 300. 300. 300. 300. 300. Pre compression parameters such as bulk density, tap density, Hausner’s ratio and Carr’s index were determined; Post compression parameters such as weight variation test, hardness, thickness and friability were calculated. 2.8 Drug content estimation Ten tablets of each formulation were weighed, triturated and powdered. Powder triturate equivalent to average weight of tablet was weighed and transferred to 50ml volumetric flask, Initially about 25ml of 0.1N HCl was added and the flask was shaken thoroughly and the volume was made up to 50 ml with 0.1N HCl. From the resulting solution 5ml was pipetted, diluted to 100ml with 0.1N HCl. From the above solution, 3ml was pipetted, diluted to 25ml with 0.1N HCl and drug content was estimated at 220nm using UV spectrophotometer against 0.1N HCl as blank10. 2.9. In-vitro drug release studies.
(6) K. H. Janardhana et al.. J. Fundam Appl Sci. 2013, 5(2), 220-239. 225. Drug release studies were carried out using USP XXIII dissolution test apparatus, rotating paddle method (Lab India, Mumbai, India). The study was conducted at 37±0.5oC and 50 rpm using 900 ml of 1.2 pH buffer for 2 hr. followed by 6.8 pH buffer until completion of the studies. Samples (2ml) were withdrawn from the dissolution apparatus at regular pre-determined time intervals and fresh medium was replaced in order to maintain sink condition. The withdrawn samples were diluted suitably and drug content was measured spectrophotometrically at 220nm, using 0.1N Hcl as blank and percentage drug release was calculated from the standard calibration curve. 2.10. In-vitro drug release mechanism The dissolution data of all formulations were fitted to zero-order, first-order, Hixson-Crowell, Higuchi and Korsemeyer and Peppas models to predict the drug release mechanism11. 2.11. Stability study Based on the ICH guidelines 12, the stability studies were carried out in an environmental chamber (Dempo Instruments, India). The optimized microspheres formulation were stored at 25 ± 2˚C and 60% ± 5% RH for a period of 12 months and at 40 ± 2˚C and 75% ± 5% RH for a period of 6 months. At intervals of 0, 2, 4 and 6 months for accelerated storage condition and at 3 month interval during 12 months, for long-term storage condition, the samples were tested for changes in physical appearance and drug content.. 3. RESULTS AND DISCUSSION The solid dispersions of baclofen were prepared by hot melt method with varying concentrations of carriers such as PEG 6000, Poloxamer 188 and Carbopol 934 as adsorbent. Baclofen sustained release tablets containing solid dispersion granules were prepared by direct compression method. In the present study 12 formulations with varying concentrations of HPMC K4M and HPMC K100M as sustaining agents were prepared; each tablet weighing 300mg and containing 50mg of baclofen. Baclofen was found to be linear in the range of 2-12µg/ml with a regression value of 0.9973 in 0.1N HCl and thus considered as the Beer’s range. The calculations of in-vitro drug release, drug content and stability studies are based on the calibration curve. The melting point of baclofen was determined by capillary method and was found to be 2080C. It complies with IP standards thus indicating the purity of the drug sample..
(7) K. H. Janardhana et al.. J. Fundam Appl Sci. 2013, 5(2), 220-239. 226. 3.1. FTIR studies The IR spectrum of pure drug, carrier, adsorbent and physical mixture of drug and carriers were studied. FTIR technique has been used here to study the physical and chemical interaction between drug and excipients used. The IR spectra of baclofen showed the characteristic absorption bands for C-Cl stretch at 831.26 cm-1, C-O stretch at 1244.00 cm-1, O-H bending at 1394.44 cm-1, aromatic C-C strech at 1515.94 cm-1 and aromatic C-H stretch at 3049.25 cm-1 figure-1a. The IR spectra of carbopol 934P showed the characteristic absorption bands for C=O carboxylate stretch at 1728.10 cm-1, C-H alkane stretch at 2929.67 cm-1, C-O stretch at 1224.71 cm-1, O-H stretch at 3280.69 cm1. figure-1b. The IR spectra of PEG 6000 demonstrated the characteristic absorption bands for O-H. stretch at 3600.85 cm-1, C-H alkane stretch at 2935.46 cm-1, C-O-C ether stretch at 1139.85 cm-1 figure-1c. The IR spectra of poloxamer 188 demonstrated the characteristic absorption bands for O-H stretch at 3637.50 cm-1, C-H alkane stretch at 2873.74 cm-1, C-O-C ether stretch at 1137.92 cm-1 figure-1d. The IR spectra of physical mixtures of baclofen with PEG 6000 demonstrated the characteristic absorption bands for aromatic C-C stretch at 1502.44 cm-1, aromatic C-H stretch at 3055.03 cm-1, C-Cl stretch at 844.76 cm-1, C-O stretch at 1238.21 cm-1, O-H bending at 1390.58 cm-1, C-H alkane stretch at 2972.10 cm-1, C-O-C ether stretch at 1124.82 cm-1 figure-1e. The IR spectra of physical mixtures of baclofen with poloxamer 188 demonstrated the characteristic absorption bands for C-Cl stretch at 734.83 cm-1, aromatic C-H stretch at 3047.32 cm-1, C-O stretch at 1236.29 cm-1, O-H stretch at 3639.43 cm-1, C-H alkane stretch at 2887.24 cm-1 figure-1f. The IR spectra of solid dispersion of baclofen with PEG 6000 has showed the characteristic absorption bands for C-Cl stretch at 804.26 cm-1, aromatic C-C stretch at 1502.44 cm-1, aromatic C-H stretch at 3047.90 cm-1, C-O stretch at 1236.29 cm-1, O-H bending at 1448.44 cm-1 figure-1g. The IR spectra of solid dispersion of baclofen with poloxamer 188 showed that the characteristic absorption bands for C-Cl stretch at 833.19 cm-1, aromatic C-C stretch at 1531.37 cm-1, aromatic C-H stretch at 3045.39 cm-1, C-O stretch at 1242.07 cm-1, O-H bending at 1396.07 cm-1 figure-1h. The IR spectra of solid dispersion of baclofen with PEG 6000 and HPMC K4M showed the characteristic absorption bands for C-Cl stretch at 831.26 cm-1, aromatic C-C stretch at 1521.73 cm-1, aromatic C-H stretch at 3068.53 cm-1, C-O stretch at 1240.14 cm-1, O-H bending at 1394.44 cm-1 figure-1i. The spectra of solid dispersion of baclofen with PEG 6000 and HPMC K100 showed the characteristic absorption bands for C-Cl stretch at 833.19 cm-1, aromatic C-C stretch at 1539.09.
(8) K. H. Janardhana et al.. J. Fundam Appl Sci. 2013, 5(2), 220-239. 227. cm-1, aromatic C-H stretch at 3085.89 cm-1, C-O stretch at 1245.93 cm-1, O-H bending at 1396.37 cm-1 figure-1j. The IR spectra of solid dispersion of baclofen with poloxamer 188 and HPMC K4M has demonstrated the characteristic absorption bands for C-Cl stretch at 811.98 cm-1, aromatic CC stretch at 1502.44 cm-1, aromatic C-H stretch at 3093.61 cm-1, C-O stretch at 1232.43 cm-1, O-H bending at 1448.44 cm-1 figure-1k. The IR spectra of solid dispersion of baclofen with poloxamer 188 and HPMC K100 has demonstrated the characteristic absorption bands for C-Cl stretch at 810.05 cm-1, aromatic C-C stretch at 1448.44 cm-1, aromatic C-H stretch at 3056.96 cm-1, C-O stretch at 1261.36 cm-1, O-H bending at 1413.72 cm-1 figure-1l. From the above studies it can be concluded that the peaks obtained in the spectra of each sample correlates with the peaks of drug spectrum. Therefore, it has been observed that the absence of chemical and physical interaction between baclofen and the carriers used..
(9) K. H. Janardhana et al.. J. Fundam Appl Sci. 2013, 5(2), 220-239. 228. Fig.1. FT-IR spectra of: 1a – Baclofen, 1b - Carbopol 934P, 1c - PEG 6000, 1d - Poloxamer 188, 1e - Physical mixtures of baclofen with PEG 6000, 1f - Physical mixtures of baclofen with.
(10) K. H. Janardhana et al.. J. Fundam Appl Sci. 2013, 5(2), 220-239. 229. poloxamer 188, 1g - Solid dispersion of baclofen with PEG 6000, 1h - Solid dispersion of baclofen with poloxamer 188, 1i - Solid dispersion of baclofen with PEG 6000 and HPMC K4M, 1j - Solid dispersion of baclofen with PEG 6000 and HPMC K100, 1k - Solid dispersion of baclofen with poloxamer 188 and HPMC K4M, 1l - Solid dispersion of baclofen with poloxamer 188 and HPMC K100. 3.2. Differential scanning calorimetry studies The DSC analysis of pure drug, polymers and the physical mixture were carried out to evaluate possibility of interaction between drug and polymer. The DSC thermogram of pure drug baclofen showed a characteristic endothermic peak at 214.160C as in figure 2a which corresponds to the melting point of baclofen. The DSC thermogram of PEG 6000 showed a characteristic endothermic peak at 65.750C as in figure 2b and thermogram of poloxamer 188 showed a sharp endothermic peak 55.560C (figure 2c) that corresponds to their respective melting points. The thermogram of carbolpol 934P showed a characteristic endothermic peak at 230.700C (figure 2d). Similar endothermic peaks at 206.740C and 207.800C (figures-2e, 2f) were observed in the solid dispersions samples. It was observed that there was a slight variation in the melting point in the solid dispersion product as evident from figure 2e and 2f. The observed peaks were not sharp and it forms a blant curve type of peak. This could be attributed to the conversion of amorphous form of drug from its original crystalline state. This proved the formation of amorphous solid dispersion product and this study confirmed that there was no interaction between the drug and the polymer..
(11) K. H. Janardhana et al.. J. Fundam Appl Sci. 2013, 5(2), 220-239. 230. Fig. 2. DSC thermograms of : 2a-Baclofen, 2b- PEG 6000, 2c- Poloxamer 188, 2d- Carbolpol 934P, 2e- Solid dispersion of baclofen with PEG 6000, 2f- Solid dispersion of baclofen with poloxamer 188..
(12) K. H. Janardhana et al.. J. Fundam Appl Sci. 2013, 5(2), 220-239. 231. 3.3. XRD studies The XRD results were in good agreement with the thermal analysis data. X-ray diffraction patterns in figure 3a revealed that pure baclofen was clearly in crystalline state as it showed sharp distinct peaks notably at 2θ diffraction angles of 17.5°, 18°, 19°, 21.5°, 23°, 23.5°, 25°, 26°, 28°, 29°, 31° and 39°. PEG 6000 was in crystalline state as it showed sharp distinct peaks at 2θ diffraction angles of 19° and 23.5° as shown in figure 3b. The X-ray diffraction patterns of carbopol 934P shown in figure 3c did not show any characteristic peaks, indicating that it is amorphous in nature. The Xray diffraction patterns of Poloxamer 188 shown in figure 3d showed sharp distinct peaks notably at 2θ diffraction angles of 19°, 23.5° indicating that it is crystalline in nature. X-ray diffraction patterns of solid dispersions prepared with PEG 6000 and Poloxamer 188 as shown in figures 3e and 3f showed decreased intensity of peaks. The XRD pattern of solid dispersion of baclofen prepared with Poloxamer 188 and PEG 6000 showed diffraction angles similar to that of pure baclofen but the intensity of crystallinity was reduced as evidenced from the peaks. This reduced intensity could be due to the conversion of drug into amorphous form partially and there by this XRD results indicated the absence of significant interactions between drug excipients in the preparation of SD granules..
(13) K. H. Janardhana et al.. J. Fundam Appl Sci. 2013, 5(2), 220-239. 232. Fig.3. X-ray diffractograms of: 3a-Baclofen, 3b- PEG 6000, 3c- Carbolpol 934P, 3d- Poloxamer 188, 3e- Solid dispersion of baclofen with PEG 6000, 3f- Solid dispersion of baclofen with poloxamer 188.
(14) K. H. Janardhana et al.. J. Fundam Appl Sci. 2013, 5(2), 220-239. 233. 3.4. Formulation and evaluation of SR tablets containing solid dispersions. Based on the preliminary trials two formulations of solid dispersions were selected for formulation of sustained release tablets based on their increased solubility and dissolution. These solid dispersions were converted into sustained release tablets by direct compression method using HPMC K4M and HPMC K100 as release retarding agents. Dicalcium phosphate used as diluent and magnesium stearate was selected as lubricant, carbopol 934P is used as adsorbent, PEG 6000 and Poloxamer 188 are used to enhance the dissolution properties of poorly soluble compound like baclofen by formulating solid dispersion. 3.5. Pre-compression parameters Flow properties The pre-compression parameters for the all 12 formulations were carried out and the results were shown in the table-2. The bulk density of all 12 formulations ranged between 0.513 to 0.652g/ml and tapped density ranged from 0.605 to 0.835g/ml. Hausner’s ratio with values less than 1.35 indicates good flow property. All the formulations showed values less than 1.35 thereby confirming the free flowing nature of the prepared granules. The Carr’s index value was between the range 8 to 26% which confirmed that all 12 formulations showing excellent flow properties and good compressibility..
(15) K. H. Janardhana et al.. J. Fundam Appl Sci. 2013, 5(2), 220-239. 234. Table 2. Pre-compression parameters of prepared SR solid dispersion granules Formulation. Bulk density*. Tapped density*. code. (g/ml). (g/ml). A1F1. 0.652±0.0015. 0.835±0.0030. 1.275±0.0030. 21.65±0.03. A1F2. 0.600±0.0010. 0.806±0.0020. 1.335±0.0025. 25.18±0.06. A1F3. 0.599±0.0010. 0.775±0.0020. 1.353±0.0200. 23.36±0.04. A2F1. 0.583±0.0015. 0.675±0.0020. 1.155±0.0025. 13.46±0.04. A2F2. 0.572±0.0015. 0.686±0.0020. 1.194±0.0030. 16.17±0.06. A2F3. 0.553±0.0015. 0.605±0.0020. 1.095±0.0025. 8.38±0.04. B1F1. 0.582±0.0015. 0.705±0.0025. 1.23±0.0200. 17.18±0.04. B1F2. 0.513±0.0015. 0.627±0.0020. 1.215±0.0025. 17.74±0.04. B1F3. 0.516±0.0010. 0.656±0.0030. 1.274±0.0030. 21.57±0.04. B2F1. 0.584±0.0015. 0.735±0.0030. 1.255±0.0020. 20.55±0.04. B2F2. 0.544±0.0015. 0.704±0.0030. 1.296±0.0025. 22.85±0.04. B2F3. 0.513±0.0005. 0.625±0.0020. 1.215±0.0025. 17.79±0.05. Hausner’s ratio*. Carr’s index* (%). *Average of three determinations 3.6. Post-compression parameters Weight variation test The weights of all tablet formulations ranged between 300 to 301mg (Table-3). As the weight of tablets was 300mg, the acceptable weight variation range was between 285 to 315mg (±5%). It was observed that all the tablet formulations were within the pharmacopoeial limits. Hardness The hardness of all formulations was determined and the results were shown in the table-3. The values of hardness were found to be in the range of 4.66 to 5.6kg/cm2. Friability The percentage friability of all the formulations was found to be not more than 0.7%, which is well within the limit of <1%. The results of friability indicated that the tablets were mechanically stable..
(16) K. H. Janardhana et al.. J. Fundam Appl Sci. 2013, 5(2), 220-239. 235. Thickness The mean thickness of the SR tablets was determined and the values were found to be in the range of 4 to 4.17mm. Table 3. Post compression parameters for prepared tablets. Formulation code. Weight variation* (mg). Friability*. Hardness*. Thickness*. Percentage. (%). (kg/cm2). (mm). drug content*. A1F1. 300.5±3.94. 0.663±0.0041. 5.4±0.15. 4.13±0.025. 98.18±0.98. A1F2. 301±3.07. 0.664±0.0045. 5.53±0.15. 4.17±0.025. 98.90±0.45. A1F3. 301±5.52. 0.335±0.0045. 5.13±0.15. 4.08±0.076. 97.58±0.09. A2F1. 300±3.24. 0.338±0.0050. 4.9±0.2. 4.01±0.032. 98.11±0.40. A2F2. 300.5±3.94. 0.336±0.0060. 5.6±0.3. 4.07±0.037. 99.42±0.92. A2F3. 301±3.07. 0.337±0.0055. 4.7±0.25. 4.05±0.07. 96.79±0.34. B1F1. 300.5±3.94. 0.172±0.0060. 5.26±0.37. 4.06±0.030. 99.09±1.39. B1F2. 300.5±2.23. 0.337±0.0050. 5.5±0.26. 4.05±0.05. 99.04±1.03. B1F3. 300.5±3.94. 0.172±0.0060. 4.7±0.2. 4.03±0.05. 97.75±0.55. B2F1. 300.5±2.32. 0.172±0.0060. 4.76±0.25. 4.04±0.05. 98.03±0.55. B2F2. 300.5±3.94. 0.172±0.0060. 5.53±0.25. 4.06±0.06. 98.5±0.7. B2F3. 300.5±2.23. 0.172±0.0060. 4.66±0.15. 4.15±0.05. 98.75±0.88. *Average of three determinations.
(17) K. H. Janardhana et al.. J. Fundam Appl Sci. 2013, 5(2), 220-239. 236. 3.7. Drug content estimation The drug content uniformity was performed for all the formulations and the results were shown in Table-3. The uniformity of drug distribution within the batch tablets was confirmed by the assay values of 96.7 to 99.4 % for all the formulations. In-vitro drug release studies In-vitro dissolution studies were performed for all the formulated tablets using USP dissolution test apparatus Type II employing rotating paddle method at 50 rpm using 900 ml of pH 1.2 solution for first two hours and pH 6.8 phosphate buffer for next hours until 100% drug release and the temperature of dissolution medium was maintained at 37±0.5°C. The results of in-vitro drug release profiles are shown in figure 4-7. Solid dispersions of baclofen with Poloxamer 188 in the ratio 1:1 released drug completely within 30 min where as solid dispersions in the ratio 1:0.5 showed complete drug release at the end of 45 min and ratio 1:2 showed complete drug release at the end of 40 min. The solid dispersions of baclofen with PEG 6000 in the ratio 1:1 released drug completely within 30 min where as solid dispersions in the ratio 1:0.5 showed complete drug release at the end of 50 min and ratio 1:2 showed complete drug release at the end of 35 min. Dissolution studies of the solid dispersion granules in the weight ratio of drug, carrier and adsorbent( 1 : 1 : 1 ) showed 100% drug release within 30 minutes where as the other ratios of drug, carrier and adsorbent took more than 40 minutes for 100% drug release. The solid dispersion granules composed of baclofen with Poloxamer 188 and baclofen with PEG 6000 showed improved drug dissolution. The hydrophilic properties of the carriers probably led to the improved dissolution by increased wetting and reduced interfacial tension between drug and the dissolution medium. Therefore dissolution enhancement is a function of solid dispersion. Formulation B1F1 showed complete drug release within 7 hours, formulations A1F3, B1F2, B1F3, B2F1 showed complete drug release within 8 hours, formulations A1F1, A1F2, A2F3, B2F3 showed complete drug release within 9 hours, whereas other formulations A2F1, A2F2, B2F2 exhibited release up to 10 hours. The studies indicated the drug release retarding efficiency with the polymer concentration of the formulations..
(18) K. H. Janardhana et al.. J. Fundam Appl Sci. 2013, 5(2), 220-239. 237. % DRUG RELEASE. 120 100 80 60. A1F1. 40. A1F2. 20. A1F3. 0. 0. 2. 4. 6. 8. 10. TIME (hrs). Fig.4. In-Vitro drug release profile of formulations A1F1 to A1F3. % DRUG RELEASE. 120 100 80 60. A2F1. 40. A2F2 A2F3. 20 0. 0. 2. 4. 6. 8. 10. 12. TIME (hrs). Fig.5. In-Vitro drug release profile of formulations A2F1 to A2F3.
(19) K. H. Janardhana et al.. J. Fundam Appl Sci. 2013, 5(2), 220-239. 238. % DRUG RELEASE. 120 100 80 60. B1F1. 40. B1F2. 20. B1F3. 0. 0. 2. 4. 6. 8. 10. TIME (hrs). Fig.6. In-Vitro drug release profile of formulations B1F1 to B1F3. % DRUG RELEASE. 120 100 80 60. B2F1. 40. B2F2 B2F3. 20 0. 0. 5. 10. 15. TIME (hrs). Fig.7. In-Vitro drug release profile of formulations B2F1 to B2F3 In-vitro drug release mechanism The drug release studies were fitted to various kinetic models like zero-order, First order, Higuchi, Korsemeyer Peppas and Hixon-Crowell model using PCP Disso V3 to predict the drug release mechanism. Models with highest correlation coefficient were judged to be most appropriate model for dissolution data. The drug release data when fitted into various kinetic equations, showed zero-order release pattern for all formulations except A1F3.
(20) K. H. Janardhana et al.. J. Fundam Appl Sci. 2013, 5(2), 220-239. 239. showed hixon-Crowell with R value of 0.889, B1F1 showed first order release with R value of 0.799 respectively. The drug release kinetics of all the formulations was shown in table 4. Table 4. Data for in-vitro drug release kinetics of the prepared sustained release tablet formulations. Formulation. Zero order. First order. R. R. code. K. K. Matrix R. K. Hixon Crowell R. K. Korsemeyer-Peppas R. K. n. A1F1. 0.863. 6.959 0.838 0.105 0.782 17.08 0.854 0.03 0.521 12.63 0.566. A1F2. 0.937. 7.940 0.885 0.131 0.830 19.26 0.909 0.03 0.822. A1F3. 0.878. 8.022 0.886 0.116 0.845 18.92 0.889 0.03 0.684 13.92 0.628. A2F1. 0.957. 7.532 0.910 0.126 0.849 19.23 0.931 0.03 0.811. 6.87. 0.981. A2F2. 0.974. 7.306 0.915 0.117 0.886 18.82 0.942 0.03 0.937. 9.24. 0.849. A2F3. 0.974. 8.224 0.934 0.131 0.898 20.24 0.955 0.03 0.934. 9.13. 0.924. B1F1. 0.793. 6.443 0.799. 0.10. 0.780 17.85 0.799 0.02 0.417 20.96 0.326. B1F2. 0.897. 7.418 0.870. 0.12. 0.832 20.98 0.883 0.03 0.640 12.82 0.613. B1F3. 0.973. 9.179 0.934. 0.16. 0.908 26.12 0.951 0.04 0.918 11.52 0.817. B2F1. 0.970. 9.527 0.924. 0.17. 0.898 26.88 0.945 0.04 0.933 8.678 0.979. B2F2. 0.981. 9.072 0.916. 0.18. 0.898 28.85 0.947 0.04 0.970 2.848 1.482. B2F3. 0.940. 8.203 0.897. 0.14. 0.852 24.28 0.916 0.04 0.839 7.347 0.922. 7.48. 0.962. Stability studies The accelerated stability studies of baclofen SR tablets were performed as per the ICH guidelines to investigate whether the tablets are affected during storage conditions. The sample batch tablets from formulations A1F2, A2F2, B1F2 and B2F2 were kept at 400C/75% relative humidity for a period of 6 months. The physical appearance, hardness, drug content and dissolution rate were measured for formulations at the end of 2, 4 and 6 months. The results showed that there was no significant difference between the initial and aged baclofen SR tablets. The selected formulations A1F2, A2F2,.
(21) K. H. Janardhana et al.. J. Fundam Appl Sci. 2013, 5(2), 220-239. 240. B1F2 and B2F2 was physically and chemically stable for 6 months at accelerated stability conditions with minimal drug degradation at the end of the study.. 4. CONCLUSION The present study was aimed at an attempt to develop sustained release tablets containing solid dispersions of baclofen that require both solubilization and release modulation for therapeutic efficacy. A free flowing solid dispersion granule was obtained by surface adsorption of carriers on Carbopol 934P. Solid dispersion granules showed enhanced dissolution of baclofen. These results show that a combination of surface adsorption of solid dispersion and hydrophilic sustained release carriers is a promising approach to control the release rate of poorly water soluble drug like baclofen. The solid dispersion granules were directly compressed into tablets using hydrophilic polymers. The resulting sustained release tablets containing solid dispersion granules revealed linear release rate of Baclofen for 2 h in gastric fluid and followed by continuous release in intestinal fluid for up to 10 h. Thus a stable, safe and effective sustained release tablet containing solid dispersion of baclofen can be formulated successfully.. 5. ACKNOWLEDGEMENTS The authors are thankful to Gokula Education Foundation, Bangalore for providing necessary facilities to carry out the research work and Indian Institute of Science, Bangalore for providing DSC and XRD facility.. 6. BIBILIOGRAPHY 1. Vasconcelos T.F., Sarmento B., Costa P., Drug Dis. Today. 2007, 2, 1068-1075. 2. Sarkar B., Jain D., Agarwal A., Panwar A.S., Asian. J. Biomed. Pharm. Sci. 2011,1(2), 08-10. 3. Robinson J.R, Lee V.H. Controlled drug delivery fundamentals and applications. 2nd ed. New Delhi: CBS Publishers & Distributors 2005, Vol 29, pp.375-420. 4. Jayaswal S.B., Subha P., Gupta V.K., Kumar V.M., The Eastern Pharm. 1994, 8, 159-161. 5. Patil S.A., Kuchekar B.S., Chabukswar A.R., Jagdale S.C., J Young Pharm. 2010, 2(2), 121– 129. 6. Prescribing information of KemstroTM (Baclofen orally disintegrating tablets 10mg and 20mg, Schwarz Pharma, USA) 30th October 2003..
(22) K. H. Janardhana et al.. J. Fundam Appl Sci. 2013, 5(2), 220-239. 241. 7. URL: http://en.wikipedia.org/wiki/Baclofen (Accessed on 05th Dec 2012) 8. URL: http://www.druglib.com (Accessed on November 2012) 9. Indian Pharmacopoeia. 6th ed. Ghaziabad. Published by Indian Pharmacopoeia commission 2010, 2513 10. Hiroshi Y., Tetsuya O., Yoshio K., Katsutoshi O., Chem. Pharm. Bull. 1992, 40(6), 1592-1596. 11. Grzegorz G., Henning B., Werner W., Dissolution Tech. 2009,6, 7-13 12. ICH.Guidelines, Geneva: International conference on harmonization of technical requirements for. registration. of. pharmaceuticals. for. human. use;. 2003,. Accessed. from:. http://www.ich.org/Q1A (R2).. How to cite this article: Janardhana K H, Deveswaran R, Bharath S, Basavaraj B V and Madhavan V. Development of sustained release tablets containing solid dispersions of baclofen. J. Fundam. Appl. Sci., 2013, 5(2), 220-239.
(23)
Figure


+2

Documents relatifs
Semiconducting SWCNT extraction efficiency plotted as a function of temperature for Pluronic F108 dispersed laser ablation, plasma torch, and arc discharge SWCNTs separated by DGU..
- The phase 1 to liquid phase transition for the cyclohexanol sample studied in this paper took place at the temperature T.. The sample was cooled from room
Here we report the results of constant strain-rate and stress-relaxation ex- periments on garnets in the pyrope–majorite solid solution which constrain the strength of
Abstract - Thin oxide films of Ti02, Fe203-and Sn02 have been prepared by the organometallic chemical vapor deposition (MO-CVD) technique.. The structure and character of
There are two major methods of the barium titanate ceramic BaTiO3 elaboration, the solid and the liquid methods (Hydrothermal, sol-gel processing, and Coprecipitation) [1, 2, 3].. In
The acid properties of a non-thermal plasma in humid air (e.g., a gliding arc device) induced in an aqueous solution may deeply affect the efficiency of the matching oxidising
In order to demonstrate a pathological relevance of the change in PCOLCE sub-cellular localisation and nuclear enrichment observed in the skeletal myoblast model sys- tem of
stand the implication of the spatio- and temporal- variability of rainfall forecast applied in the flood forecasting environment. To achieve this, we employ a simple
