HAL Id: hal-00631070
https://hal.archives-ouvertes.fr/hal-00631070
Submitted on 17 Apr 2012HAL is a multi-disciplinary open access archive for the deposit and dissemination of sci-entific research documents, whether they are pub-lished or not. The documents may come from teaching and research institutions in France or
L’archive ouverte pluridisciplinaire HAL, est destinée au dépôt et à la diffusion de documents scientifiques de niveau recherche, publiés ou non, émanant des établissements d’enseignement et de recherche français ou étrangers, des laboratoires
Chromatic and Wavefront Aberrations: L-, M- and
S-cone Stimulation with Typical and Extreme Retinal
Image Quality
Florent Autrusseau, Larry Thibos, Steven Shevell
To cite this version:
Florent Autrusseau, Larry Thibos, Steven Shevell. Chromatic and Wavefront Aberrations: L-, M-and S-cone Stimulation with Typical M-and Extreme Retinal Image Quality. Vision Research, Elsevier, 2011, 51 (21-22), pp.2282-2294. �hal-00631070�
Chromatic and Wavefront Aberrations:
L-, M- and S-cone Stimulation with
Typical and Extreme Retinal Image Quality
Florent Autrusseau
1,3, Larry Thibos
4and Steven K. Shevell
1,2*1
Psychology, 2
Ophthalmology & Visual Science and Institute for Mind & Biology University of Chicago
940 E. Fifty-Seventh Street, Chicago, IL 60637, USA
3Ecole Polytechnique de l'Université de Nantes,
IRCCyN Rue Ch. Pauc, La Chantrerie, BP 50609, 44306 Nantes Cedex 03, France
4
School of Optometry, Indiana University 800 E. Atwater Avenue, Bloomington, IN 47405, USA
Keywords: Chromatic aberration, wave aberrations, optics, retinal image, spread light, point spread function.
*Please send correspondence to
Steven K. Shevell
Institute for Mind and Biology The University of Chicago 940 E 57th
Street
Chicago, IL 60637, USA Email: shevell@uchicago.edu
ABSTRACT
The first physiological process influencing visual perception is the optics of the eye.
The retinal image is affected by diffraction at the pupil and several kinds of optical
imperfections. A model of the eye (Thibos & Bradley, 1999), which takes account of
pupil aperture, chromatic aberration and wavefront aberrations, was used to determine
wavelength-dependent point-spread functions, which can be convolved with any stimulus
specified by its spectral distribution of light at each point. The resulting retinal spectral
distribution of light was used to determine the spatial distribution of stimulation for each
cone type (S, M and L). In addition, individual differences in retinal-image quality were
assessed using a statistical model (Thibos, Bradley & Hong, 2002) for population values
of Zernike coefficients, which characterize imperfections of the eye’s optics. The median
and relatively extreme (5th and 95th percentile) modulation transfer functions (MTFs) for
the S, M and L cones were determined for equal-energy-spectrum (EES) ‘white’ light.
The typical MTF for S cones was more similar to the MTF for L and M cones after taking
wavefront aberrations into account but even with aberrations the S-cone MTF typically
was below the M- or L-cone MTF by a factor of at least 10 (one log unit). More
generally, the model presented here provides a technique to estimate retinal image quality
for the S, M and L cones for any stimulus presented to the eye. The model is applied to
INTRODUCTION
A single point of monochromatic light that enters the eye has a two-dimensional
retinal image due to imperfections of the eye’s optics. The retinal image can be
characterized by a point spread function (PSF), which varies with the wavelength of light.
With broadband light, the retinal image is determined by decomposing the point of light
into its spectral components; the PSF is applied separately at each wavelength (Barnden,
1974; Ravikumar, Thibos & Bradley, 2008). The distribution of light on the retina is the
superposition of the light distributions for each of the wavelengths. When an observer
views a complete scene rather than a single point, each point in the scene is independently
affected by the eye’s optics; conceptually, the resulting retinal image at each wavelength
is the superposition of the distribution of light from each point in the scene. Retinal image
quality depends on both the PSF for each wavelength and the spatial and spectral
distribution of the light in view.
Optical models of the eye have been sought for centuries for a variety of applications
(Huygens, 1702; Listing, 1851; Emsley, 1952; Smith, 1995). A relatively recent model
(Thibos and Bradley, 1999) was used here to determine the spatial and spectral
distribution of light on the retina; this distribution then was used to find the spatial
distribution of light for each receptoral cone class, L, M and S.
The model used here has two advantages in comparison to Marimont and Wandell’s
(1994) well known model of retinal image quality. First, higher-order wavefront
aberrations were considered explicitly here rather than as an implicit property of a
coefficients) that characterize an individual eye, and these parameters have a known
multivariate population distribution. The population distribution allowed estimates of
individual differences in retinal image quality among people with normal corrected vision
(Thibos, Bradley and Hong, 2002). While a general comparison of the retinal image
quality given by the Marimont and Wandell model versus the one used here is not possible
because the models depend on different assumptions, results from the two models are
compared in the Discussion using a typical eye from the population distribution given by
Thibos et al. (2002). The two models agree well in this special case (as discussed later).
The first part of this paper focuses on retinal image formation. The optical model is
described and the calculated photoreceptor absorptions are explained. In the second part,
the model is applied to broadband ‘white’ spectral stimuli to assess typical and extreme
retinal contrast sensitivity in a normal population of human observers. The third part
considers some specific cases to show how retinal image quality depends on particular
features of a visual stimulus, and to demonstrate how the model may be applied to
particular types of images.
PART 1: RETINAL IMAGE MODEL
The retinal image is determined by characterizing the eye’s optics. Any optical system
can be fully described mathematically over an isoplanatic area by its optical transfer
function (Williams, 1989) so calculating the retinal image involves determining the eye’s
optical transfer function (OTF) or the closely related point spread function (PSF). The
PSF gives the retinal image of a monochromatic point source, taking account of the optics
A precise model of the eye includes various optical factors that affect the PSF at each
wavelength. This section covers the main properties of the model eye used to determine
the PSFs. Recall that the external stimulus pattern entering the eye is decomposed into
multiple monochromatic stimulus patterns, and then the stimulus pattern at each
wavelength is convolved with its wavelength-dependent PSF. This gives the retinal image
I(x,y,λ) at each wavelength λ. Superposition of these monochromatic retinal patterns
yields the retinal spectral distribution of light for each spatial location (x,y). These
spectral distributions allow calculation of the spatial distribution IC(x,y) of cone excitation
for each cone type C (C = L, M or S) by applying the appropriate cone spectral sensitivity
function SC(λ) as a weighting factor:
IC(x, y) = S
∫
C(λ)I(x, y,λ) dλ . (1) Optics of the human eyeThe human eye has three main optical components that affect retinal image quality: the
pupil, the cornea and the lens. The pupil diffracts light entering the eye, resulting in a PSF
with a central point surrounded by concentric rings (Roorda, 2002; Williams and Hofer,
2004). The cornea accounts for most of the eye’s refraction (about 43 diopters) while the
lens, which refracts light after passing through the pupil, adds more than 20 diopters in a
young adult (Roorda, 2002). The cornea and lens are the primary contributors to wave
aberrations, which degrade retinal image quality.
Longitudinal chromatic aberration (LCA) is a consequence of refraction by a
dispersive medium: light of different wavelengths is brought into focus at different
Transverse chromatic aberration is ignored here because of its weak marginal influence on
image quality when LCA and wave aberrations are considered (Ravikumar et al., 2008).
Similarly, the slight effect of higher-order chromatic aberrations on image quality is not
included (Nam, Rubinstein and Thibos, 2010).
Retinal image quality depends on pupil size and the wavelength of light. The greatest
loss of image quality from diffraction occurs with a small pupil and long wavelengths. On
the other hand, the greatest loss from refractive elements occurs with a large pupil and
short wavelengths. The sharpest retinal image, therefore, typically is at an intermediate
pupil size near 3 mm, which balances the tradeoff between diffraction (worse at smaller
pupil diameters) and the deleterious effects of wave aberrations (worse at larger
diameters).
The best known wave aberrations caused by the eye’s optics are defocus and
astigmatism, which are ameliorated by standard corrective lenses. Higher-order wave
aberrations (trefoil, coma, spherical, as well as other still higher-order aberrations) also
reduce image quality (Packer and Williams, 2003). The imperfections captured by the
higher-order wave aberrations include the irregularities in optical elements within the eye.
The eye’s lower- and higher-order wave aberrations can be modeled accurately using
Zernike polynomials; the first 15 Zernike mode numbers were used here for the
polynomials (Thibos and Bradley, 1999; Thibos et al., 2002). Statistical models of Zernike
aberration coefficients produce monochromatic PSFs that are representative of human
eyes (Thibos, 2009).
As mentioned above, each wavelength of light is affected differently by the optics of
wavelengths in the visible spectrum as a hyperspectral PSF. Spectral sampling here was
every 10 nm, a choice supported by the analysis of Ravikumar et al. (2008). A
hyperspectral PSF captures two important aspects of retinal image quality. First, an object
with a single broadband chromaticity, such as equal-energy-spectrum ‘white’, does not
necessarily produce on the retina an image at only that chromaticity because some
wavelengths are more strongly dispersed than others. Second, spectral mixtures that are
visually indistinguishable in color as large homogenous patches (color metamers) may not
match at other spatial frequencies because the wavelengths composing each metamer are
unequally affected by optics (Poirson & Wandell, 1993; Marimont and Wandell, 1994).
An implication of the second point is that the influence of optics on the retinal image can
be determined from only the full spectral distribution of light entering the eye. In general,
a trichromatic description of the light -- for example CIE X,Y,Z tristimulus values or the
excitations of the three types of cones -- is not sufficient, except under exceptional
circumstances (e.g. using only the R pixels in an RGB display) that allow the full spectral
distribution to be determined from the trichromatic specification (Barnden, 1974;
Ravikumar et al., 2008).
Cone quantal absorptions
Transduction of light at the photoreceptors establishes the neural responses that
mediate vision. There are three classes of cone photoreceptor, labeled S, M and L, with
peak sensitivity in the short-, middle- or long-wave part of the visible spectrum,
respectively. The response of each cone type depends on the rate of quantal absorption.
spectral energy distribution of light at each point on the retina. (The spacing between
adjacent cones in the retinal mosaic is ignored here.) This gives the spatial distribution of
stimulation for each cone type.
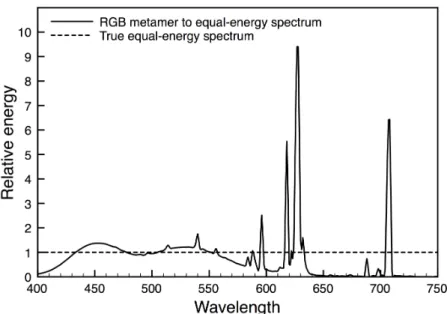
Figure 1: Spectral power distribution of a true equal-energy-spectrum ‘white’ stimulus (dashed line) and from a typical color monitor displaying a light metameric to the equal-energy spectrum (solid line).
The retinal spatial distribution of excitation for each cone type, therefore, requires the
full spectral distribution of light at each point within the viewed scene. This implies, for
example, that a scene on a color display with each pixel specified by its R (‘red’), G
(‘green’) and B (‘blue’) components must be transformed into a pixel-by-pixel spectral
energy distribution in order to determine the retinal image. For example
equal-energy-spectrum (EES) ‘white’ light, which by definition has all wavelengths in the visible
spectrum at the identical energy, should not be used to calculate the retinal image of the
components has a different physical spectral composition than true EES with all
wavelengths at the same energy (compare dashed and solid lines, Fig. 1). Instead,
calibration of the display is required to transform trichromatic coordinates of the display to
the full spectral distribution of light at each point of the stimulus. This transformation is
specific to each individual display; it differs among displays of the same manufacturer and
model, and even for the same display over time.
PART 2: TYPICAL AND POPULATION EXTREMES OF RETINAL IMAGE QUALITY
Point spread functions
The effects of pupil size and wave aberrations on the shape of the PSF can be
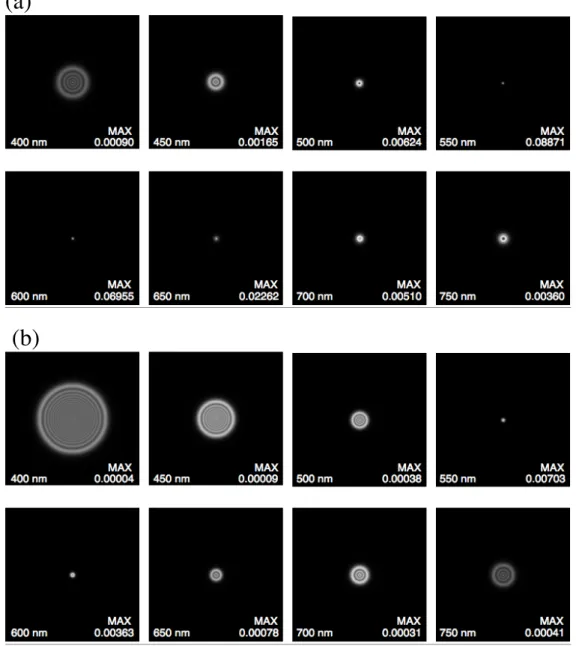
determined separately. The PSFs shown in Fig. 2 ignore wavefront aberrations; only
diffraction and longitudinal chromatic aberration (LCA) are included in the PSFs, for a 3
or 6 mm diameter pupil (Figs. 2a and 2b, respectively).
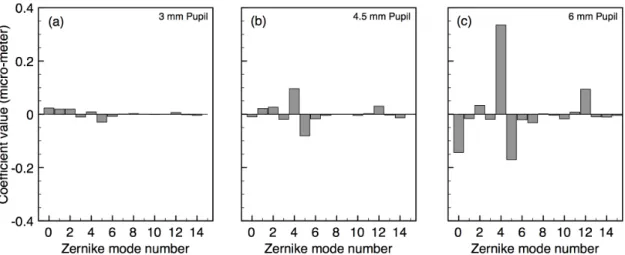
Zernike polynomials are used to model wavefront aberrations. A study conducted on
200 normal eyes provides a statistical model for the population distribution of Zernike
coefficients up to the 36th Zernike mode number (Thibos et al., 2002). Figure 3 shows the
first 15 mean Zernike coefficients for a pupil diameter of 3.0, 4.5 or 6.0 mm. These
results are consistent with other population studies (Porter, Guirao, Cox, & Williams,
2001; Castejon-Mochon, Lopez-Gil, Benito & Artal, 2002; Salmon & van de Pol, 2006).
In general, values of the Zernike coefficients vary with both the characteristics of a
particular eye and with pupil size. As mentioned above, the slight variation expected in
higher-order aberrations with wavelength and the variation of the prismatic terms
(a)
(b)
Figure 2: Point spread functions due to only diffraction and longitudinal chromatic aberration (no wavefront aberrations) for monochromatic wavelengths 400, 450, 500, 550, 600, 650, 700 and 750 nm. Focus wavelength is 570 nm. The height and width of each panel is 1 deg of visual angle. The sum of the volume under the PSF in each panel is 1.0 but, for visual clarity, the maximum in each plot is scaled to appear white; the actual maximum in each plot, which varies by more than 2000:1, is shown in the bottom right of each panel. (a) 3 mm diameter pupil. (b) 6 mm diameter pupil.
Figure 3. Mean Zernike coefficients for the first 15 Zernike modes, for pupil diameter (a) 3mm, (b) 4.5mm or (c) 6 mm (from the model of Thibos et al., 2002).
Point spread functions that include wave aberrations are shown in Fig. 4 for a 6 mm
diameter pupil, which is close to the pupil size for 20-30 year-old observers at a luminance
of about 100 cd/m2 (Winn, Whitaker, Elliott & Phillips, 1994). Analyses that follow use
the same 6 mm diameter pupil. The mean Zernike coefficients from Fig. 3c were used for
the PSFs in Fig. 4a but, as argued below, these PSFs are not characteristic of a typical
human eye. The PSFs in Fig. 4b are based on Zernike coefficients for a “standard
observer” described later.
Modulation transfer functions and phase shifts
The modulation transfer function (MTF) is used to assess the eye’s optical quality.
Conceptually, the MTF can be determined for an EES light or any other spectral
distribution by finding the contrast in the retinal image for sine waves at various spatial
(a)
(b)
Figure 4. Point spread functions due to diffraction, longitudinal chromatic aberration, and wavefront aberrations for monochromatic wavelengths 400, 450, 500, 550, 600, 650, 700 and 750 nm. The height and width of each panel is 1 deg of visual angle. The sum of the volume under the PSF in each panel is 1.0 but, for visual clarity, the maximum of each plot is white; the actual maximum in each plot, which varies by over 500:1, is shown in the bottom right of each panel. Focus wavelength is 570 nm; pupil diameter is 6 mm. (a) Based on mean population Zernike coefficients from Fig. 3c. (b) Based on Zernike coefficients for a “standard observer” (see text and Table 1, below).
L-, M- and S-cone MTFs were determined here for 100 different independent random
samples of Zernike coefficients taken from the population distribution given by Thibos et
al. (2002). The first 15 Zernike coefficients were used. The wavelength in focus was 570
nm. The spectral distribution of light was EES, and luminance was varied sinusoidally in
the horizontal direction (i.e., a vertically oriented sine wave). With the PSFs determined
for each visible wavelength, the retinal image at each wavelength was found by
convolving the PSF for that wavelength with the visual stimulation at that wavelength.
Repeating this for each wavelength in the stimulus and then taking the superposition of all
wavelengths gave the spectral distribution of light at each point on the retina resulting
from a particular visual stimulus (for example, an EES sine-wave grating varied in
luminance at 10 cycles per degree). Then, at each point on the retina, the amount of each
wavelength was weighted by the Smith and Pokorny (1975) cone spectral sensitivity
function, separately for the L, M and S cones. This gave the relative quantal absorption
for each cone type at that point on the retina. The MTF for each cone type then was
determined by finding the retinal contrast as a function of the spatial frequency of the
stimulus.
The complete set of one hundred MTFs, determined separately for the L, M, and S
cones, is shown in Fig. 5 (thin gray lines). The median (thick black line), 5%ile (dotted
line) and 95%ile (dashed line) values are also shown. The figure reveals the large
individual differences in the MTFs estimated to occur within a normal population. The
S-cone median MTF is well below the L- and M-S-cone median curves, though the population
Figure 5. Modulation transfer functions for 100 randomly sampled sets of Zernike
coefficients for pupil diameter 6 mm (gray lines). The median contrast sensitivity among the 100 values at each spatial frequency is shown by the solid black line; the 5th
and 95th
percentile contrast sensitivity is shown by dotted and dashed lines, respectively. The solid black lines connecting the symbols are MTFs for the “standard observer” (see text). (Left) L-cone MTFs. (Center) M-cone MTFs. (Right) S-cone MTFs.
One sampled set of Zernike coefficients gave L-, M- and S-cone MTFs that are close
to the median values (see lines connecting symbols, Fig. 5). This set of Zernike
coefficients (Table 1) was used to define a “standard observer” for a 6 mm pupil; the
MTFs from this set were consistent with an observer with about half the sample having
better retinal cone contrast and half having worse contrast. While the standard observer’s
S-cone MTF is slightly better than the median (at worst the 65%ile instead of the median’s
50%ile, at 10 cycles per degree), this set of sampled Zernike coefficients was selected for
the standard observer because the set of coefficients gave values close to both the median
MTFs (Fig. 5) and the median magnitudes of image displacement (computed as the ratio
of absolute value of phase shift to spatial frequency) for all three types of cone. The
Zernike coefficients is shown in Fig. 6. The median absolute values were close to the
image displacements for the standard observer (compare solid lines, with and without
symbols, Fig. 6). Of course, this particular set of Zernike coefficients is not unique in
terms of giving MTFs and image displacements that are near the median for all three cone
types.
TABLE 1. Zernike coefficients for “standard observer” with 6 mm pupil
Zernike Mode Number Coefficient Value
0 0.3243 1 -0.5796 2 0.7083 3 -0.1115 4 0.8638 5 0.0148 6 -0.1116 7 -0.1644 8 0.3053 9 -0.0673 10 -0.0273 11 -0.0115 12 0.2394 13 0.0228 14 0.0784
The significance of spatial phase shifts in the image plane should not be ignored when
wave aberrations are introduced. A circularly symmetric PSF due only to diffraction and
longitudinal chromatic aberration (i.e., no wave aberrations) causes no shift in the phase of
the stimulus. Wave aberrations, however, can shift phase in the image plane. A PSF
accurate representation of both. While several other sampled sets of Zernike coefficients
gave MTFs close to the median for the three cone types (Fig. 5), the standard observer was
selected to closely represent both the median MTFs (Fig. 5) and median phase shifts (Fig.
6).
Figure 6. Image displacement functions for 100 randomly sampled sets of Zernike coefficients (6 mm diameter pupil). Ordinate values are the ratio of |phase shift| / spatial frequency. The median, 5th
percentile and 95th
percentile shifts are indicated by solid, dotted and dashed black lines, respectively. Solid black lines connecting the symbols are image displacements for the standard observer whose Zernike coefficients are given in Table 1. (Left) L cone. (Middle) M cone. (Right) S cone.
To assess the reliability of the median and extreme MTFs, the 100 sampled sets of
Zernike coefficients were randomly split into two groups of 50 samples each. Then the
median, 5%ile and 95%ile MTFs for the L-, M- and S-cone were compared for the two
Figure 7. Modulation transfer functions for split halves of the 100 randomly sampled sets of Zernike coefficients for pupil diameter 6 mm. Each split half had 50 sampled sets of Zernike coefficients. The median, 5th
percentile and 95th
percentile contrast sensitivity for each split half are shown as a function of spatial frequency by the solid, dotted and dashed lines, respectively. (Left) L-cone MTFs. (Center) M-cone MTFs. (Right) S-cone MTFs.
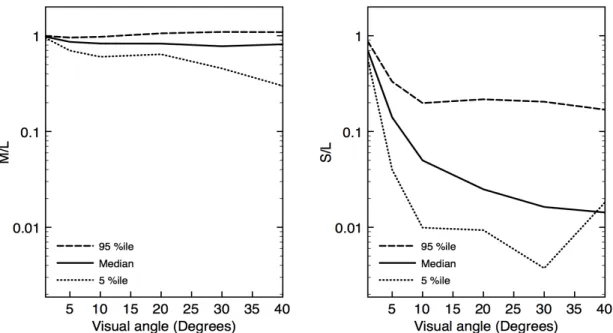
A straightforward way to quantify the differences in MTFs among the L, M and S cones is
to plot relative M/L and S/L contrast sensitivity for the median, 5%ile and 95%ile MTFs
(Fig. 8). This shows that median contrast sensitivity is similar for the M and L cones.
Median S-cone contrast sensitivity is a log unit or more lower than L, except at the lowest
spatial frequencies.
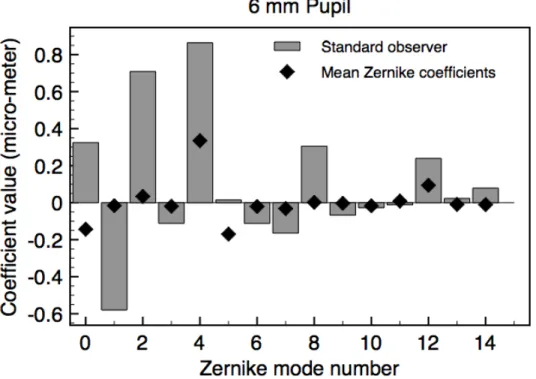
Zernike coefficients: Population means versus values for standard observer
There are substantial differences between the Zernike coefficients for the “standard
observer” (Table 1, and gray bars in Fig. 9) and the mean Zernike coefficients for the
population of human observers (from Thibos et al., 2002; diamonds, Fig. 9). For most
purposes, the standard observer is more representative of a typical observer’s image
Figure 8. The ratio of contrast sensitivity for pupil diameter 6 mm as a function of spatial frequency, based on 100 randomly sampled sets of Zernike coefficients, for (left) M cones relative to L cones and (right) S cones relative to L cones. The median, 5th
percentile and 95th
percentile are shown in each panel by the solid, dotted and dashed line, respectively.
Thibos et al., (2002), a positive or a negative Zernike coefficient can degrade the retinal
image but when averaged over observers the positive and negative values tend to cancel
each other to give a mean closer to zero than is representative of the population (compare
bar lengths to diamonds, Fig. 9). An implication of this is apparent in the
wavelength-dependent PSFs based on population-mean Zernike coefficients and the PSFs for the
“standard observer” (Figs. 4a and 4b, respectively). The PSFs for the standard observer
are less circularly symmetric, as expected for Zernike coefficients that are farther from
Figure 9. The first fifteen Zernike coefficients for the “standard observer” (6 mm diameter pupil, gray bars), whose MTFs and image displacements are similar to the median values from the 100 randomly sampled sets of Zernike coefficients. Mean Zernike coefficients are also shown (diamonds, replotted from Fig. 3c)
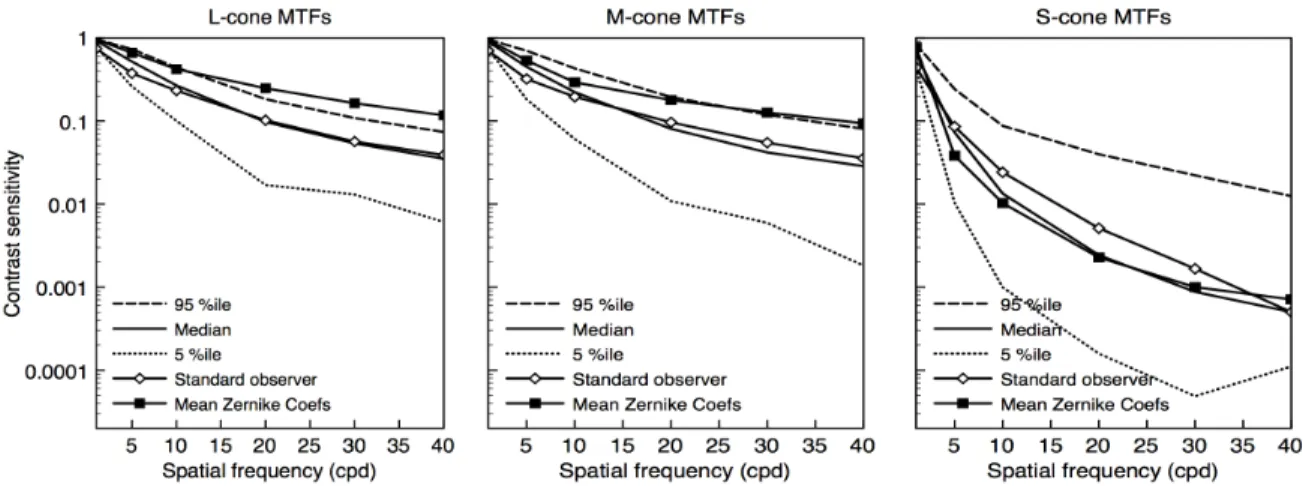
Even more significant is the difference in MTFs based on mean Zernike coefficients
versus the Zernike coefficients for the standard observer. Consider again the median,
95%ile and 5%ile MTFs for the 100 randomly sampled sets of Zernike coefficients with
pupil diameter 6 mm (Fig. 10, replotted from Fig. 5), and compare them to (i) MTFs for
the standard observer and (ii) MTFs implied by the mean Zernike coefficients (open and
solid symbols, respectively, in Fig. 10). The MTFs for the standard observer fall close to
the medians, of course, because of the criteria used to define the standard observer. The
L- and M-cone MTFs based on population-mean Zernike coefficients, however, seriously
they show that mean Zernike coefficients give estimates of image quality appropriate for
only a small percentage of the population with the best optics.
Figure 10. Modulation transfer functions based on 100 randomly sampled sets of Zernike coefficients for pupil diameter of 6 mm. The median contrast sensitivity among the 100 samples at each spatial frequency is shown by the thick solid line; 5th
and 95th
percentile contrast sensitivity is shown by dotted and dashed lines, respectively. Solid lines connecting open
symbols are MTFs for the “standard observer”; solid lines connecting solid symbols are MTFs based on the mean Zernike coefficients in Fig. 3c. (Left) L-cone MTFs. (Center) M-cone MTFs. (Right) S-cone MTFs.
PART 3: ESTIMATING SPECIFIC RETINAL IMAGES: ISSUES AND EXAMPLES
The first two parts of the paper considered retinal image quality and how it affects
stimulation of the L, M and S cones for typical and relatively extreme normal human
observers, assuming a ‘white’ stimulus with an EES spectral distribution. MTFs were
derived using vertical sine-wave gratings. More generally, the model developed above
may be applied to any visual stimulus. In this part, retinal image quality is determined for
Equal-energy-spectrum ‘white’ and its CRT metamer
As discussed above, the eye’s optical imperfections can be quantified by
wavelength-dependent PSFs (Fig. 4), the effects of which are determined by decomposing the visual
stimulus into its monochromatic components, applying each wavelength-dependent PSF,
and then combining each monochromatic spatial light distribution by superposition. Thus,
the effect of the eye’s optics on the retinal spatial and spectral distribution of light depends
on the spectral distribution of the stimulus.
The significance of the underlying spectral distribution of the stimulus can be missed
by wrongly applying the color-vision principle of trichromacy, which holds that the color
of any spectral distribution of light can be perfectly matched by a mixture of just three
wavelengths (for example, 440 nm, 540 nm and 660 nm, which alone appear violet,
yellowish-green and red, respectively). The basis for trichromacy is the three types of
cone photoreceptors: L, M and S. Any given spectral distribution is perceived to be an
exact match to an entirely different spectral distribution so long as both distributions have
the identical rate of quantal absorption by the L, M and S cones; unequal spectral
distributions that satisfy this matching criterion are called metamers. An example of two
spectral distributions that appear identical is in Fig. 1. The flat energy distribution as a
function of wavelength for EES ‘white’ (dashed line) results in the same stimulation of the
L, M and S cones as the irregularly shaped spectral distribution (solid line), which is
typical of a CRT display set to exactly match EES ‘white’.
Two metameric spectral distributions of light, however, may not have exactly the same
appearance when presented as complex patterns of light. The reason is that the underlying
absorptions for large uniform patches (as used for color matching) may be unequally
affected by the eye’s optics, because the effects of optics vary according to the
wavelengths composing the two stimuli. For example, MTFs for the L and M cones for
the standard observer are similar for true EES light and for its CRT metamer but contrast
sensitivity for S cones is lower for true EES light compared to the metameric CRT
chromaticity (compare open and filled symbols, Fig. 11). In general, retinal images of
identical stimulus patterns composed of metameric lights may not be assumed to be equal.
Figure 11. Modulation transfer functions for the “standard observer” for vertical gratings
composed of (i) EES ‘white’ light (open symbols) or (ii) the typical spectral distribution from a CRT display set to be metameric to EES ‘white’ (filled symbols). (Left) L-cone MTFs. (Center) M-cone MTFs. (Right) S-cone MTFs.
Stimulus orientation and the retinal image
In the second part of the paper, MTFs were determined from luminance modulation of
EES light varied in the horizontal direction (i.e., vertically oriented gratings). In the
absence of wave aberrations, any orientation of the stimulus gives the same results
light can (i) be asymmetric with respect to the center of the uniform bar and (ii) depend on
stimulus orientation.
Asymmetric distortion from wave aberrations can be illustrated with a square-wave
EES grating of two cycles per degree with 100% luminance contrast (solid lines, Fig. 12);
in the figure, the one-dimensional square-wave is a profile of a two-dimensional vertical
square-wave grating. Retinal-image profiles at monochromatic wavelengths between 400
and 750 nm are shown for a 6 mm pupil (Fig. 12). In the top panel, only diffraction and
LCA are considered (no wave aberrations). The wavelength-dependent distortion of the
square-wave stimulus is symmetric around the center of the stimulus peaks and troughs.
By comparison, when wave aberrations for the standard observer are included (middle
panel, Fig. 12), there is clear left-right asymmetry; moreover, the shape of the asymmetry
is wavelength dependent. The asymmetry carries over to the spatial profile of stimulation
for the L, M and S cones (bottom panel, Fig. 12).
The influence of stimulus orientation can be seen with the same EES, two cycle per
degree square-wave grating. For the standard observer (6 mm pupil), the retinal-image
profiles for the L, M and S cones are different for a vertically compared to horizontally
oriented grating (see dotted and dashed lines, Fig. 13). In general, when wave aberrations
are considered, the retinal image depends on the overall stimulus orientation as well as the
Figure 12. Retinal-image profiles for an EES, two cycle per degree, 100% contrast square-wave grating. The solid line in each panel shows the square-wave stimulus. (Top and Middle) Profiles for wavelengths 400, 450, 500, 550, 600, 650, 700 and 750 nm (6mm pupil, 570 nm focus wavelength), with effects of only diffraction and longitudinal chromatic aberration (no wave aberrations, top) or with added effects of wave aberrations of the standard observer (middle). (Bottom) Retinal-image profiles for L-, M- and S-cone stimulation with wave
Figure 13. Retinal-image profiles for an EES, two cycle per degree, 100% contrast square-wave grating (6 mm pupil, 570 nm focus wavelength) including effects of wave aberrations for the standard observer. The solid line in each panel shows the square-wave stimulus profile. The dotted and dashed lines show the profiles for a vertically or horizontally oriented grating, respectively. (Top) Relative L-cone stimulation; (Middle) Relative M-cone stimulation;
The retinal image of an EES ‘white’E
The loss in retinal image quality caused by the eye’s optics can be visualized by the
retinal image of the letter “E” of width 0.5 deg visual angle (cf. Williams & Hoffer, 2004).
An E presented to the eye as EES ‘white’ light is shown in the far left panel of Fig. 14.
The retinal image of the E, assuming only diffraction and LCA (no wave aberrations), is in
the three top panels on the right, separately for stimulation of the L, M and S cones. A
modest drop in image quality is apparent for the L-cone and M-cone retinal images, while
the S-cone retinal image is far worse than for L or M. Adding wave aberrations of the
standard observer (bottom three panels at right) further degrades the L-cone and M-cone
retinal images but not the cone image, which actually appears a bit better than the
S-cone image without wave aberrations. Note, however, that the S-S-cone retinal image with
wave aberrations (bottom right panel) is poorer than the L- and M-cone images that
include wave aberrations (compare three bottom panels at right, Fig. 14). The effect of
wave aberrations on the retinal image for each type of cone is taken up again in the
Discussion, where previous studies are also considered.
Retinal image quality for typical R, G and B components of a color video display
The model developed here may be applied to a visual stimulus with any spectral
distribution. Three spectra of practical interest are the R, G and B components of a color
video display. The analysis below is for the R, G and B guns of a Sony GDM-F520 CRT,
a display used in many vision laboratories. (The exact R, G and B spectra vary, of course,
Figure 14. Retinal images of an EES letter “E” subtending in width 0.5 deg visual angle. Each panel is 1 deg square and rendered relative to the maximum light level in the stimulus before entering the eye (shown at the far left). (Right, top row) The retinal image for the L, M and S cones assuming only diffraction and LCA (no wave aberrations, 6 mm diameter pupil). (Right, bottom row) The retinal image for the L, M and S cones with the added effects of wave aberrations of the standard observer (6 mm diameter pupil).
For any known spectral distributions of light, the MTF can be determined for the L, M
or S cones of the standard observer. The R, G and B spectra of the CRT were measured
using a PhotoResearch PR-650 spectroradiometer. For each component (R, G or B), the
L-, M- and S-cone MTFs are plotted together in a single panel in Fig. 15. There are two
main points. First, the MTFs for R and G are higher than for B, for every type of cone.
Second, the MTFs for the R and G components are similar to each other for the L and M
cones but not for the S cones, for which G has substantially higher contrast sensitivity than
Figure 15. Modulation transfer functions for the standard observer (6 mm diameter pupil) for vertical gratings composed of a typical video display’s (left) R component, (center) G component or (right) B component. The MTFs for the L, M and S cones are shown within each panel. Focus wavelength 570 nm.
DISCUSSION
The approach here used a comprehensive model of the eye (Thibos & Bradley, 1999)
that incorporates pupil aperture, longitudinal chromatic aberration and wavefront
aberrations. The model gives the spatial and spectral distribution of light on the retina
from any image presented to the eye. Such distributions were used to determine typical
and extreme (5th
and 95th
percentile) MTFs for each type of cone (L, M and S), by
incorporating known individual differences for the eye’s optics (Thibos et al., 2002).
A large number of random samples from the statistical distribution for individual
differences also revealed median levels of contrast sensitivity, from which a “standard
observer” was defined with retinal image quality near the central tendency of the normal
tend to cancel out positive and negative coefficients and thus underestimate the loss of
image quality, which is largely dependent on the coefficients’ magnitudes regardless of
sign.
Other investigators have examined related questions about retinal image quality for
spectrally broadband images. Results from the approach here are compared to two well
known studies below.
A comparison to the Marimont and Wandell model
As mentioned in the Introduction, Marimont and Wandell (1994) consider a similar
problem but with a model that has two important differences. First, the model here
explicity considers higher-order wavefront aberrations. Second, the model here can be
used to estimate individual differences based on the statistical population distribution for
characteristics of the eye’s optics (Thibos et al., 2002). Nonetheless, in special cases the
two models should give similar results. In particular, when only diffraction and
longitudinal chromatic aberration are included in the model here (no wave aberrations),
the modeled retinal image should be somewhat better than the results from the Marimont
and Wandell model, which incorporates an approximation for higher-order aberrations.
Also, the full model here with wave aberrations of the standard observer (Table 1) should
give a retinal image similar to but different in shape than the Marimont and Wandell
model, because introducing explicit wave aberrations results in asymmetries in the PSFs
(Fig. 4) and thus in the retinal light profile (e.g., middle panel of Fig. 12).
Retinal light profiles for an inhomogeneous chromatic image (Fig. 16) were
For this test case, the stimulus was composed of a square-wave vertical stripe of width 7.3
min of arc, centered within a 1 deg wide surround. Both the stripe and surround had the
same chromaticity (0.665) in the l = L/(L+M) direction of the MacLeod and Boynton
(1979) l,s cone-based coordinate system but differed in s = S/(L+M): the stripe had an s
chromaticity of 2.50 so when viewed alone would appear decidedly bluish, while the
surround had an s chromaticity of 0.99 so was virtually metameric to EES ‘white’. The
stripe and surround were equal in luminance. The full spectral distributions of the
chromaticities were assumed to be from the CRT considered in Fig. 15.
In Fig. 16, the vertical axis is the light profile for the s chromaticity, derived from the
retinal image for S, M and L and then applying the definition of s = S/(L+M). The square
wave (solid line) is the image at the cornea. A technical point for calculation of s is
selection of units for S, M and L; previous results for S-, M- and L-cone MTFs and light
profiles were not dependent on units because plotted quantities were relative values. For
Fig. 16, L and M were normalized so that L+M gave luminance (as for the Smith and
Pokorny (1975) cone fundamentals), and S was scaled so that s=1.0 for the spectrally flat
distribution of EES ‘white’.
As expected, the model here without wave aberrations specified a light profile for s
that that was sharper (better retinal image quality) than either the Marimont and Wandell
model or the model here that includes wave aberrations. The light profiles from the
Marimot and Wandell model and from the model here with wave aberrations were similar
but only the latter captured the asymmetry in the distribution of light implicit in the
asymmetric PSFs (as seen in Fig. 4). Note that the light profile with higher-order wave
Overall, the comparison in this special case shows that the model used in this paper with
the optics of the standard observer (Table 1) gives results in accord with those from the
Marimont and Wandell model.
Figure 16. Comparison between the retinal light profiles for s=S/(L+M) from the model used here (focus wavelength 570 nm), without wave aberrations (dotted line) or with the wave aberrations of the standard observer (dash-dot line), and from the line spread function of Marimont and Wandell (dashed line). The corneal stimulus (solid line) is a vertical stripe of width 7.3 min within a 1 deg wide surround. The stripe and surround have different
chromaticites (see text). Pupil diameter is 6 mm.
How do wave aberrations affect relative L-, M- and S-cone contrast sensitivity?
Longitudinal chromatic aberration (LCA) reduces the retinal image quality of
broadband spectral light because the focal distance from refraction increases with
wavelength. When light of some wavelength is in perfect focus, light at other
wave aberrations) quantify the substantial reduction in retinal image quality that they
cause for broadband EES ‘white’ light (left panel Fig. 17, lines without symbols).
Introducing wave aberrations also reduces image quality, compared to diffraction
alone. The retinal image from diffraction, LCA and wave aberrations together -- all of
which, of course, affect natural viewing -- might be expected to be worse than from only
diffraction and LCA; somewhat surprisingly, however, adding the effects of wave
aberrations to those of diffraction and LCA can improve image quality in some cases
(McLellan, Prieto, Marcos and Burns, 2002). The reason is that wave aberrations reduce
the influence of wavelength on contrast sensitivity; although wave aberrations reduce
contrast sensitivity at the wavelength of focus, they can increase sensitivity at other
wavelengths that are badly defocused by LCA. The result is that wave aberrations in
Figure 17. (Left)The MTFs for each type of cone (L, M and S) with only diffraction and LCA (no wave aberrations, lines without symbols) and with the added wave aberrations of the standard observer (lines with symbols). (Middle and right) The L-, M- and S-cone MTFs for two (#14 and #92) of the 100 randomly sampled sets of Zernike coefficients, for which MTFs with wave aberrations were unusually similar for all three types of cone. For all panels, the spectral light distribution is EES, pupil diameter is 6 mm and focus wavelength is 570 nm.
some cases “counteract retinal image blur from LCA (McLellan, Prieto, Marcos and
Burns, 2006, p.3009)”. For example, adding the standard observer’s wave aberrations to
diffraction and LCA reduces L- and M-cone contrast sensitivity but improves S-cone
sensitivity (left panel Fig. 17, lines connecting symbols).
Comparing MTFs with versus without wave aberrations shows that introducing wave
aberrations can make contrast sensitivity more similar for the three types of cone. For
example at 20 cpd (see left panel, Fig. 17), with the wave aberrations of the standard
observer the contrast sensitivity for L cones (and M cones) is about 20 times better than
for S cones; without wave aberrations (only LCA and diffraction), L-cone (and M-cone)
sensitivity is about 200 times better than S. These results confirm that wave aberrations
can reduce the difference in contrast sensitivity among the three types of cone.
A related issue is whether wave aberrations fully (or nearly) eliminate the differences
in contrast sensitivity for the L, M and S cones. McLellan et al. (2002) report that they do:
the MTFs for all three cone types are nearly identical to each other, for each of their three
observers (their Figs. 3b-d, p.175). To consider this question, the random sample of 100
sets of Zernike coefficients was searched for sets with the S-cone MTF near or above the
and M-cone MTFs. For example, one sample (#14; middle panel, Fig. 17) had close
L-, M- and S-cone MTFs (cf. the standard observer’s MTFs in left panel of Fig. 17); the
difference between L- and M-cone contrast sensitivity was about the same as between L
and S sensitivity. At 20 cpd for #14, the contrast sensitivity for L cones was less than
twice that of S cones. This set of MTFs is similar to the set for an observer reported by
McClelland et al. (2002; their Fig. 3b). Another sample at 20 cpd (#92; right panel, Fig.
sensitivity fractionally better than L or M sensitivity (reminiscent of the MTFs for the
observer in Fig. 3c of McClelland et al. (2002)). In sum, a few of the 100 samples were
consistent with the view that wave aberrations can (nearly) eliminate contrast sensitivity
differences among the three types of cone.
Recall, however, that the MTFs in Figs. 17b,c were selected from the sample of 100
sets because contrast sensitivity was similar for the L, M and S cones. To consider
whether wave aberrations typically eliminate contrast-sensitivity differences among the
three types of cone, the MTF for the S cones was compared to the MTFs for L and M
cones at 10 and 20 cpd for all 100 randomly sampled sets of Zernike coefficients.
Because L- and M-cone MTFs tended to be similar, average L and M contrast sensitivity
was compared to S sensitivity (that is, Average(L-sensitivity,M-sensitivity) relative to
S-sensitivity). This sensitivity ratio for the 100 samples is plotted in a histogram in Fig. 18
(left panel, 10 cpd; right panel, 20 cpd). A value of zero indicates equal contrast
sensitivity for S cones compared to the average for L and M; a positive [negative] value
indicates L and M cones had higher [lower] sensitivity than S. The horizontal axis in Fig.
18 is a log scale so, for example, a value of +2.0 indicates lower S contrast sensitivity by a
factor of 100.
Overall, S-cone contrast sensitivity nearly always was lower than L and M sensitivity
(in 99% of cases at 10 cpd, and 97% of cases at 20 cpd). In the vast majority of cases, S
contrast sensitivity was at least 10 times lower (> +1.0 on the log scale) than L and M
sensitivity (73% of cases at 10 cpd, 77% of cases at 20 cpd). While S-cone sensitivity that
is lower by a factor of 10 is a much smaller sensitivity difference than a factor of more
18), the results show that wave aberrations very seldom bring L-, M- and S-cone contrast
sensitivity to comparable levels. The simulated retinal image of the letter E (Fig. 14) is a
demonstration of this point for the standard observer. The top three panels on the right of
that figure include only diffraction and LCA; the image for S cones is far worse than for L
and M. Wave aberrations, included in the images in the three bottom panels, further
degrade the image for L and M cones but improve somewhat the image for S cones;
nonetheless, even with wave aberrations the retinal image for S cones does not approach
the quality of the image for L or M cones.
Figure 18. Histogram of the contrast sensitivity ratio for the average for L and M cones
compared to S cones, for the 100 randomly sampled sets of Zernike coefficients. Note the log scale on the horizontal axis. A positive value indicates lower S than L and M sensitivity. Pupil diameter is 6 mm and focus wavelength is 570 nm. (Left) 10 cpd. The value for the standard observer is 0.98, and for only diffraction and LCA (no wave aberrations) is 2.43. (Right) 20 cpd. The value for the standard observer is 1.30, and for only diffraction and LCA (no wave aberrations) is 2.33.
Other applications for the model of retinal image quality
The model can be employed for many other purposes. Psychophysical experiments
corneal) spatial distribution of light. The model can be used to determine a typical retinal
image for the standard observer, given any external stimulus; moreover, a population
range of retinal images can be estimated for, say, the central 90% of the population by
finding the extreme L-, M- and S-cone MTFs for the best and worst 5% of the population.
This can be useful for excluding optical stimulus distortion as a viable account for
experimental measurements, thereby implicating neural processes.
The pupil is largest, and retinal image quality often poorest, with dim illumination. A
straightforward generalization of the model is to substitute the scotopic luminosity
function V’(λ) for the cone spectral sensitivity function SC(λ) in Eq.(1). This gives the
spatial distribution IR(x,y) for rod excitation, from which a rod MTF or other
characteristics of rod stimulation can be determined.
The model’s ability to incorporate population variation in retinal image quality can be
applied to several practical issues, including design decisions for instruments, spectral
illumination and chromatically complex surfaces. An estimate of the retinal image for any
light stimulus, including any object under any illuminant, can be useful for example to
determine the legibility of text for, say, 99% of the population by assuming retinal image
quality for the worst 1% of normal human observers. This may be particularly valuable
for examining nighttime visibility (for example, for signage), when the pupil is largest.
More generally, standards can be developed for detection or discrimination that take
account of losses in retinal image quality for the vast majority of the normal population
(say 99%, again by using retinal image quality for the worst 1% of the normal population).
A related application is assessment of image quality (digital or otherwise). The ability to
assessments to take account of the substantial variation in the retinal image, which
depends on both the particular image presented to the eye and individual differences
within the population of human observers.
REFERENCES
Barnden, R. (1974). Calculation of axial polychromatic optical transfer function, Optica Acta, 21, 981–1003.
Castejon-Mochon, J. F., Lopez-Gil, N., Benito, A. & Artal, P. (2002). Ocular wave-front
aberration statistics in a normal young population. Vision Researcj, 42, 1611-1617.
Hopkins, H. H. (1955). The frequency response of a defocused optical system,
Proceedings of the Royal Society (London), A231, 91–103.
MacLeod, D. I. A. & Boynton, R. M. (1979). Chromaticity diagram showing cone
excitation by stimuli of equal luminance. Journal of the Optical Society of
America, 69, 1183-1185.
Marimont, D. H. & Wandell, B. A. (1994). Matching color images: The effects of axial
chromatic aberration. Journal of the Optical Society of America A, 11, 3133-3122.
McLellan, J. S., Marcos, S., Prieto, P. M. & Burns, S. A. (2002). Imperfect optics may be
the eye’s defence against chromatic blur. Nature, 417, 174-176.
McLellan, J. S., Prieto, P. M, Marcos, S. & Burns, S. A. (2006). Effects of interactions
among wave aberrations on optical image quality. Vision Research, 46, 3009-3016.
Nam, J., Rubinstein, J. & Thibos, L. (2010). Wavelength adjustment using an eye model
from aberrometry data. Journal of the Optical Society of America A, 27, 1561-1574.
Packer, O. & Williams, D.R. (2003). Light, the retinal image, and photoreceptors. In The
Science of Color (2nd edition). S. K. Shevell, ed. Elsevier:Oxford, pp. 41-102.
Poirson, A. B & Wandell, B. A. (1993). Appearance of colored patterns: pattern-color
separability. Journal of the Optical Society of America A, 10, 2458-2470.
aberrations of the human eye in a large population. Journal of the Optical Society of America A, 18, 1793-1803.
Ravikumar, S., Thibos, L. N. & Bradley, A. (2008). Calculation of retinal image quality
for polychromatic light. Journal of the Optical Society of America A, 25,
2395-2407.
Roorda, A. (2002). Human Visual System - Image Formation. In The Encyclopedia of
Imaging Science and Technology, Vol. 1. J. P. Hornak, ed. John Wiley & Sons:
New York, pp. 539-557.
Roorda, A. & Glasser, A. (2004). Wave aberrations of the isolated crystalline lens.
Journal of Vision, 4(4), 250-261.
Roorda, A. & Williams, D. R. (1999), The arrangement of the three cone classes in the
living human eye. Nature, 397, 520-522.
Salmon, T. O. & van de Pol, C. (2006). Normal-eye Zernike coefficients and
root-mean-square wavefront errors. Journal of Cataract and Refractive Surgery, 32,
2064-2074.
Smith, G. (1995). Schematic eyes: history, description and applications. Clinical and
Experimental Optometry, 78, 176-189.
Smith, V. C. & Pokorny, J. (1975). Spectral sensitivity of the foveal cone photopigments
between 400 and 500 nm. Vision Research, 15, 161-171.
Thibos, L.N. (2009). Retinal image quality for virtual eyes generated by a statistical model
of ocular wavefront aberrations. Ophthalmic and Physiological Optics, 29, 288-291.
Thibos, L. N. & Bradley, A. (1999). Modeling the refractive and neuro-sensor systems of
Thibos, L. N., Bradley, A. & Hong, X. (2002). A statistical model of the aberration
structure of normal, well-corrected eyes. Ophthalmic and Physiological Optics, 22,
427-433.
Thibos, L. N., Hong, X., Bradley, A. & Cheng, X. (2002). Statistical variation of
aberration structure and image quality in a normal population of healthy eyes.
Journal of the Optical Society of America A, 19, 2329-2348.
Thibos, L. N., Ye, M., Zhang, X. & Bradley, A. (1992). The chromatic eye: a new
reduced-eye model of ocular chromatic aberration in humans. Applied Optics, 31,
3594-3600.
Thibos, L. N., Ye, M., Zhang, X. & Bradley, A. (1993). A new optical model of the
human eye. Optics and Photonics News. 4:12, 12.
Williams, D. & Hofer, H. (2004). Formation and acquisition of the retinal image. In The
Visual Neurosciences, Vol. 1. L. M. Chalupa & J. S. Werner, eds. MIT Press:
Cambridge MA: pp. 795-810.
Williams, C. S. & Becklund, O. A. (1989). Introduction to the Optical Transfer Function.
New York: John Wiley & Sons.
Winn, B., Whitaker, D., Elliott, D. B. & Phillips, N. J. (1994). Factors affecting
light-adapted pupil size in normal human subjects. Investigative Ophthalmology &
Visual Science, 35, 1132-1137.
Zhang, X., Ye, M., Bradley, A. & Thibos, L.N. (1999). Apodization by the
Stiles-Crawford Effect moderates the visual impact of retinal image defocus. Journal of