HAL Id: hal-00789132
https://hal.archives-ouvertes.fr/hal-00789132
Submitted on 20 Feb 2013
HAL is a multi-disciplinary open access
archive for the deposit and dissemination of
sci-entific research documents, whether they are
pub-lished or not. The documents may come from
teaching and research institutions in France or
abroad, or from public or private research centers.
L’archive ouverte pluridisciplinaire HAL, est
destinée au dépôt et à la diffusion de documents
scientifiques de niveau recherche, publiés ou non,
émanant des établissements d’enseignement et de
recherche français ou étrangers, des laboratoires
publics ou privés.
ANALYSIS AND IMPROVEMENT OF A PAIRED
COMPARISON METHOD IN THE APPLICATION
OF 3DTV SUBJECTIVE EXPERIMENT
Jing Li, Marcus Barkowsky, Patrick Le Callet
To cite this version:
Jing Li, Marcus Barkowsky, Patrick Le Callet. ANALYSIS AND IMPROVEMENT OF A PAIRED
COMPARISON METHOD IN THE APPLICATION OF 3DTV SUBJECTIVE EXPERIMENT.
IEEE International Conference on Image Processing, Sep 2012, Orlando, United States. pp.1-4.
�hal-00789132�
ANALYSIS AND IMPROVEMENT OF A PAIRED COMPARISON METHOD IN THE
APPLICATION OF 3DTV SUBJECTIVE EXPERIMENT
Jing Li, Marcus Barkowsky, Patrick Le Callet
LUNAM Universit´e, Universit´e de Nantes, IRCCyN UMR CNRS 6597
Polytech Nantes, rue Christian Pauc BP 50609 44306 Nantes Cedex 3, France
{jing.li2,marcus.barkowsky,patrick.lecallet}@univ-nantes.fr
ABSTRACT
Paired comparison is a frequently used method in psychophysical studies. However, with the increase of the number of the stimuli, the number of comparisons increases exponentially. Square design is one of the balanced sub-set paired comparison methods which could reduce the number of comparisons while producing comparably precise results under some assumptions. However, when there are observation errors from observers’ attentiveness, the square design would produce large estimation errors. Thus, an improved square design which is robust to observation errors is proposed. Using a Monte Carlo simulation, the proposed method is evaluated and shows improvement in efficiency. The original design is applied in a visual discomfort subjective test of 3DTV. In addition, both of the two designs are studied by utilizing our previous full comparison data. The test results showed that the proposed improved square design is more robust to observation errors. Another important finding is that the influence of the occurrence of some other stimuli on voting is significant. Whether the proposed method could reduce the prediction errors induced by it is still under study.
Index Terms— Paired comparison, square design, optimal selection, 3DTV, subjective experiment
1. INTRODUCTION
In the field of video quality measurement, subjective assessment is regarded as the most accurate method. There are already some classic subjective assessment method, e.g., DSIS, DSCQS, SSCQE, Paired Comparison method. Typically, in 3DTV related visual psychology experiments, since the viewer is not used to 3D television and thus has no reference to compare with as in the 2D condition, it might be difficult for the viewers to give an absolute psychophysical scale for the stimulus. Thus, the paired comparison method is a possible solution as observers seem to have less problems in responding to the question: “which one of these two 3D sequences do you prefer?” compared to answering “is the quality of this 3D sequence excellent / good / fair / poor / bad ?”.
However, there is a drawback for the paired comparison method. Suppose that there aret video stimuli in a subjective video quality assessment test, each stimulus has to be compared with every other one which will lead to t(t − 1)/2 comparisons. With the increase oft, the number of comparisons becomes large and thus, it becomes infeasible for application. Designs are therefore required
This work has been partly conducted within the scope of the JEDI (Just Explore Dimension) ITEA2 project which is supported by the French industry ministry through DGCIS and the PERSEE project which is financed by ANR (project reference: ANR-09-BLAN-0170).
which could reduce the number of comparisons without serious imbalance [1]. Generally speaking, the designs can be classified into non-adaptive and adaptive methods. For non-adaptive methods, each subject compares a part of the whole set of pairs, but for all subjects the comparisons are balanced [2] [3]. The basic idea of the adaptive methods is that comparisons between closer samples can produce more information than distant samples. Thus, in their methods, the closer pairs are compared more often than the distant pairs, and the total number of comparisons is quite small when compared with the complete method [4] [5].
Though designs that aim to reduce the number of comparisons have already been published, the application of these methods in the context of video quality assessment has to be validated in detail because there might be systematic errors that stem from the display and voting devices. In addition, observers introduce random errors related to their attentiveness on their votings whereas these published designs were often based on perfect theoretic situation. In this paper, a balanced sub-set method, namely, square design [3] was selected for study. According to the analysis on the characteristics of paired comparison based on Bradley-Terry model [6][7], an improved square design method is proposed. A Monte Carlo simulation was conducted to evaluate its performance, which showed that this method is more robust to the observation errors and more efficient when compared with the full paired comparison method. Then, the original square design was applied on a 3D visual discomfort subjective experiment. The subjective test results from the original square design indicates that the performance is very likely to be ruined by the occurrence of other stimuli and observation errors. Furthermore, both of the original square design and the proposed design were studied by utilizing our previous full comparison data [8]. It shows that when the test conditions are the same, the results from the proposed design method are more robust to observation errors.
This paper is organized as follows. In Section 2, the balanced sub-set paired comparison method will be briefly introduced. According to the analysis on the characteristics of paired comparison and square design, an improved square design is proposed in Section 3, which includes the simulation results. Then, a subjective experiment as well as the performances of both designs will be illustrated in Section 4. Section 5 concludes the paper.
2. BALANCED SUB-SET PAIRED COMPARISON METHOD
Since it is unwieldy to evaluate all pairs in paired comparison method, one possible way is to omit some pairs completely. Dykstra [3] proposed a “balanced sub-set” method, which means that for
certain pairs (i, j) the comparison numbers nij is 0 while for
all other pairs it is a constant nij = n. Each of the stimuli
has the same frequency of occurrence in the whole experiment. Dykstra developed four types of balanced sub-set design: “Group divisible designs”, “Triangular designs”, “Square designs” and “Cyclic designs”. The “Square design” is briefly repeated here.
Assuming the stimuli number t = s2, the square design is
constructed by placing thet stimuli into a square of size s. Only pairs which are in the same column or row are compared. For example, if there aret = 9 stimuli, stimulus 1, 2,...,t could be placed into a square matrix as following:
1 2 3 4 5 6 7 8 9
In this design, only the pairs among stimuli (1, 4, 7), (2, 5, 8), (3, 6, 9), (1, 2, 3), (4, 5, 6) and (7, 8, 9) are compared.
In square design, when the stimuli number is 9, the paired comparison number is 3×6=18, compared to 9×8/2=36 for the complete method. As this method only runs part of the pairs, there must be a loss of information. Dykstra gave a definition called “efficiency” to evaluate this method, which showed that this method was highly efficient in predicting the scores of the stimuli. For details, the reader could be referred to [3].
Though the “efficiency” of these balanced sub-set design are quite high, they are based on the assumption that there was no observation errors. This is usually not the case in the real application. In the next section, the influence of the observation errors on paired comparison will be introduced and thus an improved version will be proposed.
3. AN IMPROVED SQUARE DESIGN METHOD FOR PAIRED COMPARISON
3.1. Analysis on paired comparison based on Bradley-Terry model
For two stimulii and j, Pijis defined as the probability that stimulus
i is preferred to stimulus j, then, the distance between the quality of the two stimuliDij could be calculated by Bradley-Terry model
[6][7]: Dij = log Pij− log(1 − Pij) (1) Pij= 1 2 h 1 + tanh(Dij/2)i (2)
Supposing that there areN observers in a paired comparison test, for stimulusi and j, m observers prefer i to j, then the ratio pij = m/N is taken as the likelihood estimation of the preference
Pij. However, if one of the observers provides an erroneous vote, the
influence of this error on the estimation ofDij would be different.
Here we give an example. First, supposingm=1, N =10, pij= 0.1.
However, one of the observers made a mistake in the observation, thePijin fact should be 0.2. Thus, according to Eq.(1), the distance
between stimuli(i, j) should be 1.4 but the observation error makes it 2.2, the amount of change is 0.8. Then, supposingm=4, N =10, pij
= 0.4, while the truePijis 0.5. The distance between stimuli(i, j)
should be 0 while the observation error changes it to 0.4, the amount of change is 0.4. From this example it could be found that the same observation error would have different influence on the estimation of the distance of stimuli pairs. Nearby pairs will be influenced less than distant pairs. This conclusion could also be achieved from Fig. 1(a). 10 5 0 5 10 0 0.2 0.4 0.6 0.8 1
BT score distance Dij
Pi
j
(a) (b)
Fig. 1. (a) The relationship between thePijand the difference of BT
scores. (b) The proposed spiral for square design method.
In addition, when Dij is small, for example, Dij=0, the
correspondingPij=0.5, it could be considered that a small number
of comparisons could produce a reasonable estimate of the distance. However, whenDij is quite large, for example,Dij=7, according
to Eq.(2),Pij=0.9991, which means for a quite large number of
comparisons, the observers always give us an unanimous result. We could only expect after about 10000 times of comparisons the correct result could be obtained. This characteristic of paired comparison was also analyzed in [5].
For three adjacent stimuli A, B and C, if we want to obtain a good estimate of the distance between AC, it would be wise to compare AB and BC then get AC, rather than compare AC directly. In this way, the estimation error would be less with the same number of comparisons. Meanwhile, the influence of observation errors on estimation is smaller. Thus, the comparisons should be concentrated on the closer pairs rather than the distant pairs.
3.2. The proposed method
According to the analysis above, in the square design, the closer pairs should be placed in the same column or row. A possible and simple solution is shown in Fig. 1(b). The adjacent pairs could be arranged according to this spiral. The steps of our proposed method are:
1. Initialization of the square matrix. The position could be arranged randomly or according to the pre-test results. Afterwards, run paired comparisons.
2. Calculation of the estimated scores. Calculate the scores according to current paired comparison data and then put them in order.
3. Arrangement of the square matrix. Rearrange the positions of the stimuli according to their rankings, then run paired comparisons.
4. Repeat step 2 and 3, until certain conditions are satisfied. The main difference between the original square design and the proposed square design is that, for the proposed design the position of each stimulus changes according to the previous observation results, which could provide more precise information for the estimation.
3.3. Simulation results and discussions
To evaluate the improvement of the proposed method, a Monte Carlo simulation was conducted. 36 stimuli were designed whose scores were randomly selected from a uniform distribution on the interval of [1 5]. This design corresponds to the MOS used in video quality assessment. The simulation was conducted by the following assumptions: 1) each stimulus has a single score; 2) in
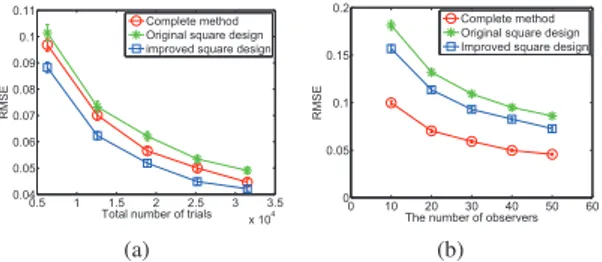
0.5 1 1.5 2 2.5 3 3.5 x 10⁴ 0.04 0.05 0.06 0.07 0.08 0.09 0.1 0.11
Total number of trials
R
MSE
Complete method Original square design improved square design
(a) 0 10 20 30 40 50 60 0 0.05 0.1 0.15 0.2
The number of observers
R
MSE
Complete method Original square design Improved square design
(b)
Fig. 2. The simulation results for 36 stimuli. In (a), the x-axis represents the total number of comparisons. In (b), the x-axis represents the number of observers. The y-axis is the RMSE. The error bars are the confidence intervals of the estimated scores. each observation, the observed value follows a gaussian distribution, the mean value is the stimulus score and the standard deviation is 0.7 (according to the subjective scores from VQEG HDTV-Final Report); 3) each observer has a 5% probability to make a mistake, i.e., inverting the vote; 4) each comparison is independent.
Three methods were chosen, the original square design (pairs are selected randomly), the improved square design and the complete (full comparison) method. The Bradley-Terry model was used to convert the raw data to scores. The RMSE between the estimated scores and the designed scores was calculated. The simulation was run 100 times.
The results are shown in Fig. 2. It shows that with the same number of comparisons, the original square design performs the worst, and the improved square design produces less estimation errors than the complete method. When the number of observers fixed, as shown in Fig. 2(b), the complete method could generate the most accurate estimated scores, the improved square design performs better than the original square design.
4. THE APPLICATION OF SQUARE DESIGN METHOD ON 3D VISUAL DISCOMFORT EXPERIMENT To evaluate the performance of the square design on real application, a visual discomfort experiment using the original square design method for 3DTV was conducted. The experimental setup and the planar motion stimuli were completely the same as our previous work [8][9], in which 45 naive observers participated in the test and the full paired comparison method was used.
4.1. Experimental setup and stimuli
32 naive viewers participated in this test. Besides the 15 planar motion stimuli used in our previous test, 21 other stimuli were added, including 5 static stimuli and 16 in-depth motion stimuli. In this study, they may help to analyze the influence of the occurrence of other stimuli on the paired comparison results. The only difference between the added stimuli and the planar motion stimuli was the motion direction.
4.2. Assessment method and procedure
The original square design method was applied on the subjective test. The 15 planar motion stimuli were randomly placed in the upper left 4×4 matrix. All the other positions, including the 16th of the upper left 4×4 matrix were randomly filled by the remaining stimuli. In this way, the upper left 4×4 matrix can be considered as a sub-square design for this experiment, which could be used to evaluate the square design method by comparing the 15 stimuli score
with our previous results. Stimuli 1-15 represent the planar motion stimuli, stimuli 16-36 represent the other stimuli. The positions of all stimuli in the matrix are:
3 4 5 15 25 34 13 11 1 9 16 31 10 8 6 14 23 24 7 12 2 19 22 26 21 33 17 30 27 18 29 20 28 36 32 35
Following the “Square design”, for example, stimulus 3 will be compared with stimuli 4, 5, 15, 25, 34, 13, 10, 7, 21, 29. Each stimulus will be compared with 10 other stimuli.
There were 180 pairs to be compared for each observer. The presentation order for voting the 180 paired comparisons was randomly permuted for each viewer.
4.3. Subjective experiment results
For better illustration, the current experiment which used the original square design is called “Exp2” and its results are denoted by Exp2 ORIG. Our previous visual discomfort experiment which used the full paired comparison method is called “Exp1”. The visual discomfort scores of the 15 planar motion stimuli could be considered as the ground truth and denoted byExp1 F U LL. We didn’t conduct a real subjective test using the proposed method as the subjective test results of the proposed square design could be generated by selecting optimal pairs from the data ofExp1. The experiment results of the proposed method by utilizing the data ofExp1 are denoted by Exp1 OP T . Similarly, we can get the results of the original square design from data ofExp1, which are denoted byExp1 ORIG. Please note that the number of observers is 45 forExp1 F U LL, and 32 for Exp1 OP T , Exp1 ORIG and Exp2 ORIG.
4.3.1. Comparison between subjective raw data
There are 42 pairs if only considering the planar motion stimuli pairs inExp2. Pij is defined as the probability that stimulusi is
preferred to stimulusj. The absolute differences of Pijbetween the
experiments using square designPsq
ij and the ground truthP gt ij could be calculated: Pij d= Psq ij − P gt ij (3) The histograms ofPij dfor Exp2 ORIG and Exp1 ORIG are
shown in Fig.3. It could be seen that in Fig.3(a), a large number of thePij are shifted about 0.04. Due to the fact that the differences
between these two experiments are: 1) more pairs are compared in Exp1 and 2) some other stimuli are occurred in Exp2, it could be concluded that one reason of this shift might be the influence of the interaction among the stimuli. Another possible reason might be the observation errors which came from observer’s misjudgement. As the data of Exp1 ORIG is taken completely from the full comparison data, the shift of thePij is quite small (as shown in
Fig.3(b)) which is just induced by the number of observers. The relationships ofPij d, true distanceDij, and the estimation
errorsDij dinExp2 are shown in Fig.4. As we already discussed
in Section 3.1, the estimation errors ofDij increase with thePij d
and theDij. For any pair, the larger the observation error, the larger
the estimation error on the distance of the two stimuli forming the pair. However, the influence also depends on the distance of the two stimuli: The influence of the observation error on the estimation of distant pairs will be larger than the influence on closer pairs.
0.050 0 0.05 0.1 0.15 0.2 0.25 0.3 1 2 3 4 5 6 7 8 9
Absolute difference of Pij between two experiments
T o ta l n u mb e r Histogram (a) !0.050 0 0.05 0.1 0.15 0.2 1 2 3 4 5 6 7 8 9
Absolute difference of Pij between two experiments
T o ta l n u mb e r Histogram (b)
Fig. 3. The histograms of Pij d for (a) Exp2 ORIG and (b)
Exp1 ORIG. 0 0.05 0.1 0.15 0.2 0 2 40 0.5 1 1.5 2 2.5 P ij_d True D ij Est ima ti o n e rro rs o n D ij
Fig. 4. The relationship ofPij d,Dij, and the estimation errors.
4.3.2. Evaluation of the two square designs
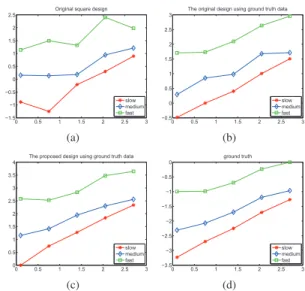
The Bradley-Terry scores of all experiments are shown in Fig. 5. The RMSE between the predicted scores and the ground truth for Exp2 ORIG, Exp1 ORIG, Exp1 OP T are 0.2159, 0.0759 and 0.0543, respectively.
The experiment results indicate that when there are large errors onPij, the results from original square design are quite noisy as
shown in Fig.5(a). When the viewing conditions are the same, as shown in Fig.5(b) and Fig.5(c), the proposed square design performs slightly better than the original design. The RMSE is about 0.02 less than the original design, which is in accordance with the simulation results. Thus, it could be concluded that the proposed method could generate more accurate results than the original one when there are observation errors. However, the performance of the proposed method to deal with errors that stem from the influence of other stimuli is under study.
5. CONCLUSIONS
In this paper, we proposed an improved square design method which could generate more accurate results while using a small number of comparisons. Through the analysis on the original square design method we discovered that it would not perform well when there were observation errors. Thus, an improved square design method is proposed based on the analysis that more comparisons on nearby pairs could generate accurate and efficient results. The simulation results show that the proposed square design give very impressive results. The original square design is applied on a visual discomfort experiment. Additionally, both of the original and the proposed square design using our previous full comparison data are studied as well. The results show that the proposed method performs better than the original one when there are observation errors. Furthermore, we find that the influence of the occurrence of other stimuli on the paired comparison results is significant. Whether our proposed method could effectively reduce the prediction errors that stem from this situation is still under investigation. Additionally, the study on the improvement of the proposed design by searching an optimal
0 0.5 1 1.5 2 2.5 3 !1.5 !1 !0.5 0 0.5 1 1.5 2 2.5
Original square design
slow medium fast (a) 0 0.5 1 1.5 2 2.5 3 !0.5 0 0.5 1 1.5 2 2.5 3
The original design using ground truth data
slow medium fast (b) 0 0.5 1 1.5 2 2.5 3 0 0.5 1 1.5 2 2.5 3 3.5 4
The proposed design using ground truth data
slow medium fast (c) 0 0.5 1 1.5 2 2.5 3 !3.5 !3 !2.5 !2 !1.5 !1 !0.5 0 ground truth slow medium fast (d)
Fig. 5. The Bradley-Terry scores for planar motion stimuli. X-axis represents the relative disparity (degree) between the object and background. Y-axis represents the Bradley-Terry scores. Different lines represent different velocity levels. (a)Exp2 ORIG. (b) Exp1 ORIG. (c) Exp1 OP T . (d) Exp1 F U LL(ground truth). solution for the arrangement of the square matrix is ongoing.
6. REFERENCES
[1] J. A. John, “Reduced group divisible paired comparison designs,” The Annals of Mathematical Statistics, pp. 1887–1893, 1967.
[2] J.W. Wilkinson, “An analysis of paired comparison designs with incomplete repetitions,” Biometrika, vol. 44, no. 1/2, pp. 97–113, 1957.
[3] O. Dykstra, “Rank analysis of incomplete block designs: A method of paired comparisons employing unequal repetitions on pairs,” Biometrics, vol. 16, no. 2, pp. 176–188, 1960.
[4] M.E. Glickman and S.T. Jensen, “Adaptive paired comparison design,” Journal of statistical planning and inference, vol. 127, no. 1-2, pp. 279–293, 2005.
[5] D. Amnon Silverstein and Joyce E. Farrell, “Quantifying Perceptual Image Quality.,” in PICS’98, 1998, pp. 242–246. [6] R.A. Bradley and M.E. Terry, “Rank analysis of incomplete
block designs: I. the method of paired comparisons,” Biometrika, vol. 39, no. 3/4, pp. 324–345, 1952.
[7] R.A. Bradley, “14 Paired comparisons: Some basic procedures and examples,” Handbook of statistics, vol. 4, pp. 299–326, 1984.
[8] J. Li, M. Barkowsky, and P. Le Callet, “The influence of relative disparity and planar motion velocity on visual discomfort of stereoscopic videos,” in The third International Workshop on Quality of Multimedia Experience (QoMEX2011). 2011, pp. 155–160, IEEE.
[9] J. Li, M. Barkowsky, J. Wang, and P. Le Callet, “Study on visual discomfort induced by stimulus movement at fixed depth on stereoscopic displays using shutter glasses,” in 17th International Conference on Digital Signal Processing (DSP). IEEE, 2011, pp. 1–8.