Do Immigrants Cause Crime?
∗Milo Bianchi
Paris Dauphine University
Paolo Buonanno University of Bergamo Paolo Pinotti
Bank of Italy November 2010
Forthcoming in the Journal of the European Economic Association
Abstract
We examine the empirical relationship between immigration and crime across Italian provinces during the period 1990-2003. Drawing on police administrative records, we first document that the size of the immigrant population is positively correlated with the incidence of property crimes and with the overall crime rate. Then, we use instrumental variables based on immigration toward destination countries other than Italy to identify the causal impact of exogenous changes in Italy’s immigrant population. According to these estimates, immigration increases only the incidence of robberies, while leaving un-affected all other types of crime. Since robberies represent a very minor fraction of all criminal offenses, the effect on the overall crime rate is not significantly different from zero.
Keywords: Immigration, crime. JEL codes: F22, J15, K42, R10.
∗
Contact information: [email protected], [email protected], [email protected] (corresponding author). We wish to thank the Editor and three anonymous Referees for very constructive feedback on an earlier version of this paper. We also thank Massimiliano Bratti, Matteo Cervellati, Antonio Ciccone, Federico Cingano, Francesco Drago, Andrea Ichino, Giovanni Mastrobuoni, Ugo Melchionda, Franco Peracchi, Alfonso Rosolia, Andrea Tiseno and seminar participants at the Bank of Italy, CEIS Tor Vergata, IMT Lucca, Paris School of Economics, University of Milan, University of Modena and Reggio Emilia, ESPE (London), NASM (Pittsburgh), FEMES (Singapore), EEA (Milan), AIEL (Brescia), Brucchi Luchino Work-shop (Bologna) for their useful comments, Giuseppe Casamassima of the Italian Ministry of the Interior for providing the data on residence permits and Giovanni Peri for the data on bilateral migration flows. All errors are our responsibility. Financial support from CEPREMAP and from Region Ile-de-France (Milo Bianchi) is gratefully acknowledged. The opinions expressed herein are those of the authors and do not necessarily represent those of the Bank of Italy.
1
Introduction
Immigration is a contentious issue in all destination countries for at least two reasons. First, worker flows from countries characterized by a different composition of the labor force may have significant redistributive consequences for the native population. Second, there are widespread concerns that immigrants increase crime rates. While the economic literature has devoted much attention to the first issue, the second one has remained largely unexplored.
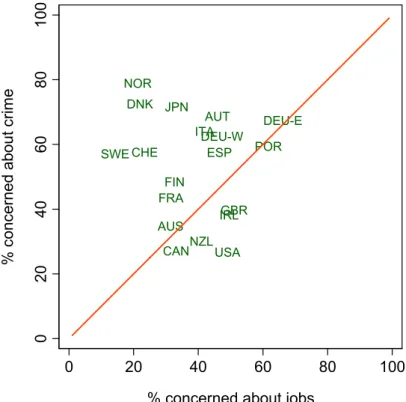
However, citizens and policymakers in recipient countries seem more concerned about the impact of immigrants on crime. Figure 1 shows the results of the National Identity Survey carried out in 1995 and 2003 by the International Social Survey Programme. It clearly emerges that, within OECD countries, the majority of the population is worried that immigrants increase crime rates. In most cases this fraction is greater than that of people afraid of being displaced from the labor market.
In this paper we investigate the empirical relationship between immigration and crime across Italian provinces during the period 1990-2003. As we discuss in the next section, this sample displays some interesting features for the purpose of our analysis. First, the dramatic increase in Italy’s immigrant population was mainly driven by political turmoil in neighboring countries, which provides a source of exogenous variation to address causality from immigra-tion to crime. Second, Italian authorities have implemented several massive regularizaimmigra-tions of previously unofficial immigrants, which allow us to assess the extent of measurement errors induced by immigrants who reside in Italy without holding a valid residence permit.
In Section 3 we present the results of OLS regressions. The identification of the effect of immigration on crime relies on within-province changes in both variables, controlling for other determinants of criminal activity and for year-specific unobserved shocks. This two-way fixed effects specification also removes errors in the measurement of immigration and crime (due to unofficial immigrants and non-reported crimes) that are constant within provinces or years. According to these estimates, a 1% increase in the immigrant population is associated with a 0.1% increase in the total number of criminal offenses. Once we distinguish between categories of crime, the effect seems particularly strong for property crimes.
In Section 4 we ask whether this evidence can be attributed to a causal effect of immigra-tion on crime. In particular, the locaimmigra-tion choice of immigrants could respond to unobserved factors that are themselves correlated with crime; as a result, OLS estimates may be bi-ased. To solve this problem, we exploit differences in the intensity of migration across origin countries as a source of (exogenous) variation in the distribution of immigrants in Italy. In particular, we use changes in the immigrant population in the rest of Europe as an instrument for changes in immigration across Italian provinces. Our identification strategy relies on the fact that the supply-push component of migration by nationality is common to flows toward all destination countries. At the same time, flows toward the rest of Europe are exogenous to demand-pull factors in Italian provinces. Variation across provinces of supply-driven shifts
in the immigrant population results from differences in the beginning-of-period distribution of immigrants by origin country.
After taking into account the endogeneity of immigration, we find that the effect on total or property crime is not significantly different from zero. When we examine different types of property crime, we only find an effect on robberies. These are a very small fraction of crimes, which is why we do not find an effect on total crime rates.
The reported difference between the OLS and IV results may be explained either by a lack of causal effect or by a higher asymptotic variance of two-stage estimates. Our findings strongly support the former explanation. The second-stage estimated coefficient is in fact always close to zero and decreases even further as we enhance the explanatory power of the instrument by allowing for a non-linear relationship in the first-stage. In addition to that, we perform a number of other robustness checks. We account for possibly heterogeneous effects across nationalities; we apply different methods to estimate the population of irregular immigrants; and we allow for spatial correlation of provincial crime rates. Our results are remarkably stable; again, they do not reveal any causal effect of immigration on crime.
This paper is related to the empirical literature on the effects of immigration in the host countries. This lively research area has emphasized the labor market competition between immigrants and natives (surveys include Borjas, 1994; Friedberg and Hunt, 1995; Bauer and Zimmermann, 2002; Card, 2005) and the effects of immigration on fiscal balances (Storeslet-ten, 2000; Lee and Miller, 2000; Chojnicki et al., 2005). We contribute to this literature by estimating the effect of immigration on crime.
A few previous papers have investigated the existence of this relationship in the United States. At the micro level, Butcher and Piehl (1998b, 2005) find that current immigrants have lower incarceration rates than natives, while the pattern is reversed for the early 1900s (Moehling and Piehl, 2007). At the aggregate level, Butcher and Piehl (1998a) look at a sample of U.S. metropolitan areas over the 1980s and conclude that new immigrants’ inflows had no significant impact on crime rates. Finally, Borjas et al. (2010) argue that recent immigrants have contributed to the criminal activity of native black males by displacing them from the labor market. We complement these findings by providing the first available evidence on a European country in which, as suggested by Figure 1, crime concerns are more widespread and, therefore, they are likely to play a greater role for the setting of immigration restrictions.1
1
Card et al. (2009) provide detailed evidence on the importance of crime perceptions and more generally of a broad class of concerns, so-called compositional amenities, in shaping attitudes towards immigration policies.
2
Immigration and crime in Italy
2.1 Conceptual framework
From a theoretical viewpoint, there are several reasons to expect a significant relationship between immigration and crime. First, if immigrants and natives have different crime propen-sities, immigration will directly affect crime rates. According to the economic theory of crime (Becker, 1968; Ehrlich, 1973), this may happen because immigrants and natives face different legitimate earning opportunities, different probabilities of being convicted and different costs of conviction. Indeed, LaLonde and Topel (1991) and Borjas (1998) document that immi-grants in the U.S. experience worse labor market conditions, which would predict a higher crime propensity. At the same time, Butcher and Piehl (2005) stress that the punishment immigrants face includes also the risk of deportation, and this risk may be a powerful de-terrent to criminal activities. They show that a broadening of the set of crimes for which immigrants could be deported, as it was implemented in the U.S. in the 1990s, affected both the type of immigrants and their behavior once in the country.
Second, immigration may affect crime rates as a result of natives’ response to the inflows of immigrants. Borjas et al. (2010) show in fact that U.S. natives (particularly black males) increased their criminal activities in response to labor market competition with immigrants. The overall direction of these different effects is often difficult to determine a priori, hence identifying the relationship between immigration and crime is ultimately an empirical issue. This appears to be the case in the Italian context too. Immigrants in Italy earn signif-icantly less than natives, partly due to the fact that they are disproportionally young and low skilled: as of 2000, 65% of immigrants were between 18 and 39 years old, 54% were male and 85% of them had no (recognized) education (Del Boca and Venturini, 2003). In addition to that, immigrants also experience worse labor market outcomes than natives with similar (observable) individual characteristics: Del Boca and Venturini (2003) estimate that about one third of the average wage differential between immigrants and natives cannot be explained by different workers’ characteristics. Therefore, different demographic characteris-tics and lower legitimate earning opportunities would predict that immigrants in Italy have a higher propensity to commit crime than natives.
There are however other effects which may decrease immigrants’ crime propensity. In particular, immigrants in Italy experience a significantly higher cost of crime than natives because of a greater probability of incarceration (conditional on having committed an offense). According to the Italian Ministry of Justice, as of 2007 only 34% of immigrants in prison served a definitive sentence, while the opposite pattern holds for natives.2 Moreover, even after a definitive sentence, they typically have less access to alternative measures such as home detention, due to the fact that immigrants are often unable to exhibit an official domicile in the country.
Turning to natives’ response to immigration, the mechanism proposed by Borjas et al. (2010) may be less of an issue in our context. Immigrants do not appear to have a negative impact on natives’ wages or employment opportunities; if anything, complementarities have been documented in the Italian labor market (see Del Boca and Venturini, 2003, for a review). This is of course just one possible mechanism; we return to natives’ response to immigration in Sections 5 and 6.
2.2 Data and measurement issue
We assembled data on immigration and crime for all 95 Italian provinces during the period 1990-2003. Italian provinces correspond to level 3 in the Eurostat Nomenclature of Territorial Units for Statistics (NUTS) classification; they are comparable in size to U.S. counties. In 1995, eight new provinces were created by secession. In order to keep our series consistent, we attribute their post-1995 data to the corresponding pre-1995 province.
2.2.1 Crime rates
Our measure of criminal activity is the number of crimes reported by the police to the judiciary authority over the total province population, published yearly by Italy’s National Institute of Statistics (ISTAT). Reported crimes are disaggregated by type of criminal offense: violent crimes, property crimes (robbery, common theft, car theft) and drug-related crimes. Availability of these data determined our sample period. In 2004, in fact, a new national crime recording standard was adopted, implying a lack of comparability of data before and after that year (ISTAT, 2004, p.27).
Reported crimes underestimate the true (unobserved) number of committed crimes, which may bias econometric estimates of the effect of those determinants of criminal activity that are correlated with the extent of under reporting. This problem is well known in the crime literature and it is usually dealt with by taking logarithms of crime rates and exploiting the panel structure of data to include fixed effects for geographical areas and time periods; see, for instance, Ehrlich (1996), Levitt (1996), Gould et al. (2002), Oster and Agell (2007) and Foug`ere et al. (2009). This approach sweeps out measurement errors that are constant within geographical areas (over time) or within periods (across areas). This is most likely the case for many sources of under reporting (e.g. law enforcement, culture, etc.), which in turn implies that
crime∗it= θi+ θt+ crimeit, (1)
where crime∗itand crimeit are the logarithms of actual and reported crimes over the popula-tion in province i and year t, respectively, and θi and θt are province and year fixed effects. Therefore, we will use crimeit as a proxy for the true (unobserved) crime rate. Accordingly, total, violent, property and drug will denote the logarithms of reported crimes over the total population for each category of criminal offense.
2.2.2 Immigration
The first law regulating the inflows of foreigners was approved in 1990 and subsequently amended in 1998 and 2002. Throughout this period, Italian migration policy has remained grounded on the residence permit, which allows the holder to stay legally in the country for a given period of time. We have drawn directly on police administrative records for recovering the number of valid residence permits over the population, which will serve as our measure of immigration.
This measure neglects the presence of unofficial immigrants, who reside in the country without holding a valid residence permit. Most importantly, correlation of unofficial immi-gration with the level of criminal activity would lead to a bias in the estimates of the effect of immigration on crime. However, the combination of logarithms and fixed effects may attenu-ate the influence of this source of measurement error too. Analogously to the case of crime, if official immigrants are proportional to total immigrants and the constant of proportionality is the product of province- and year-specific constants, it follows that
migr∗it= µi+ µt+ migrit, (2)
where migrit∗ and migrit are the logarithms of total and official immigrants over the popula-tion, respectively, and µi and µt are province and year fixed effects.
Regularizations of previously unofficial immigrants provide us with the opportunity to assess the accuracy of this approximation. In these occasions, unofficial immigrants already residing in Italy can apply for a valid residence permit. The last three regularizations took place in 1995, 1998 and 2002, and involved 246, 217 and 700 thousand individuals, respec-tively. The acceptance rate of applications was always close to 100%, so that foreigners had clear incentives to report their irregular status. Hence, under reporting may be less serious and less correlated with other variables than in survey data and in apprehension statistics.3
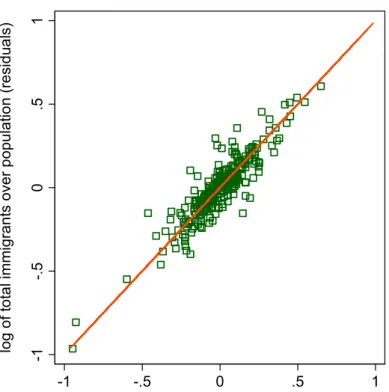
Therefore, we extracted from police administrative archives also the number of applica-tions for regularization in each province. These data allowed us to reconstruct the log of total (official plus unofficial) immigrants over province population in the three years in which there was a regularization. The relationship between migr∗itand migritin (2) (net of province and year fixed effects) is presented in Figure 2. The OLS estimated coefficient of migrit is very close to 1; the R2 coefficient is 99%. These two findings confirm that logarithms and fixed effects remove most of the measurement error induced by the use of official immigrants only. Since total immigrants would be unobserved out of regularization years, we will use the (log of) official immigrants instead.4
3
In any case, all these alternative measures of unofficial immigration are strongly correlated with each other, as we discuss further in Section 5.
4
In Section 5, we show that our results are robust to different assumptions about the stock of irregular immigrants out of regularization years.
2.3 Trends in immigration and crime
Over the period 1990-2003, the number of residence permits rose by a factor of 5, from 436,000 (less than 1% of the total population) to over 2.2 million (4% of the population). This dramatic increase was mainly driven by the collapse of the Soviet Union and the Balkan Wars (Del Boca and Venturini, 2003). Indeed, immigration from Eastern Europe grew at a rate of 537%, as compared with 134% from Northern Africa and 170% from Asia. Moreover, within Italy, immigrants tend to settle where immigrants of the same nationality are relatively more numerous. During our sample period, provinces which experienced the highest growth of immigration were in the North-East of Italy, where the initial share of immigrants from Eastern Europe was also higher.5 Accordingly, in our empirical specification, we exploit the role of external factors in origin countries and of migration networks to identify the causal effect of immigration on crime.
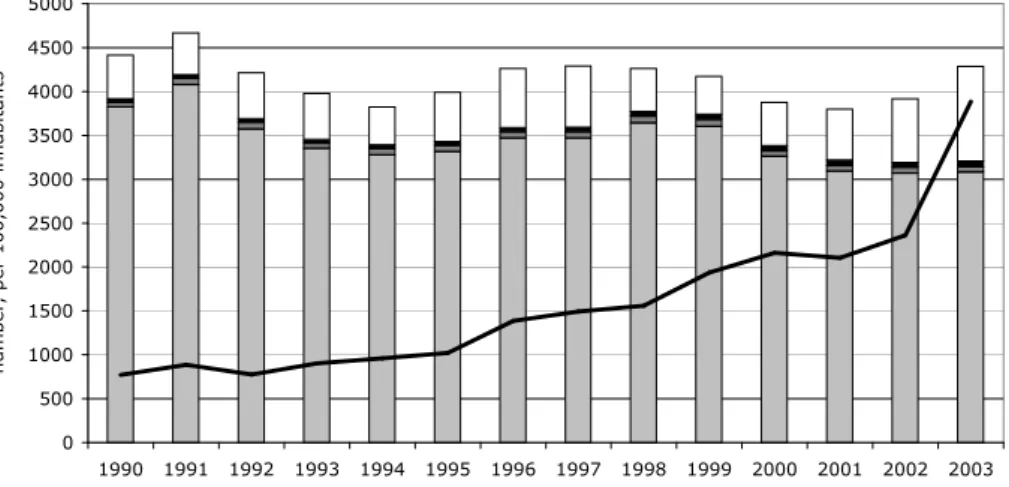
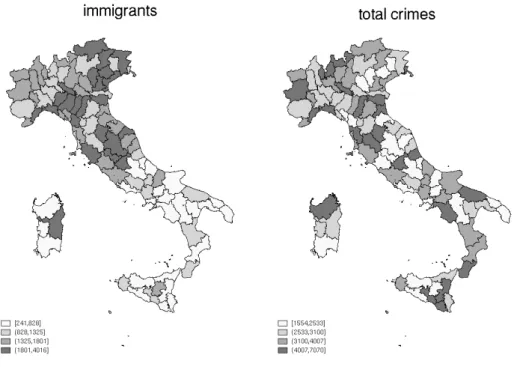
During the same period, the level of criminal activity did not display any significant trend. At a first glance, therefore, the two variables do not appear to be systematically correlated over time (Figure 3). On the other hand, immigration is positively correlated with crime across provinces (Figure 4). However, this finding could be due to the fact that both variables respond to other (omitted) factors. For instance, higher wealth in Northern Italy seems to encourage both immigration and property crimes, which represent 83% of all criminal offenses in our sample. In the next section we move beyond these simple correlations and into multivariate econometric analysis.
3
Panel analysis
Identifying the effect of migration on crime requires to control for other factors that may affect both variables. Taking into account the measurement issues discussed in the previous section, our main estimating equation is
crimeit= βmigrit+ γ0Xit+ φi+ φt+ εit, (3)
where crimeit is the log of the crime rate reported by the police in province i during year t; migrit is the log of immigrants over population; Xit is a set of control variables; φi and φt are province and year fixed effects; finally, εit is an error term. We are mainly interested in identifying the coefficient β.
The set of observables Xit comprises demographic and socioeconomic determinants of crime.6 Demographic variables include the log of resident population in the province, pop.
5Roughly, in 1990, provinces with the highest shares of immigrants from East Europe were in the North
(Gorizia, Trieste, Udine); immigrants from North Africa were relatively more represented in the South (Tra-pani, Agrigento, Ragusa); immigrants from Asia were more in Central Italy (Perugia, Florence, Rome).
6
Freeman (1999), Eide et al. (2006) and Dills et al. (2008) review the empirical literature on the determi-nants of crime.
Since equation (3) includes province fixed effects, pop implicitly controls for population den-sity, which is considered a key determinant of the level of criminal activity (Glaeser and Sacerdote, 1999). For the same reason, we also include the share of the population living in cities with more than 100,000 inhabitants, urban. Finally, since young men are said to be more prone to engage in criminal activities than the rest of the population (Freeman, 1991; Levitt, 1998; Grogger, 1998), we add the percentage of men aged 15-39, male1539.
Turning to the socioeconomic variables, we include the (log of) real GDP per capita, gdp, and the unemployment rate, unemp, which measure the legitimate and illegitimate earning opportunities (Ehrlich, 1973; Raphael and Winter-Ember, 2001; Gould et al., 2002). As a proxy for the expected costs of crime, we follow Ehrlich (1996) in using the clear-up rate, defined as the ratio of crimes cleared up by the police over the total number of reported crimes (by type of offense). The political orientation of the local government may also affect the amount of resources devoted to crime deterrence (while being at the same time correlated with immigration restrictions at the local level).7 Therefore, we include the variable partisan, which takes on higher values the more the local government leans toward the right of the political spectrum. Finally, fixed effects control for other unobserved factors that do not vary within provinces or years, including the constants θ’s and µ’s in equations (1) and (2), respectively.
Detailed definitions and sources for all variables are presented in the Appendix. Table 1 shows some descriptive statistics and Table 2 reports the correlation matrix among all dependent and explanatory variables. The univariate correlation between immigration and crime rates is positive for all types of crime.
OLS estimates on equation (3) are presented in Table 3 and suggest that the total crime rate is significantly correlated with the incidence of immigrants in the population. This relationship is robust to controlling for other determinants of crime. According to these findings, a 1% increase in the immigrant population is associated with a 0.1% increase of total crimes.
Distinguishing between types of crime, the effect is driven by property crimes, while violent and drug-related crimes are unaffected by immigration. In order to better uncover this relationship, in columns (5)-(7), we disaggregate property crimes further. It turns out that immigration increases the incidence of robberies and thefts. Since the latter represent about 60% of total crimes in our sample, the relationship between immigration and property crimes may be the main channel through which immigrants increase the overall crime rate.
However, there could be several reasons why the size of the immigrant population is sys-tematically correlated with property crimes, some of which may not be adequately captured by control variables. Therefore, identifying causality requires a source of exogenous variation in the immigrant population, an issue that we tackle in the next section.
7
The distribution of residence permits across provinces is decided on a yearly basis by the government in accordance with provincial authorities.
4
Causality
Even after controlling for other determinants of crime and for fixed effects, the distribution of the immigrant population across provinces could be correlated with the error term for several reasons. First, our set of controls could neglect some time-varying, possibly unobserved demand-pull factors that are also correlated with crime. For instance, improvements in labor market conditions that are not adequately captured by changes in official unemployment and income could increase immigration and decrease crime, which would bias OLS estimates downward. On the other hand, economic decline could attract immigrants to some areas (e.g. because of lower housing prices) where crime is on the rise, which would bias OLS estimates upward. Finally, changes in crime rates across provinces could themselves have a direct effect on immigrants’ location.
4.1 Methodology
In order to take these concerns into account, we adopt an instrumental variable approach that uses the (exogenous) supply-push component of migration by nationality as an instrument for shifts in the immigrant population across Italian provinces. Supply-push factors are all events in origin countries that increase the propensity to emigrate; examples include economic crises, political turmoil, wars and natural disasters (Card, 1990; Friedberg, 2001; Angrist and Kugler, 2003; Munshi, 2003; Saiz, 2007). Since these are both important in determining migration outflows and independent of regional differences within the host country, they have often been used as a source of exogenous variation in the distribution of the immigrant population.
Following the approach pioneered by Card (2001), several papers have constructed outcome-based measures of supply-push factors using total migration flows by nationality toward the destination country of interest (in our case, Italy); variation of the instrument results from differences in the beginning-of-period composition by nationality of the immigrant popula-tion across different areas within the destinapopula-tion country (see, for instance, Ottaviano and Peri, 2006; Cortes, 2008; Card, 2009). The predictive power of the instrument exploits the fact that new immigrants of a given nationality tend to settle into the same areas as previ-ous immigrants from the same country (see e.g. Munshi, 2003; Jaeger, 2006; McKenzie and Rapoport, 2007). For the same reason, however, total inflows by nationality could still be correlated with local demand-pull factors. As an extreme case, if all immigrants from a given country moved to the same Italian province, it would be impossible to disentangle push and pull factors based on total inflows by nationality.
To obviate this problem, our measure of supply-push factors will be based on bilateral migration flows toward destination countries other than Italy. As flows towards Italy represent only a minor fraction of flows towards other destination countries, this measure is likely to
be uncorrelated with shocks in a given Italian province.8 Specifically, we first take within-province differences of equation (3) and decompose ∆migrit= migrit− migrit−1 as
∆migrit≈ X
n
ωnit−1× ∆ ln M IGRnit− ∆popit, (4)
where ∆ ln M IGRnit is the log change of the stock of immigrants of nationality n in province i between period t − 1 and t; ∆popit is the log change of province population; finally, ωit−1n is the share of immigrants of nationality n over total immigrants residing in province i in period t − 1, ωit−1n = M IGRnit−1/P
n0M IGRn 0
it−1.
The first term on the right hand side of equation (4) is the weighted sum of the log changes of immigrants of each nationality into destination province i. These depend both on supply-push factors in each origin country (which affect that nationality in all provinces) and demand-pull factors in each province (which affect all nationalities in that province). In order to exclude the latter, we substitute ∆ ln M IGRnit with the log change of immigrants of nationality n in other destination countries, ∆ ln M IGRnt. Hence, we define the predicted log change of immigrants over population in each province as
\
∆migrit=X
n
ωit−1n × ∆ ln M IGRnt. (5)
Since demand-pull factors in other destination countries can be reasonably thought of as exogenous to variation in crime across Italian provinces, the correlation between ∆migrit and \∆migrit must be due solely to supply-push factors in origin countries.
4.2 Data
The weights in equation (5) are constructed according to the distribution of residence permits by nationality and province in year 1990. As an exogenous measure of supply-push factors by origin country one would ideally use total outflows toward the rest of the World excluding Italy. Unfortunately, such data are not generally available. As for European destinations, however, Eurostat provides extracts of 1991 and 2001 country censuses reporting, among other things, the number of foreign residents by country of birth. Though coverage is limited to the most relevant origin-destination cells, we were able to reconstruct the decennial (log) changes in 11 European countries for 13 foreign communities which are also heavily represented in Italy, accounting for 48% and 56% of Italian residence permits in 1991 and 2001, respectively. The detailed list of origin and destination countries used to construct the instrument is presented in Appendix B.
8
Consider for example the inflows from former Soviet Union and former Yugoslavia (the nationalities which grew the most in this period) towards respectively Rome and Vicenza (the Italian provinces which received most inflows from these nationalities). Rome accounted for only 2% of the total inflows from former Soviet Union towards EU countries and Vicenza accounted for only 1% of the total inflows from former Yugoslavia towards EU.
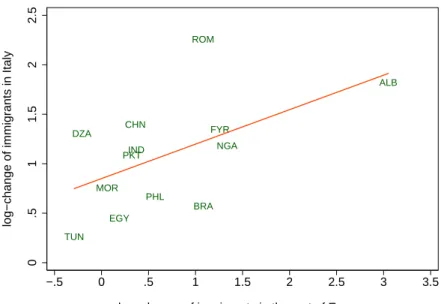
Of course, our instrument predicts actual immigration to Italy only to the extent that supply-push factors are important enough to drive similar patterns of immigration by na-tionality in Italy and in the rest of Europe. Figure 5 shows that this is actually the case. Weighting such push factors by the distribution of each nationality across provinces in 1990 (according to the formula in 5), we obtain indeed a statistically significant predictor for the actual changes in immigrant population across Italian provinces over the following decade. The univariate regression is
∆migrit= 0.671
(0.094)+ 0.673(0.178) \
∆migrit, R2 = 0.13,
where the numbers in parenthesis are the standard errors of the estimated coefficients.
4.3 Results
Once equipped with a source of exogenous variation for immigrant population we proceed to examine the causal content of the positive relationship between immigration and crime rates (through property crimes) depicted by the OLS estimates. Since the instrument in (5) is available as a cross section of ten-year changes between 1991 and 2001, we run all regressions on the within-province differences of equation (3) over the same period, including as regressors all control variables that were also included in the panel estimates presented in the previous section.
4.3.1 OLS and IV estimates
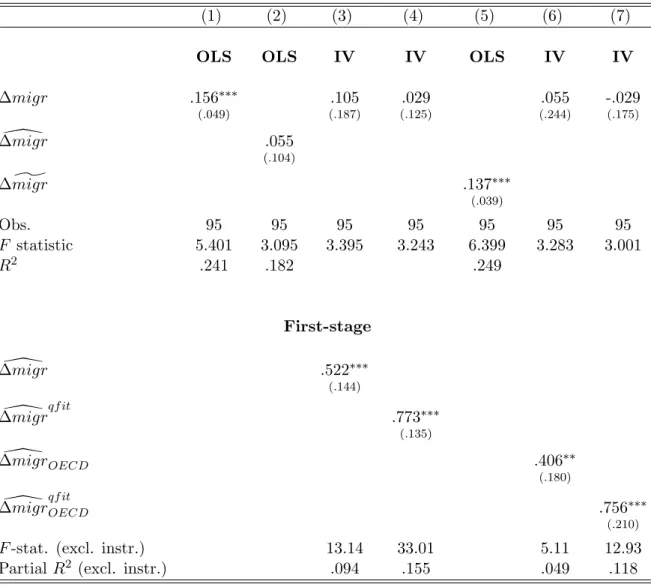
The results are reported in Tables 5-7. For the sake of comparability between OLS and IV, the first column of each table reports OLS estimates on the first-differenced equation, which are broadly consistent with the panel estimates using all years. Overall, immigration is associated with higher crime rates through a positive and statistically significant correlation with the incidence of property crimes. The magnitude of such effects is also very similar to the estimates reported in Table 3.
We notice however that the magnitude of these estimates drop significantly once our control variables are included. For example, the OLS estimated coefficient of ∆migrit on total crime is 0.19 if no control variables are included while it drops to 0.16 once we control for changes in provincial GDP (and to 0.156 once all controls are added, see Table 5 column 1). A similar drop is observed in the estimated effects on property crimes.9 This may be driven by the fact that positive changes in GDP are associated both with increased immigration and increased crime, especially property crime, which may in turn suggest that, due to omitted variables, the true (causal) effect of immigration on crime is considerably smaller than what implied by our OLS estimates.
In the next columns we then examine whether the above mentioned correlation reflects a causal effect of immigration on crime. In column (2) of Table 5 we start with a reduced form regression of (log-changes of) crime on the supply-push component of immigration growth. The estimated coefficient is not significantly different from zero. This may be due either to lack of a causal effect or to the fact that the correlation between actual and predicted changes in immigration is too low. In column 3 we adopt a two-stage-least-squares approach to distinguish between these two alternative explanations. According to the results, we cannot reject the null hypothesis that the coefficient of immigration in the second stage is not significantly different from zero.
However, such finding is not conclusive about causality, being driven both by the point estimate falling below the OLS coefficient and by a substantial increase in the estimated standard errors. Since the latter may signal low instrument relevance, we next investigate further the explanatory power of the instrument and the sensitivity of the results to changes in the first stage correlation between actual and predicted immigration.
4.3.2 Instrument relevance
If the first stage is weak, IV estimates may suffer from finite-sample bias and low asymptotic efficiency. Starting with the first issue, most tests relate the size of the distortion to the F-statistic testing the hypothesis that the coefficient of the excluded instrument is equal to zero in the first stage. In our case such statistic is equal to 13.14 (see the bottom panel of Table 5), which is above the value of 10 indicated by the literature on weak instruments (see, in particular Staiger and Stock, 1997; Stock et al., 2002).10
Turning to asymptotic efficiency, it is well known that the precision of IV estimates increases with the correlation between the instrument and the endogenous variable. One measure of such correlation is the partial R2 for the excluded instrument in the first stage, which is also reported on the bottom of Table 5. Nelson and Startz (1990) suggest that an instrument is likely to be weak if the (bias-corrected) partial R2 falls short of the inverse of the number of observations. According to this requirement, we can strongly reject that this is an issue in our case.11
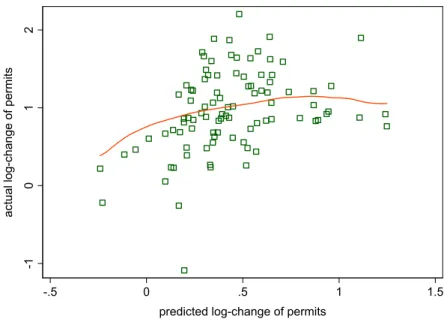
Still, it may be informative to examine the sensitivity of the results to a better fit in the first-stage. One simple way to achieve that consists in allowing for a non-linear relationship between ∆migr and \∆migr. The smoothing regression in Figure 6 suggests in fact that a quadratic polynomial may provide a better approximation of the relationship between the two variables (as opposed to a simple linear regression).
10
While such threshold is basically a rule-of-thumb provided for practical purposes, it is broadly consistent with detailed critical values tabulated by Stock and Yogo (2005). Such values are however not available for the just identified case.
11
The bias-corrected R2is defined as ((N − 1)R2− 2)/(N − 2), where N is the number of observations. The bias-corrected R2 in column (3) is 0.07 and the inverse of the number of observation is 0.01.
We thus compute the linear-quadratic prediction \∆migrqf it, based on the following re-gression ∆migrit= 0.429 (0.090)+ 2.073(0.305) \ ∆migrit− 1.359 (0.275) \ ∆migr2it, R2 = 0.24,
and use it as an instrument for ∆migr.12 The coefficient of the quadratic term is indeed negative and strongly statistically significant. One likely explanation is the existence of “con-gestion effects” of the kind discussed in Borjas (1994). Most importantly for our purposes, the R2 of the regression increases from 0.13 to 0.24. After including all control variables on the right-hand side, the partial R2 of the first-stage regression does also increase from 0.09 to 0.15 and, as a consequence, the standard errors in the second stage decrease by about one third (column 4 of Table 5). Interestingly, as the precision of the estimates improves, the es-timated coefficient of \∆migritdecreases further, from 0.10 to 0.03. This last finding suggests that the difference between IV and OLS estimates is not driven by the higher asymptotic variance of the former: the estimated coefficient in the second stage approaches zero when instrument relevance is highest (as reflected in the first stage F-statistics for the excluded instrument equal to 33), pointing at lack of a causal effect of immigration on crime.
4.3.3 Heterogeneous effects
Another possible explanation for the difference between OLS and IV estimates is that the latter are based on a subset of nationalities (i.e. those for which we found Census data in Eurostat). If the excluded nationalities had a higher propensity to commit crime than those included in the instrument, that could cause indeed the observed drop in magnitude and significance from OLS to IV.
We address this concern in two different ways. First, we run again the OLS regression after constructing a new measure of immigration, ∆ ]migr, which includes only those nationalities that are also included in the instrument. The results, reported in column (5), are very similar to those obtained considering all nationalities (column 1), suggesting that restricting to a subset of nationalities does not drive the difference between IV and OLS estimates.
The second robustness check consists in expanding the subset of nationalities included in the instrument. To overcome the limitations of our main source of data, we merge information from two alternative sources. Specifically, we first obtained the stock of immigrants by origin country from the Global Migrant Origin Database, maintained by the Migration Development Research Center at the University of Sussex. This data set reports the number of people by country of origin and destination, based on country censuses, for a wider set of countries than Eurostat; at the same time, it is available only for year 2001. We then reconstructed
12
Alternatively, we can insert both \∆migr and \∆migr2 directly into the first stage. When we do that, we obtain identical point estimates and standard errors, as well as an over-identifying restriction (not significantly different from zero according to the Sargan statistic). However, the number of over-identifying restrictions and degrees of freedom delivered by this alternative procedure are conceptually flawed because the source of exogenous variation is unique.
the beginning-of-period stocks in year 1991 by subtracting from the 2001 values the bilateral migration flows between 1991 and 2001, recently made available by Ortega and Peri (2009). In this way, we could compute the (log) change in the stock of migrants from 63 countries (or regions) toward 14 OECD countries. This is of course a crude approximation of the true change in the size of such communities, because we are neglecting outflows due to return migration.13 Measurement error might indeed be the reason why this instrument,
\
∆migrOECD, performs worse in the first stage; see the last two columns in Table 5. Yet, weak instrument diagnostics remain the safe region, at least when using the quadratic specification (column 7). Most importantly, the point estimate in the second stage is always very close to zero, suggesting that neither heterogeneous effects across nationalities nor higher standard errors explain the difference between OLS and IV results. Rather, the results in Table 5 suggest that the positive and significant OLS estimated coefficient does not reflect a causal effect of immigration on crime.
This conclusion is reinforced when we focus on the subset of property crimes, which parallel very closely those for the aggregate crime rate (Table 6). In particular, the positive and significant effect estimated by OLS is not confirmed by the instrumental variable analysis. When we further distinguish between different types of property crimes, the causal effect of immigration is positive and statistically significant only for robberies (Table 7), which vary approximately one-to-one (in percentage terms) with immigration.14 Yet, within our sample robberies represent only 1.8% and 1.5% of property and total crimes, respectively, which explains why the incidence of neither property nor total crimes is significantly related to immigration. Finally, the IV results for violent and drug-related crimes confirm the OLS estimates in excluding the existence of a significant relationship with immigration.15
5
Robustness
Our findings are subject to several caveats. First, one may be concerned with the measure-ment of immigrant population. Second, if both immigrants and natives have high mobility within the country, one may question the validity of estimates based on variation across provinces. We now examine each dimension in turn.
5.1 Measurement
A first issue concerns the size of unofficial migration to Italy. As discussed in Section 2, we used demands for regularization to infer the distribution of irregular immigrants, arguing that this approach minimizes under-reporting. In principle, however, one can not exclude
13
These may be up to to 10% of the total stock of immigrants; see the discussion in Ortega and Peri (2009).
14According to this estimate, a standard deviation increase in the log-change of immigrant population across
provinces between 1991 and 2001 (equal to 53%) would lead to 202 additional robberies (out of 413 in 1991).
15
that immigrants self-select into regularization, which would introduce measurement error into equation (2). In particular, if immigrants who are more at risk of committing crime are also less likely to apply for a regular permit, we would be understating immigrants exactly where they contribute the most to crime, which in turn would bias the coefficient of migr downward.
To address this concern, notice first that if both official and unofficial immigrants of the same nationality cluster into the same areas, then the IV approach adopted in Section 4 would attenuate any bias due to under reporting of unofficial immigrants. In fact, our instrument provides a measure for the predicted log change of total immigrants that depends solely on the geographic distribution of these clusters and the supply-push factors in origin countries. As a more direct check, we have considered a number of alternative ways to estimate irregular immigration. First, we looked at apprehensions of irregular immigrants (as recorded by Italian Ministry of the Interior, 2007), which do not depend on self-selection. Indeed, after controlling for province and year fixed effects (which are always included in our specifications) the log of apprehensions is positively and significantly related to the log of applications for regularization. In particular, the OLS estimated coefficient of the univariate regression is 0.35, the t-ratio is 3.87 and the R2 is 85%. Therefore, apprehension- and regularization-based measures of unofficial immigration seem consistent with each other. At the same time, regularizations provide a more representative picture of the phenomenon.16
As a further robustness check, we have estimated the immigrant population under al-ternative assumptions about the distribution of irregular immigrants out of regularization years.17 For example, one may think that irregular immigrants arrive in each province at the same rate in all years between two regularizations or, alternatively, they arrive at higher rates the closer it gets to the regularization year. Therefore, we have adopted either a uniform or an exponential specification for the growth rate of irregular immigrants: in the former case, it is constant in a given province between two regularization years, while in the latter it doubles in each period.18 The result of these estimates are presented in Table 8. Columns (1)-(3) consider the case of uniform growth; column (4)-(6) the case of exponential growth. For each method, we have reported both OLS and IV results. All these results appear very similar, both in magnitude and significance, to our previous estimates.
Another issue related to the measurement of immigration concerns its composition. So far we included all residence permits, regardless of the nationality, in order to avoid arbitrary
16
In 1995 there were less than 64,000 apprehensions and 260,000 demands for regularization; this ratio was 61,000 over 250,000 in 1998 and 106,000 over 700,000 in 2002
17
Fasani (2009) implements a similar approach.
18
Formally, suppose that in a given regularization year s the number of unofficial immigrants, estimated by the number of application for regularization, is IRRi,s and the previous regularization occurred in year
r. We estimate the total number of immigrants M IGRit in province i for each year t ∈ (r + 1, s) as the
sum of official immigrants and a fraction wt∗ IRRi,sof the unofficial ones. The weights wt are chosen such
that IRRi,t− IRRi,t−1 = IRRi,t−1− IRRi,t−2 for the uniform case and such that IRRi,t− IRRi,t−1 =
2(IRRi,t−1− IRRi,t−2) for the exponential case. Consistently with our previous analysis, our measure of
classifications. On the other hand, most crime concerns are directed toward immigrants from developing countries. While it is beyond the scope of this paper to investigate the relationship between nationality and propensity to commit crime, one may wonder whether adopting this broader definition introduces error in the measurement of those immigrants that could be more at risk of committing crime.19 Therefore, we checked the robustness of our estimates to using only residence permits awarded to immigrants from developing countries (as defined by ISTAT). The results are presented in Table 9 (columns 1-3), and are remarkably similar to those obtained using all residence permits.
5.2 Methodology
Our empirical strategy is mostly based on the relation between immigration and crime across different areas within the same country, an approach that has a long tradition in the empirical literature on the effects of immigration in the labor market (see e.g. Card, 2001). Yet, such approach is sometimes criticized on the grounds that general equilibrium adjustments in native population would confound the comparison between areas with different levels of immigration; put differently, immigration would affect all areas at the same time, not just the one that actually receives immigrants (Borjas et al., 1996; Borjas, 2003). If this is the case, any effect on the crime rate would be measured by correlation over time at the country level rather than across provinces. As already pointed out, however, Figure 3 suggests that the relationship between immigration and crime is not significant at the national level (other than across provinces).
Another reason why cross areas comparisons may be uninformative is the mobility of criminals, which gives rise to spatial correlation in local crime data. In line with the literature on spatial econometrics and crime (Anselin, 1988; Gibbons, 2004; Zenou, 2003), we thus control for spatially lagged crime rates. These consist of weighted averages of crime rates in neighboring provinces. In particular, crime in each province is assumed to depend also on crime observed in any other province, weighted by the inverse of the distance between their respective capital cities. The results, presented in Table 9 (columns 4-6), are consistent with those in our baseline specification. Hence, spatial correlation does not affect our results. This is probably due to the fact that provinces are rather large geographical areas, so that crime trips occur within rather than across provinces.
19
This measurement issue is particularly relevant for Italy. In our sample, about 85% of all immigrants from outside developing countries came from the U.S. and Switzerland. These are very specific groups: the first includes mostly U.S. military servants, the second Swiss citizens who commute daily between Switzerland and Italy.
6
Conclusions
In this paper, we investigated the causal impact of immigration on crime across Italian provinces during the 1990s. Our results do not support the widespread perception of a causal relationship between immigration and crime. Indeed, we find that neither the overall crime rate nor the number of most types of criminal offense are significantly related to the size of the immigrant population (once endogeneity is taken into account). These results leave many avenues for future research open, and we sketch only a few here.
First, our results raise the question of what determines the widespread perception of a link between immigration and crime. This issue is of the utmost importance given that such perceptions have far-reaching consequences for immigration policies (Bauer et al., 2000). Second, our analysis can be extended in search of more detailed mechanisms. For example, it would be interesting to explore natives’ response to an increase in immigration. In particular, our results could be due to the fact that there is substitution between immigrants’ and natives’ crime. Finally, it would be interesting to estimate separately the effect of official and unofficial immigrants. A better understanding of such mechanisms appears crucial for detailed policy prescriptions.
References
Angrist, J. D. and A. D. Kugler (2003). Protective or counter-productive? labour market institutions and the effect of immigration on eu natives. Economic Journal 113 (488), 302–331.
Anselin, L. (1988). Spatial Econometrics: Methods and Models. Dordrecht: Kluwer Academic Publishers.
Bauer, T. K., M. Lofstrom, and K. F. Zimmermann (2000). Immigration policy, assimila-tion of immigrants and natives’ sentiments towards immigrants: Evidence from 12 oecd-countries. IZA Discussion Paper No. 187.
Bauer, T. K. and K. F. Zimmermann (Eds.) (2002). The Economics of Migration. Volume I-IV. Edward Elgar Publishing Ltd.
Becker, G. S. (1968). Crime and punishment: An economic approach. Journal of Political Economy 76 (2), 169–217.
Benoit, K. and M. Laver (2006). Party Policy in Modern Democracies. London: Routledge. Borjas, G. J. (1994). The economics of immigration. Journal of Economic Literature 32 (4),
1667–1717.
Borjas, G. J. (2003). The labor deman curve is downward sloping: Reexamining the impact of immigration on the labor market. Quarterly Journal of Economics 118 (4), 1335–1374. Borjas, G. J., R. B. Freeman, and L. F. Katz (1996). Searching for the effect of immigration
on the labor market. American Economic Review 86 (2), 246–251.
Borjas, G. J., J. Grogger, and G. H. Hanson (2010). Immigration and the economic status of african-american men. Economica, forthcoming.
Butcher, K. F. and A. M. Piehl (1998a). Cross-city evidence on the relationship between immigration and crime. Journal of Policy Analysis and Management 17 (3), 457–493. Butcher, K. F. and A. M. Piehl (1998b). Recent immigrants: Unexpected implications for
crime and incarceration. Industrial and Labor Relations Review 51 (4), 654–679.
Butcher, K. F. and A. M. Piehl (2005). Why are immigrants’ incarceration rates so low? evidence on selective immigration, deterrence, and deportation. Federal Reserve Bank of Chicago WP-05-19.
Card, D. (1990). The impact of the mariel boatlift on the miami labor market. Industrial and Labor Relations Review 43 (2), 245–257.
Card, D. (2001). Immigrant inflows, native outflows, and the local labor market impacts of higher immigration. Journal of Labor Economics 19 (1), 22–64.
Card, D. (2005). Is the new immigration really so bad? Economic Journal 115 (507), 300–323. Card, D. (2009). Immigration and inequality. American Economic Review 99 (2), 1–21. Card, D., C. Dustmann, and I. Preston (2009). Immigration, wages, and compositional
amenities. NBER Working Paper No. 15521.
Chojnicki, X., F. Docquier, and L. Ragot (2005). Should the u.s. have locked the heaven’s door? reassessing the benefits of the postwar immigration. IZA Discussion Paper No. 1676. Cortes, P. (2008). The effect of low-skilled immigration on u.s. prices: Evidence from cpi
data. Journal of Political Economy 116 (3), 381–422.
Del Boca, D. and A. Venturini (2003). Italian migration. IZA Discussion Paper No. 938. Dills, A. K., J. A. Miron, and G. Summers (2008). What do economists know about crime?
NBER Working Paper No. 13759.
Ehrlich, I. (1973). Participation in illegitimate activities: A theoretical and empirical inves-tigation. Journal of Political Economy 81 (3), 521–65.
Ehrlich, I. (1996). Crime, punishment, and the market for offenses. Journal of Economic Perspectives 10 (1), 43–67.
Eide, E., P. H. Rubin, and J. M. Shepherd (2006). Economics of Crime. Now Publishers. Fasani, F. (2009). Deporting undocumented immigrants. mimeo, University College of
Lon-don.
Foug`ere, D., F. Kramarz, and J. Pouget (2009). Youth unemployment and crime in france. Journal of the European Economic Association 7 (5), 909–938.
Freeman, R. B. (1991). Crime and the employment of disadvantaged youths. NBER Working Paper No. 3875.
Freeman, R. B. (1999). The economics of crime. In O. Ashenfelter and D. Card (Eds.), Handbook of Labor Economics, Chapter 52, pp. 3529–3571. Elsevier.
Friedberg, R. M. (2001). The impact of mass migration on the israeli labor market. Quarterly Journal of Economics 116 (4), 1373–1408.
Friedberg, R. M. and J. Hunt (1995). The impact of immigrants on host country wages, employment and growth. Journal of Economic Perspectives 9 (2), 23–44.
Gibbons, S. (2004). The costs of urban property crime. Economic Journal 114 (499), 441–463. Glaeser, E. L. and B. Sacerdote (1999). Why is there more crime in cities? Journal of
Political Economy 107 (6), 225–229.
Gould, E. D., B. A. Weinberg, and D. B. Mustard (2002). Crime rates and local labor market opportunities in the united states: 1979-1997. Review of Economics and Statistics 84 (1), 45–61.
Grogger, J. (1998). Market wages and youth crime. Journal of Labor Economics 16 (4), 756–91.
ISTAT (2004). Statistiche giudiziarie penali. Technical report, Italian Statistics Institute. Italian Ministry of the Interior (2007). Rapporto sulla criminalit`a in Italia. Analisi,
Preven-zione, Contrasto.
Jaeger, D. A. (2006). Green cards and the location choices of immigrants in the united states, 1971-2000. IZA Discussion Paper No. 2145.
LaLonde, R. J. and R. H. Topel (1991). Immigrants in the american labor market: Quality, assimilation, and distributional effects. American Economic Review 81 (2), 297–302.
Lee, R. D. and T. W. Miller (2000). Immigration, social security and broader fiscal impacts. American Economic Review 90, 350–354.
Levitt, S. D. (1996). The effect of prison population size on crime rates: Evidence from prison overcrowding litigation. Quarterly Journal of Economics 111 (2), 319–51.
Levitt, S. D. (1998). Juvenile crime and punishment. Journal of Political Economy 106 (6), 1156–1185.
McKenzie, D. and H. Rapoport (2007). Self-selection patterns in mexico-u.s. migration: The role of migration networks. CReAM Discussion Paper No. 0701.
Moehling, C. and A. M. Piehl (2007). Immigration and crime in early 20th century america. NBER Working Paper No. 13576.
Munshi, K. (2003). Networks in the modern economy: Mexican migrants in the u.s. labor market. Quarterly Journal of Economics 118 (2), 549–599.
Nelson, C. R. and R. Startz (1990). The distribution of the instrumental variables estimator and its t-ratio when the instrument is a poor one. Journal of Business 63 (1), 125–140. Ortega, F. and G. Peri (2009). The causes and effects of international migrations: Evidence
from oecd countries 1980-2005. NBER Working Paper No. 14833.
Oster, A. and J. Agell (2007). Crime and unemployment in turbulent times. Journal of the European Economic Association 5 (4), 752–775.
Ottaviano, G. I. and G. Peri (2006). The economic value of cultural diversity: evidence from US cities. Journal of Economic Geography 6 (1), 9–44.
Raphael, S. and R. Winter-Ember (2001). Identifying the effect of unemployment on crime. Journal of Law & Economics 44 (1), 259–83.
Saiz, A. (2007). Immigration and housing rents in american cities. Journal of Urban Eco-nomics 61 (2), 345–371.
Staiger, D. and J. H. Stock (1997). Instrumental variables regression with weak instruments. Econometrica 65 (3), 557–586.
Stock, J. H., J. H. Wright, and M. Yogo (2002). A survey of weak instruments and weak identification in generalized method of moments. Journal of Business & Economic Statis-tics 20 (4), 518–529.
Stock, J. H. and M. Yogo (2005). Testing for weak instruments in linear iv regression. In D. Andrews and J. Stock (Eds.), Identification and Inference for Econometric Models: Essays in Honor of Thomas Rothenberg, pp. 80–108. Cambridge: Cambridge University Press.
Storesletten, K. (2000). Sustaining fiscal policy through immigration. Journal of Political Economy 108 (2), 300–323.
Zenou, Y. (2003). The spatial aspects of crime. Journal of the European Economic Associa-tion 1 (2-3), 459–467.
Appendix A
Variables: definitions and sources
migr: log of residence permits over the total province population, as of December 31 of each year. Source: Ministry of the Interior.
total: log of reported crimes in each province and year. This category includes murder, serious assault, rape, sex offence, theft, robbery, extortion, kidnapping, incrimination for criminal association, arson, terrorism, drug-related crime, forgery and counterfeiting, fraud, prostitu-tion and other crimes. Source: Statistiche Giudiziarie Penali - Italian Naprostitu-tional Institute of Statistics.
violent: log of reported violent crimes over the total population in each province and year. Source: Statistiche Giudiziarie Penali - Italian National Institute of Statistics.
property: log of reported property crimes over the total population in each province and year. This category includes robberies, thefts and car thefts. Source: Statistiche Giudiziarie Penali - Italian National Institute of Statistics.
thef t: log of reported thefts over the total population in each province and year. This category includes several types of crime such as: bag snatch and pickpocketing. Source: Statistiche Giudiziarie Penali - Italian National Institute of Statistics.
robbery: log of reported robberies over the total population in each province and year. Source: Statistiche Giudiziarie Penali - Italian National Institute of Statistics.
car thef t: log of reported car thefts over the total population in each province and year. Source: Statistiche Giudiziarie Penali - Italian National Institute of Statistics.
drug: log of reported drug-related crimes over the total population in each province and year. This category includes trafficking, consumption and pushing. Source: Statistiche Giudiziarie Penali - Italian National Institute of Statistics.
pop: log of the resident population in each province and year. Source: Popolazione e movi-mento anagrafico dei comuni - Italian National Institute of Statistics.
urban: percentage of the population living in cities with more than 100,000 inhabitants in each province and year. Source: Popolazione e movimento anagrafico dei comuni - Italian
National Institute of Statistics.
male1539: percentage of young males aged 15-39 in the population in each province and year. Source: Popolazione e movimento anagrafico dei comuni - Italian National Institute of Statistics.
gdp: log of real GDP per capita in each province and year. Source: Conti Economici Terri-toriali - Italian National Institute of Statistics.
unemp: percentage unemployment ratio in each province and year. Source: Labour Force Survey - Italian National Institute of Statistics.
clear-up: percentage ratio of the number of crimes solved by the police to the total number of reported crimes, for each province, year and crime category. Source: Statistiche Giudiziarie Penali - Italian National Institute of Statistics.
partisan: ideology of the provincial government. This variable is constructed as follows. First, a score between 0 (extreme left) and 20 (extreme right) is attached to each politi-cal party according to the expert surveys presented in Benoit and Laver (2006) (these data are available at http://www.tcd.ie/Political Science/ppmd/). Then, the score of the local government is computed as the average score of all parties entering the executive cabinet weighted by the number of seats held by each party in the local council (the composition of Italian local councils is available at http://amministratori.interno.it/).
Appendix B
Countries included in the construction of the instrument
Eurostat data
origin countries: Albania, Algeria, Brazil, China, Egypt, India, Morocco, Nigeria, Pak-istan, Philippines, Romania, Tunisia and Former Yugoslavia (Bosnia & Herzegovina, Croatia, Macedonia, Serbia & Montenegro, Slovenia)
destination countries: Austria, Belgium, Denmark, Finland, France, Greece, Nether-lands, Norway, Spain, Sweden and Switzerland
Global Migration Origin Database and Ortega and Peri (2009)
origin countries: Albania, Algeria, Australia, Bangladesh, Brazil, Bulgaria, Cambodia, Canada, Chile, China, Colombia, Democratic Republic of Congo, Cuba, Cyprus, Dominican Republic, Ecuador, Egypt, El Salvador, Ethiopia, Fiji, Ghana, Guatemala, Guyana, Haiti, Honduras, Hong Kong, Hungary, Iceland, India, Iran, Iraq, Jamaica, Japan, Kenya, Ko-rea, Laos, Lebanon, Malaysia, Mexico, Morocco, New Zealand, Nicaragua, Nigeria, Norway, Pakistan, Peru, Philippines, Poland, Romania, Somalia, South Africa, Former Soviet Union
(Armenia, Azerbaijan, Belarus, Estonia, Georgia, Kazakhstan, Kyrgyz Republic, Latvia, Lithuania, Moldova, Russia, Tajikistan, Turkmenistan, Ukraine, Uzbekistan), Spain, Sri Lanka, Suriname, Thailand, Trinidad & Tobago, Tunisia, Turkey, United States, Vietnam and Former Yugoslavia (Bosnia & Herzegovina, Croatia, Macedonia, Serbia & Montenegro, Slovenia)
destination countries: Australia, Belgium, Canada, Denmark, France, Germany, Japan, Luxemburg, Netherlands, Norway, Sweden, Switzerland, United Kingdom, United States
Figure 1: Opinions about immigrants: crime vs. labor market concerns AUS DEU-W DEU-E GBR USA AUT IRL NOR SWE NZL CAN JPN ESP FRA POR DNK CHE FIN ITA 0 2 0 4 0 6 0 8 0 1 0 0 % c o n c e rn e d a b o u t c ri m e 0 20 40 60 80 100
% concerned about jobs
Note: This graph presents the results of the “National Identity” survey conducted in 1995 and 2003 by the International Social Survey Pro-gramme. It plots, for each country, the percentage of people who de-clared to “Strongly Agree” or “Agree” that “Immigrants increase crime rates” (on the vertical axis) against percentage of people who declared to “Strongly Agree” or “Agree” that “Immigrants take jobs away from natives” (on the horizontal axis), together with the 45-degree line.
Figure 2: Total and official immigrants -1 -. 5 0 .5 1 lo g o f to ta l im m ig ra n ts o ve r p o p u la ti o n ( re si d u a ls) -1 -.5 0 .5 1
log of official immigrants over population (residuals)
Note: This figure plots the residuals obtained after regressing the log of total immigrants (on the vertical axis) and the log of official im-migrants (on the horizontal axis) on province- and year-fixed effects, together with the 45-degree line. The (estimated) number of total im-migrants is given by the sum of residence permits and applications for regularization. The source of data on both residence permits and demands for regularization is the Italian Ministry of the Interior.
Figure 3: Immigration and crime over time 0 500 1000 1500 2000 2500 3000 3500 4000 4500 5000 1990 1991 1992 1993 1994 1995 1996 1997 1998 1999 2000 2001 2002 2003 n u m b e r, p e r 1 0 0 ,0 0 0 i n h a b it a n ts
property crimes drug-related crimes violent crimes other crimes residence permits
Note: This graph shows the evolution over time of reported crimes and residence permits in Italy. The histogram refers to the number of reported crimes per 100,000 inhabitants, distinguishing between different categories of criminal offenses. The line refers to the number of residence permits awarded to immigrants in Italy, per 100,000 inhabitants. The source of data on reported crimes and residence permits are ISTAT and the Italian Ministry of the Interior, respectively.
Figure 4: Immigration and crime across provinces
Note: These figures show the distribution, across Italian provinces, of the number of immi-grants and reported crimes per 100,000 inhabitants. All variables are yearly averages during the period 1990-2003. Provinces are colored according to which quartile of the distribution they belong to; darker colors refer to higher values. The extremes of each quartile, along with the corresponding color, are reported at the bottom of each map. The sources of data for residence permits and reported crimes are ISTAT and the Italian Ministry of the Interior, respectively.
Figure 5: Immigration to Italy and the rest of Europe ALB BRA CHN DZA EGY FYR IND MOR NGA PHL PKT ROM TUN 0 .5 1 1.5 2 2.5
log−change of immigrants in Italy
−.5 0 .5 1 1.5 2 2.5 3 3.5
log−change of immigrants in the rest of Europe
Note: This figure plots the log change of the immigrant population in Italy during the 1991-2001 period (on the vertical axis) against the log change of immigrant population in other European countries during the same period (on the horizontal axis), by country of origin. Immigrant population in Italy is measured by the number of residence permits, as reported by the Italian Ministry of the Interior. Immigrant population in other European countries is measured using the 1991 and 2001 rounds of national census. The desti-nation countries for which we obtained census data are: Austria, Belgium, Denmark, Finland, France, Greece, Netherlands, Norway, Spain, Sweden and Switzerland. Information on the stock of immigrants in those countries was available for the following nationalities: Albania, Algeria, Brazil, China (ex-cluding Hong Kong), Egypt, India, Morocco, Nigeria, Pakistan, Philippines, Romania, Tunisia and the Former Yugoslavia.
Figure 6: Actual and predicted immigration to Italy -1 0 1 2 a c tu a l lo g -c h a n g e o f p e rm it s -.5 0 .5 1 1.5
predicted log-change of permits
Note: This figure plots the actual log-changes of immigrants in Italian provinces between 1991 and 2001 (on the vertical axis) against the predicted log-changes during the same period (on the horizontal axis), together with the kernel-weighted local polynomial regression between the two variables. The actual number of immigrants is measured by the number of residence permits, as reported by the Italian Ministry of Interior. The predicted log-change is the weighted sum of the log-changes of immigrant population by nationality in other European countries. The weights are the shares of permits held by each nationality over total permits in that province in 1990 (see equation 5 in the main text). Immigrant population in other European countries is mea-sured using the 1991 and 2001 rounds of national census. The destination countries for which we obtained census data are Austria, Belgium, Denmark, Finland, France, Greece, Netherlands, Norway, Spain, Sweden and Switzer-land. Information on the stock of immigrants in those countries was avail-able for the following nationalities: Albania, Algeria, Brazil, China (excluding Hong Kong), Egypt, India, Morocco, Nigeria, Pakistan, Philippines, Romania, Tunisia, Former Yugoslavia.
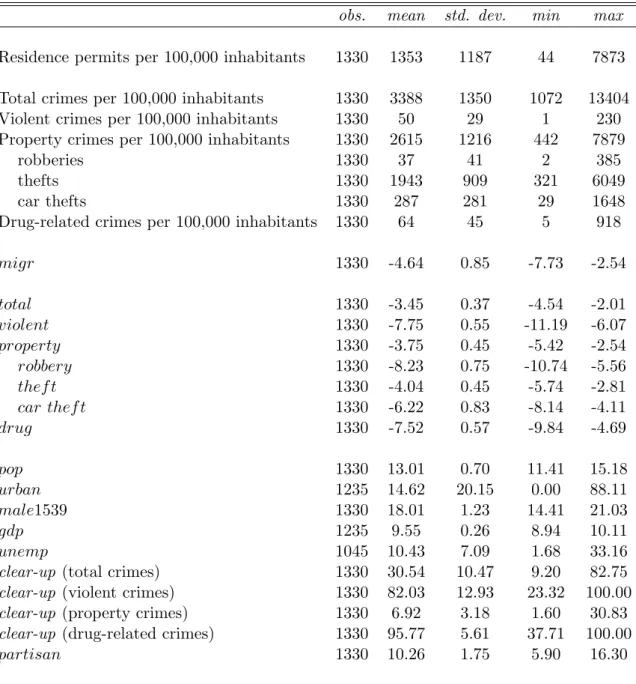
Table 1: Descriptive statistics
obs. mean std. dev. min max
Residence permits per 100,000 inhabitants 1330 1353 1187 44 7873
Total crimes per 100,000 inhabitants 1330 3388 1350 1072 13404
Violent crimes per 100,000 inhabitants 1330 50 29 1 230
Property crimes per 100,000 inhabitants 1330 2615 1216 442 7879
robberies 1330 37 41 2 385
thefts 1330 1943 909 321 6049
car thefts 1330 287 281 29 1648
Drug-related crimes per 100,000 inhabitants 1330 64 45 5 918
migr 1330 -4.64 0.85 -7.73 -2.54 total 1330 -3.45 0.37 -4.54 -2.01 violent 1330 -7.75 0.55 -11.19 -6.07 property 1330 -3.75 0.45 -5.42 -2.54 robbery 1330 -8.23 0.75 -10.74 -5.56 thef t 1330 -4.04 0.45 -5.74 -2.81 car thef t 1330 -6.22 0.83 -8.14 -4.11 drug 1330 -7.52 0.57 -9.84 -4.69 pop 1330 13.01 0.70 11.41 15.18 urban 1235 14.62 20.15 0.00 88.11 male1539 1330 18.01 1.23 14.41 21.03 gdp 1235 9.55 0.26 8.94 10.11 unemp 1045 10.43 7.09 1.68 33.16
clear-up (total crimes) 1330 30.54 10.47 9.20 82.75
clear-up (violent crimes) 1330 82.03 12.93 23.32 100.00
clear-up (property crimes) 1330 6.92 3.18 1.60 30.83
clear-up (drug-related crimes) 1330 95.77 5.61 37.71 100.00
partisan 1330 10.26 1.75 5.90 16.30
Note: This table reports the descriptive statistics for all dependent and explanatory variables across the 95 Italian provinces during the period 1990-2003.
T able 2: Correlation matrix mig r total v iol ent pr oper ty dr ug pop ur ban mal e 1539 g dp unemp cle ar-up total 0.356 v iol ent 0.289 0.377 pr oper ty 0.287 0.879 0.176 dr ug 0.205 0.383 0.147 0.244 pop 0.125 0.465 -0.062 0.598 0.036 ur ban 0.208 0.550 0.091 0.557 0.171 0.475 mal e 1539 -0.471 -0.074 -0.120 0.036 -0.209 0.375 -0.053 g dp 0.710 0.328 0.266 0.298 0.199 0.072 0.216 -0.407 unemp -0.607 -0.084 -0.179 -0.070 -0.136 0.138 0.057 0.425 -0.858 cle ar-up -0.276 -0.511 0.069 -0.723 0.070 -0.459 -0.404 -0.009 -0.288 0.113 par tisan 0.164 0.024 0.134 0.055 -0.065 0.116 -0.112 0.196 0.068 -0.060 -0.092 Note: This table rep orts the correlation matrix b et w een the dep enden t and ex p lanatory v a riables across the 95 Italian pro vinces during the p erio d 1990-2003 .
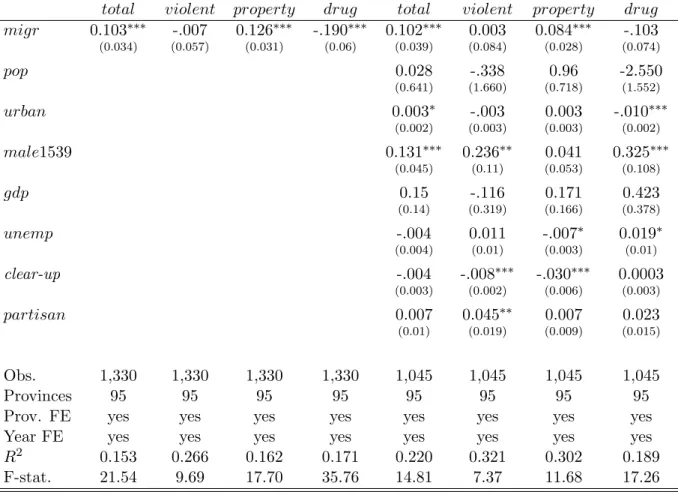
Table 3: Panel regressions: baseline
total violent property drug total violent property drug
migr 0.103∗∗∗ -.007 0.126∗∗∗ -.190∗∗∗ 0.102∗∗∗ 0.003 0.084∗∗∗ -.103 (0.034) (0.057) (0.031) (0.06) (0.039) (0.084) (0.028) (0.074) pop 0.028 -.338 0.96 -2.550 (0.641) (1.660) (0.718) (1.552) urban 0.003∗ -.003 0.003 -.010∗∗∗ (0.002) (0.003) (0.003) (0.002) male1539 0.131∗∗∗ 0.236∗∗ 0.041 0.325∗∗∗ (0.045) (0.11) (0.053) (0.108) gdp 0.15 -.116 0.171 0.423 (0.14) (0.319) (0.166) (0.378) unemp -.004 0.011 -.007∗ 0.019∗ (0.004) (0.01) (0.003) (0.01) clear-up -.004 -.008∗∗∗ -.030∗∗∗ 0.0003 (0.003) (0.002) (0.006) (0.003) partisan 0.007 0.045∗∗ 0.007 0.023 (0.01) (0.019) (0.009) (0.015) Obs. 1,330 1,330 1,330 1,330 1,045 1,045 1,045 1,045 Provinces 95 95 95 95 95 95 95 95
Prov. FE yes yes yes yes yes yes yes yes
Year FE yes yes yes yes yes yes yes yes
R2 0.153 0.266 0.162 0.171 0.220 0.321 0.302 0.189
F-stat. 21.54 9.69 17.70 35.76 14.81 7.37 11.68 17.26
Note: This table presents the results of OLS estimates on a panel of yearly observations for all 95 Italian provinces during the period 1991-2003. The dependent variable is the log of crimes reported by the police over the total population, for each category of criminal offense. The variable migr is the log of immigrants (i.e. residence permits) over province population. The sources of data for residence permits and reported crimes are ISTAT and the Italian Ministry of the Interior, respectively. All other variables are defined in the Appendix. Province and year fixed-effects are included in all specifications. Robust standard errors are presented in parenthesis. *, ** and *** denote rejection of the null hypothesis of the coefficient being equal to 0 at 10%, 5% and 1% significance level, respectively.
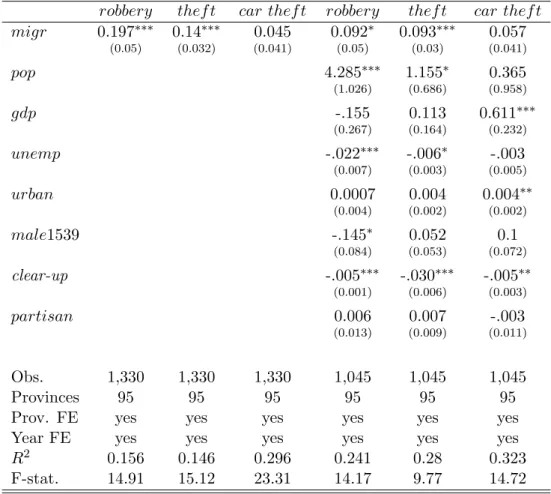
Table 4: Panel regressions: property crimes breakdown
robbery thef t car thef t robbery thef t car thef t
migr 0.197∗∗∗ 0.14∗∗∗ 0.045 0.092∗ 0.093∗∗∗ 0.057 (0.05) (0.032) (0.041) (0.05) (0.03) (0.041) pop 4.285∗∗∗ 1.155∗ 0.365 (1.026) (0.686) (0.958) gdp -.155 0.113 0.611∗∗∗ (0.267) (0.164) (0.232) unemp -.022∗∗∗ -.006∗ -.003 (0.007) (0.003) (0.005) urban 0.0007 0.004 0.004∗∗ (0.004) (0.002) (0.002) male1539 -.145∗ 0.052 0.1 (0.084) (0.053) (0.072) clear-up -.005∗∗∗ -.030∗∗∗ -.005∗∗ (0.001) (0.006) (0.003) partisan 0.006 0.007 -.003 (0.013) (0.009) (0.011) Obs. 1,330 1,330 1,330 1,045 1,045 1,045 Provinces 95 95 95 95 95 95
Prov. FE yes yes yes yes yes yes
Year FE yes yes yes yes yes yes
R2 0.156 0.146 0.296 0.241 0.28 0.323
F-stat. 14.91 15.12 23.31 14.17 9.77 14.72
Note: This table presents the results of OLS estimates on a panel of yearly observations for all 95 Italian provinces during the period 1991-2003. The dependent variable is the log of crimes reported by the police over the total population, for each category of criminal offense. The variable migr is the log of immigrants (i.e. residence permits) over province population. The sources of data for residence permits and reported crimes are ISTAT and the Italian Ministry of the Interior, respectively. All other variables are defined in the Appendix. Province and year fixed-effects are included in all specifications. Robust standard errors are presented in parenthesis. *, ** and *** denote rejection of the null hypothesis of the coefficient being equal to 0 at 10%, 5% and 1% significance level, respectively.