UNIVERSITÉ DU QUÉBEC À CHICOUTIMI PAR MAXIME LAROUCHE B. SC. (BIOLOGIE) MÉMOIRE PRÉSENTÉ À
L’UNIVERSITÉ DU QUÉBEC À CHICOUTIMI COMME EXIGENCE PARTIELLE
DE LA MAÎTRISE EN RESSOURCES RENOUVELABLES
EST-CE QUE L’HAMEÇON CIRCULAIRE PEUT RÉDUIRE LA MORTALITÉ À LA REMISE À L’EAU SANS DIMINUER LE SUCCÈS DE PÊCHE?
RÉSUMÉ
La mortalité à la remise à l’eau des poissons est un phénomène généralement sous-estimé par les pêcheurs sportifs qui peut avoir un impact néfaste non négligeable sur les populations. Face à l’implantation croissante de la remise à l’eau dans les mesures de gestion, il est primordial de trouver des moyens pour minimiser la mortalité causée aux poissons ciblés par la remise à l’eau. L’hameçon circulaire est un type d’hameçon de plus en plus utilisé comme outil pour réduire la mortalité des poissons remis à l’eau, car sa forme arrondie le rend plus susceptible de s’accrocher à la mâchoire qu’à des organes vitaux. Par contre, dans plusieurs des situations où il a été étudié, il procurait un succès de pêche inférieur aux hameçons conventionnels (hameçon en « J » et trépied), ce qui pourrait dissuader des pêcheurs de l’utiliser. Ainsi, le but de ce projet était de comparer la mortalité à la remise à l’eau et le succès de pêche de l’hameçon circulaire à ceux des hameçons conventionnels. Cette comparaison a été faite pour trois espèces grandement exploitées par la pêche sportive au Québec, pour lesquelles la remise à l’eau est importante : le touladi, l’omble de fontaine et le doré jaune. La sélectivité en fonction de la taille des engins de pêche a aussi été étudiée de manière parallèle, afin de voir si restreindre l’équipement de pêche peut permettre de contrôler la taille des captures. En 2014, plus de 1500 poissons ont été capturés et remis à l’eau par des pêcheurs bénévoles utilisant plusieurs techniques de pêche pour comparer l’hameçon circulaire à l’hameçon en « J » et au trépied. La mortalité à la remise à l’eau était évaluée en comptant le nombre de poissons morts après une période de rétention de 48 heures. Le succès de pêche était estimé avec deux variables : les captures par unité d’effort (CPUE) et l’efficacité de capture, calculée à partir du nombre de touches et de poissons manqués. Globalement, la mortalité du touladi était de 5 %, celle de l’omble de fontaine de 12 % et celle du doré de 27 %. Pour les 3 espèces, l’hameçon circulaire procurait une mortalité à la remise à l’eau plus faible ou égale à celle de l’hameçon en « J » et du trépied pour au moins une technique de pêche. Pour le touladi, cette technique était la pêche à la ligne morte avec un méné mort, tandis que pour l’omble de fontaine, c’était la pêche avec un ver et une cuillère ondulante. Dans une moindre mesure, l’hameçon circulaire réduisait légèrement la mortalité des dorés pêchés avec un marcheur de fond et un méné mort. L’hameçon circulaire ne réduisait pas la mortalité pour les techniques impliquant de la pêche à la traîne et des leurres artificiels, car la mortalité des hameçons conventionnels était faible. Dans la majorité des cas, les mortalités étaient attribuées à des ferrages profonds. Pour le succès de pêche, les CPUE et l’efficacité de capture présentaient les mêmes tendances entre les types d’hameçons. Pour la majorité des techniques, le succès de pêche de l’hameçon circulaire était plus faible que celui obtenu avec les autres types d’hameçons : moins de poissons étaient capturés pour un même effort, et plus de touches étaient manquées. Par contre, pour les techniques où une réduction de la mortalité était observée avec l’hameçon
iii
circulaire, le succès de pêche était équivalent entre les types d’hameçons. Par ailleurs, l’analyse de la sélectivité des techniques utilisées dans le projet a démontré que l’équipement de pêche utilisé pour le touladi et l’omble de fontaine sélectionne les plus gros individus de la population. En somme, les résultats de cette étude ajoutent de l’information sur l’efficacité de l’hameçon circulaire pour la pêche avec remise à l’eau. De plus, ils démontrent le potentiel de cet outil à la pêche sportive au touladi et à l’omble de fontaine pour les techniques de pêche où le risque de mortalité est élevé, en réduisant la mortalité à la remise à l’eau tout en procurant un succès de pêche équivalent par rapport aux hameçons conventionnels.
REMERCIEMENTS
Je tiens premièrement à remercier mon directeur Pascal Sirois, pour sa confiance et ses conseils qui ont permis à ce projet de se réaliser, faisant de moi un bien meilleur biologiste. Je remercie aussi ma codirectrice Isabel Thibault, pour son aide et ses idées tout au long du projet.
Ce travail a été possible grâce à l’aide d’une multitude de personnes. Merci aux gens du MFFP pour leur participation au projet, principalement Yanick Soulard et Jean Tanguay pour leur aide lors de l’échantillonnage. Merci à mes collègues du laboratoire des sciences aquatiques pour leur aide respective : Anne-Lise Fortin, Tommy Larouche, Karole Tremblay, Lucie Vanalderweireldt et j’en passe. Merci également à mes amis Frédéric Gagnon pour son aide sur le terrain et à Patrick Plourde-Lavoie pour ses idées et ses commentaires. Je dois un merci tout spécial à Daniel Nadeau pour son expertise et son hospitalité, ainsi qu’à tous les pêcheurs bénévoles : Jean-Philippe Caron, Denis Smith, Denis Héroux, Jacques et Véronic Lalonde, Ken Laver, Henri Lefebvre, Michel et René Legault, Anne Migneault, Danielle Robin, Jim Sang, Carol Gauthier, Alexis Gingras, Sophie Hardy, Maxime Hébert, Maxime Paré, Marie-Louise Lalonde, Marc Larouche, Martin Lépine, Martin Tremblay, Guy Lévesque, Hubert Morin, Réal Plourde, Ian Segers, Gérard B. Tremblay, Patrice Lavoie, Daniel et Mishell Potvin, Cynthia Roseberry et à Patrick Singher pour leur participation. Finalement, merci aux organismes suivant pour leur soutien financier : le ministère des Forêts, de la Faune et des Parcs (MFFP), la Chaire de recherche sur les espèces aquatiques exploitées de l’Université du Québec à Chicoutimi (UQAC), Ressources Aquatiques Québec (RAQ) et la Fédération québécoise des chasseurs et des pêcheurs (FédéCP).
v
AVANT-PROPOS
Le présent mémoire est un ouvrage réalisé dans le cadre du programme de maîtrise en ressources renouvelables de l’Université du Québec à Chicoutimi. Ce projet est le résultat d’une collaboration entre la Chaire de recherche sur les espèces aquatiques exploitées et le ministère des Forêts, de la Faune et des Parcs (MFFP). La structure choisie correspond à un mémoire sous forme d’article scientifique. Ainsi, la majeure partie du travail est rédigée en anglais dans le chapitre II, sous forme d’article scientifique. Le contenu de ce chapitre sera soumis au journal Fisheries Research en portant le titre: Effects of Circle Hooks Use on the Release Mortality and Fishing Success for Two Freshwater Salmonids. Une introduction générale en français permet de mettre les lecteurs en contexte, tandis qu’une conclusion générale, également en français, met les principaux résultats en perspective. L’ouvrage contient aussi un troisième et un quatrième chapitre, en français, présentant des résultats complémentaires au deuxième chapitre.
TABLE DES MATIÈRES
RÉSUMÉ ... ii
REMERCIEMENTS ... iv
AVANT-PROPOS ... v
TABLE DES MATIÈRES ... vi
LISTE DES TABLEAUX ... vii
LISTE DES FIGURES ... viii
I - INTRODUCTION GÉNÉRALE ... 1
1.1 OBJECTIFS DU PROJET ... 8
II - EFFECTS OF CIRCLE HOOKS USE ON THE RELEASE MORTALITY AND FISHING SUCCESS FOR TWO FRESHWATER SALMONIDS ... 10
2.1 INTRODUCTION... 11
2.2 MATERIALS AND METHODS ... 13
2.2.1 Study design ... 13 2.2.2 Sampling ... 16 2.2.3 Hook metrics ... 19 2.2.4 Statistical analyses ... 20 2.4 DISCUSSION ... 31 2.4.1 Lake trout ... 31 2.4.2 Brook trout ... 35
III - EFFETS DE L’HAMEÇON CIRCULAIRE SUR LA MORTALITÉ À LA REMISE À L’EAU ET LE SUCCÈS DE PÊCHE DU DORÉ JAUNE ... 39
3.1 PROBLÉMATIQUE ... 40
3.2 MATÉRIEL ET MÉTHODES ... 41
3.3 RÉSULTATS ... 43
3.4 DISCUSSION ... 46
IV - SÉLECTIVITÉ DES ENGINS DE PÊCHE SPORTIVE ... 50
4.1 PROBLÉMATIQUE ... 51 4.2 MÉTHODOLOGIE ... 52 4.3 RÉSULTATS ... 53 4.4 INTERPRÉTATION ... 55 CONCLUSION ... 59 RÉFÉRENCES ... 63 ANNEXE 1 ... 69
vii
LISTE DES TABLEAUX
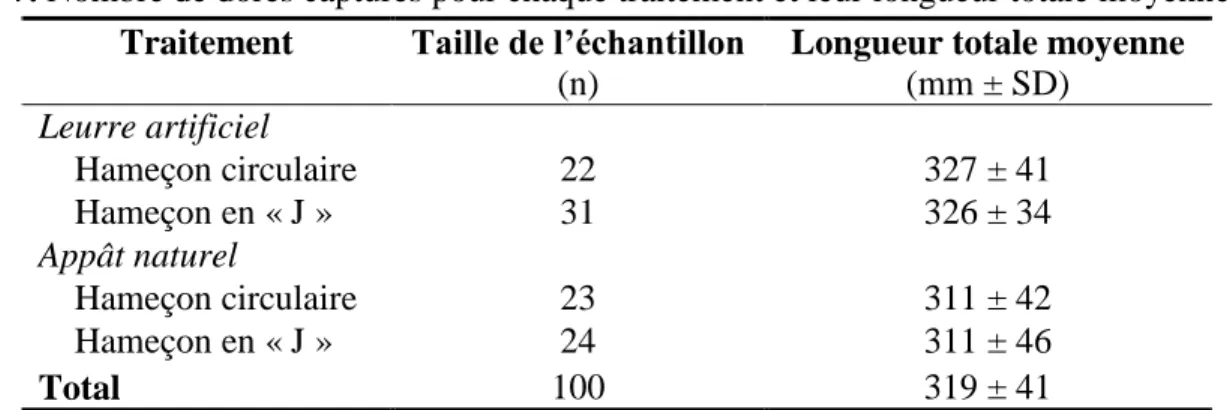
Table 1. Results for lake trout sampling, showing numbers of fish caught for each treatment and their average total length for lakes Caugnawana and Maganasipi………...………22 Table 2. Statistical comparison of mortality rates, deep hooking rates, capture success and hooking success of three hook types for lake trout treatments. Values in bold represent statistically significant results (p < 0.05)………...24 Table 3. Mean catch per unit effort (CPUE) of lake trout for each treatment group. ANOVA results (F-value) are shown on the right, along with degrees of freedom (df) and associated p-values. Standard deviation of each mean is shown in parentheses………...………..25 Table 4. Results for brook trout sampling, showing numbers of fish caught for each treatment and their average total length for Lake Elbow and Castor Gras………..27 Table 5. Comparison of mortality rates, deep hooking rates, capture success and hooking success of three hook types for brook trout treatments. Values in bold represent statistically significant results (p < 0.05)………..………28 Table 6. Mean catch per unit effort (CPUE) of brook trout for each treatment group. ANOVA results (F-value) are shown on the right, along with degrees of freedom (df) and associated p-values. Standard deviation of each mean is shown in parentheses ………...….29 Table 7. Nombre de dorés capturés pour chaque traitement et leur longueur totale moyenne………....43 Table 8. Comparaison du taux de mortalité, du taux de ferrage profond et du succès de capture des dorés pour les deux types d’hameçons (circulaire et en « J ») étudiés, ainsi que pour le leurre artificiel et l’appât naturel respectivement. Les valeurs entre parenthèses représentent le nombre de captures dans chaque traitement ………...…………..44 Table 9. Analyse de variance (ANOVA) des captures par unité d’effort en fonction des différents engins et types d’hameçon étudiés pour le doré. Le nombre de degrés de liberté (dl) et les résultats de l’analyse (F-value) sont présentés………...46 Table 10. Nombre de captures et années d’échantillonnage des pêches expérimentales réalisées sur les lacs étudiés durant le projet (Données provenant du MFFP)………53 Table A1. Measurements of the hooks used in the study……….………...….70
LISTE DES FIGURES
Figure 1. Types d’hameçons utilisés dans l’étude. De gauche à droite : un hameçon en « J », un trépied, et un hameçon circulaire. La pointe (A) et la hampe (B) d’un hameçon y sont indiqués………...6 Figure 2. Location of the studied lakes for the present study. Squares ( ) represent lake trout lakes, while stars ( ) represent brook trout lakes……….……..17 Figure 3. Schematized representation of angling treatments studied for lake trout. Artificial lures shown are an Acme® Little Cleo (a) and a Mepps® Syclops (b), while natural baits shown are dead emerald shiners (Notropsis artherinoides). The most popular technique is indicated by an asterisk………..………17 Figure 4. Schematized representation of angling treatments studied for brook trout. Shown are an artificial lure (Mepps® Aglia), a natural bait (earthworm) and tied flies (Muddler Minnow (a) and Caddis (b)). The most popular technique is indicated by an asterisk………18 Figure 5. Mean capture success (a) and log-transformed catch per unit effort (b) for lake trout angled with trolled artificial lures. Capture success differences were assessed with Wald tests, while catch per unit effort differences were tested with one-way analysis of variance (ANOVA) and Tukey’s Honest Significant Difference (HSD). Asterisks illustrate significant pairwise differences of capture success between circle and conventional hooks, while letters (A, B) show Tukey’s HSD between groups. Error bars represent standard deviations...25 Figure 6. Mean mortality (a) and deep hooking (b) rates for brook trout angled with natural baits treatments. Mortality of each hook type was compared to the control (Ctrl), while deep hooking rates of J-hooks and treble hooks were respectively compared to the circle hook. Error bars represent standard deviations, and letters illustrate pairwise differences of Wald tests between treatments………...……….…30 Figure 7. Mean capture success and hooking success (a), and log-transformed catch per unit effort (b) for brook trout angled with natural baits and different hook types. Asterisks illustrate pairwise differences of Wald tests between circle and treble hooks, while letters represent Tukey’s HSD between hook types. Error bars represent standard deviations…...31 Figure 8. Taux de mortalité à la remise à l’eau observés pour les dorés capturés à l’aide des différents types d’engins (leurre, appât) et d’hameçons (circulaire, en « J ») étudiés. Les p-values des tests de Wald sont affichées au-dessus des engins comparés pour chaque type d’hameçon………...………..45
ix
Figure 9. Captures par unité d’effort des dorés capturés à l’aide de leurres artificiels (gris) et d’appâts naturels (noir) selon le type d’hameçon étudié (circulaire, en « J »). Les barres d’erreurs représentent l’écart-type………....………...46 Figure 10. Distributions des fréquences de longueur totale de touladis capturés lors des inventaires ichtyologiques (noir) et l’étude actuelle (blanc) dans les lacs Caugnawana (a et c) et Maganasipi (b et d). Le nombre d’échantillons composant chaque distribution est indiqué en haut à gauche………..………..……….54 Figure 11. Distributions des fréquences de longueur totale d’ombles capturés lors des inventaires ichtyologiques (noir) et l’étude actuelle (blanc) dans les lacs Elbow (a et c) et Castor Gras (b et d). Le nombre d’échantillons composant chaque distribution est indiqué en haut à gauche……….……....………55 Figure A1. Diagrammes à moustaches des distributions des fréquences de la longueur totale des touladis capturés dans les lacs Caugnawana (a) et Maganasipi (b) en fonction des traitements étudiés. La boîte grise représente les 2e et 3e quartiles, la ligne à l’intérieur représente la médiane, les barres d’erreurs représentent les 1er et 4e quartiles et les points illustrent les valeurs exceptionnelles. Le nombre d’échantillons de chaque traitement est indiqué au-dessus de chaque boîte, et le résultat de l’analyse de variance (ANOVA) comparant les traitements est indiqué en bas à droite de chaque graphique……….….71 Figure A2. Diagrammes à moustaches des distributions log-transformées des fréquences de la longueur totale des ombles de fontaine capturés dans les lacs Elbow (a) et Castor Gras (b) en fonction des traitements étudiés. La boîte grise représente les 2e et 3e quartiles, la ligne à l’intérieur représente la médiane, les barres d’erreurs représentent les 1er et 4e quartiles et les points illustrent les valeurs exceptionnelles. Le nombre d’échantillons de chaque traitement est indiqué au-dessus de chaque boîte, et les lettres représentent les différences significatives entre les traitements calculées avec l’analyse de variance (ANOVA; en bas à droite) et le test post-hoc de Tukey………..………....72
CHAPITRE I
2
La pêche récréative est une activité économique importante dans beaucoup de pays industrialisés, et peut globalement avoir un impact négatif majeur sur l’état des stocks de poissons (Cooke & Cowx 2004). On estime que 12 % des poissons récoltés dans le monde sont issus de la pêche récréative, comptant pour environ 17 milliards de poissons annuellement (Cooke & Cowx 2004). Au Canada, près de 10 % de la population s’adonne à cette activité au moins une fois par an (Pêche et Océans Canada 2012). À la différence de la pêche commerciale, la pêche sportive vise le loisir plutôt que la consommation. Ainsi, les pêcheurs recherchent d’abord et avant tout la capture, mais pas nécessairement la récolte. Ceci fait en sorte que seulement une fraction des poissons capturés est récoltée (Cooke & Cowx 2004). Au Canada, seulement 38 % des 193 millions de poissons capturés annuellement sont conservés (Pêche et Océans Canada 2012). Ces 56 millions de poissons non récoltés sont donc graciés, c’est-à-dire qu’ils sont remis à l’eau par les pêcheurs. Cette pratique, qui existe depuis plusieurs siècles (Policansky 2002), est généralement effectuée dans l’objectif précis de retourner le poisson dans la population pour que celui-ci atteigne une taille plus grande et se reproduise avant d’être capturé à nouveau plus tard (Wydoski 1977). Entre 1995 et 2010, le taux de remise à l’eau des poissons par les pêcheurs canadiens a augmenté de 12 % (Pêche et Océans Canada 1997, 2012). Le Québec ne fait pas exception à cette tendance, bien que les pêcheurs québécois relâchent moins leurs prises que ceux des autres provinces. Cette hausse du taux de remise à l’eau peut être expliquée par l’implantation croissante de mesures législatives (c.-à-d. limites de taille), couplée à une conscientisation des pêcheurs sportifs vers l’exploitation durable, incitant de plus en plus de pêcheurs à remettre une partie de leurs prises à l’eau (Arlinghaus et al. 2007). Par exemple, le ministère
des Forêts, de la Faune et des Parcs (MFFP) a récemment mis en place des plans de gestion de la pêche pour certaines espèces en déclin, qui impliquent des réglementations nécessitant la remise à l’eau de certaines tailles. Ainsi, le doré jaune (Sander vitreus) et le touladi (Salvelinus namaycush) sont deux espèces très prisées des pêcheurs sportifs pour lesquelles les remises à l’eau sont plus fréquentes depuis 2011 et 2014 respectivement (Arvisais et al. 2012; Ministère du Développement durable, de l'Environnement, de la Faune et des Parcs 2014). D’un autre côté, l’omble de fontaine est l’espèce la plus exploitée au Québec, mais n’est encadrée par aucun plan de gestion pour le moment (Pêche et Océans Canada 2012). Cela représente une opportunité pour mener des travaux afin d’évaluer si des mesures de gestion impliquant de la remise à l’eau sont envisageables.
Chaque évènement de remise à l’eau se base sur la prémisse que le poisson survivra au fait d’être capturé, manipulé hors de l’eau pendant un certain temps, puis remis à l’eau. Ce n’est toutefois pas toujours le cas : une fraction des poissons graciés subissent de la mortalité, pour différentes raisons. Dès les années 1930, des recherches ont été effectuées pour identifier les facteurs responsables de la mortalité des poissons remis à l’eau (Westerman 1932). Depuis, des centaines d’études ont été publiées sur le sujet, permettant de mieux comprendre la mortalité à la remise à l’eau, ses causes et ses effets (Muoneke & Childress 1994). De récentes revues de la littérature ont estimé que 16 à 18 % des poissons remis à l’eau dans les pêcheries récréatives mondiales mourraient (Bartholomew & Bohnsack 2005; Hühn & Arlinghaus 2011). La mortalité à la remise à l’eau présente des conséquences négatives sur plusieurs aspects : pour ceux qui la pratiquent volontairement, cela contrevient avec leur objectif de faire survivre le poisson. Pour les gestionnaires de la ressource, elle
4
diminue l’efficacité des mesures de gestion impliquant de la remise à l’eau de poissons de tailles spécifiques (Wydoski 1977). Si par exemple les poissons d’une gamme de taille doivent être remis à l’eau, une forte mortalité à la relâche peut contrecarrer l’objectif de la mesure de gestion en éliminant les poissons que l’on souhaite protéger (Cooke et al. 2005). Il est aujourd’hui connu que la mortalité à la remise à l’eau est causée par un ensemble de facteurs biologiques et anthropiques. Les caractéristiques biotiques et abiotiques associées au milieu influenceront le risque de mortalité des poissons remis à l’eau, incluant : l’espèce (Hühn & Arlinghaus 2011; Muoneke & Childress 1994), la taille du poisson (Bartholomew & Bohnsack 2005), la température de l’eau (Gale et al. 2013) et la profondeur à laquelle le poisson est pêché (Muoneke & Childress 1994). D’autre part, plusieurs paramètres sont contrôlés par les pêcheurs dans leur façon de capturer le poisson tels que le type et la taille de l’hameçon utilisé, le type d’appât ou de leurre, la technique de pêche, la durée du combat avec le poisson, la durée de l’exposition du poisson à l’air, la manipulation du poisson et le site de ferrage (c.à.d. l’endroit où se pique l’hameçon lorsqu’un poisson est capturé; résumés dans Bartholomew & Bohnsack 2005; Hühn & Arlinghaus 2011; Muoneke & Childress 1994). Ce dernier est cependant le facteur le plus influent sur la mortalité des poissons relâchés. Plus précisément, un poisson ferré profondément (dans les branchies ou l’œsophage) courra un risque plus élevé de mourir qu’un poisson ferré dans la mâchoire ou la bouche (Muoneke & Childress 1994). De la même façon, les hameçons trop petits pour l’espèce ciblée augmentent les risques de ferrage profond (Alos et al. 2008a). Au niveau de l’engin de pêche, les appâts naturels sont reconnus comme étant plus mortels que les leurres artificiels, car leur utilisation cause plus souvent des ferrages profonds (Bartholomew &
Bohnsack 2005). La technique de pêche employée influencera la manière dont le poisson mordra à l’engin de pêche. Les techniques plus actives comme la pêche à la traîne produiront moins de ferrages profonds comparativement aux techniques passives comme la pêche à ligne morte, où le poisson dispose de plus de temps pour avaler l’hameçon (Lennox et al. 2015).
Finalement, le type d’hameçon utilisé peut affecter grandement les chances de survie du poisson gracié. En général, les hameçons utilisés dans les pêcheries sportives sont divisés en deux types : l’hameçon simple (ou en « J ») et le trépied, ci-après appelés hameçons conventionnels (Muoneke & Childress 1994). Un hameçon en « J » a toujours la pointe parallèle à la hampe, tandis qu’un trépied est formé de trois hameçons simples soudés par la hampe, ayant la forme d’un grappin (Cooke & Suski 2004; Figure 1). Bien qu’ils soient parfois utilisés pour pêcher les mêmes espèces, ces deux types d’hameçons seront associés à des risques de mortalités différents. Dans la littérature, il est souvent décrit que l’hameçon en « J » va procurer des taux de mortalité élevés dû aux blessures qu’il occasionne lorsque ferré profondément (Muoneke & Childress 1994). Le trépied, de par ses dimensions plus imposantes, est moins facilement avalé par le poisson, mais est en général plus difficile à décrocher dû à ses pointes multiples, qui demandent une durée de manipulation et d’exposition à l’air plus longue, augmentant du même coup les risques de mortalité (Muoneke & Childress 1994). Bien que ces types d’hameçons possèdent tous deux des avantages, l’hameçon en « J » est reconnu pour causer de la mortalité à la remise à l’eau plus fréquemment que le trépied (Muoneke & Childress 1994). De nombreux efforts ont été effectués dans les dernières années pour développer ou populariser des types d’hameçons
6
réduisant la mortalité à la remise à l’eau. Par exemple, les hameçons sans ardillons sont un bon moyen de réduire les blessures associées au ferrage et la durée d’exposition à l’air pour lesquels plusieurs recherches ont été menées (p. ex. Gutowsky et al. 2011; Meka 2004). L’hameçon circulaire est un autre type d’hameçon publicisé en tant qu’outil pour la remise à l’eau (Cooke & Suski 2004).
D’un point de vue de design, l’hameçon circulaire consiste en un hameçon simple avec une courbure plus prononcée, faisant en sorte que la pointe forme un angle de 90° avec la hampe (Cooke & Suski 2004; Serafy et al. 2012; Figure 1). La forme arrondie de l’hameçon circulaire est la différence qui lui conférerait des avantages par rapport aux autres pour réduire la mortalité due au ferrage. En étant perpendiculaire à la hampe, la pointe de l’hameçon est moins exposée, ce qui diminue les risques de ferrage profond lorsque le poisson avale l’hameçon (Cooke & Suski 2004). Cela permettrait à l’hameçon de glisser hors du fond de la bouche du poisson dans la plupart des cas et de s’accrocher au premier obstacle Figure 1. Types d’hameçons utilisés dans l’étude. De gauche à droite : un hameçon en « J », un trépied, et un hameçon circulaire. La pointe (A) et la hampe (B) d’un hameçon sont pointées par une flèche.
rencontré: la mâchoire (Cooke & Suski 2004; Johannes 1981). En diminuant l’incidence du ferrage profond, l’hameçon circulaire diminuerait donc les risques de mortalité.
Les pêcheries commerciales avec palangre ont été les premières pêcheries modernes à employer les hameçons circulaires à grande échelle. Ces derniers étaient plus efficaces que les hameçons en « J » pour capturer les poissons (McEachron et al. 1985). Les palangres étant d’énormes lignes dormantes, la forme de l’hameçon circulaire permettait de garder les poissons accrochés plus longtemps sur la ligne (Bjordal 1988). Comme beaucoup de prises accessoires étaient effectuées dans les pêches commerciales, ce type d’hameçon présentait aussi un avantage en réduisant la mortalité à la remise à l’eau de ces poissons (Trumble et al. 2002). Ce n’est qu’au début des années 1990 que les hameçons circulaires ont présenté un intérêt pour les pêcheurs récréatifs et ont commencé à gagner en popularité (Cooke & Suski 2004). Cependant, leur utilisation est aujourd’hui encore peu répandue, car ils sont relativement peu connus des pêcheurs. Ainsi, on ne les retrouve pas encore dans tous les magasins d’équipement de pêche. De plus, aucune province canadienne n’a de réglementation obligeant l’utilisation de ce type d’hameçon, et seulement trois provinces (Colombie-Britannique, Ontario et Saskatchewan) en font la recommandation pour la pêche avec remise à l’eau.
Pourtant, les preuves de l’efficacité de l’hameçon circulaire comme outil pour la remise à l’eau lors de la pêche sportive s’accumulent. Depuis la première étude sur la remise à l’eau avec hameçons circulaires en 1997, des dizaines d’autres ont été publiées (Cooke & Suski 2004). Globalement, les recherches menées visaient à documenter dans quelles situations les hameçons circulaires étaient le plus efficaces : les espèces, les techniques de pêche, les
8
engins, les tailles des captures, etc. La réduction de la mortalité à la remise à l’eau par l’hameçon circulaire, qui était vantée par les fabricants, a pu être quantifiée et confirmée grâce à plusieurs de ces travaux (revu dans Cooke & Suski 2004). Même si les effets de l’hameçon circulaire ont été évalués pour plusieurs espèces exploitées à la pêche sportive, peu de recherches ont été menées sur des espèces d’eau douce, notamment parmi les espèces présentes au Québec (Cooke & Suski 2004). En outre, malgré son efficacité pour réduire la mortalité à la remise à l’eau, un inconvénient fréquemment mentionné est le faible succès de pêche de l’hameçon circulaire par rapport aux hameçons conventionnels (Cooke & Suski 2004; Serafy et al. 2012). En effet, dans beaucoup d’études comparant la mortalité à la remise à l’eau de l’hameçon circulaire aux hameçons conventionnels à la pêche sportive, le succès de pêche de l’hameçon circulaire était inférieur (ou égal dans le meilleur des cas) à celui des hameçons conventionnels (Cooke & Suski 2004). Cet aspect est particulièrement important pour les pêcheurs, si bien qu’une réglementation impliquant l’utilisation de l’hameçon circulaire sera plus difficilement acceptée si celui-ci procure un succès de pêche moindre (Sullivan et al. 2013).
1.1 OBJECTIFS DU PROJET
L’objectif de ce projet est de comparer la mortalité à la remise à l’eau et le succès de pêche de l’hameçon circulaire par rapport aux hameçons conventionnels pour trois pêcheries récréatives du Québec: l’omble de fontaine, le doré jaune et le touladi. L’omble de fontaine et le doré jaune sont les deux espèces les plus pêchées au Québec, totalisant respectivement 16 millions et 8 millions de captures annuellement (Pêche et Océans Canada 2012). Le touladi est quant à lui sujet à 670 000 captures annuellement, dont 43 % sont remises à l’eau
(Ministère du Développement durable, de l'Environnement, de la Faune et des Parcs 2014). Pour la pêche à ces trois espèces, un grand nombre de poissons sont remis à l’eau annuellement, soit parce que beaucoup de captures y sont effectuées, soit parce que leur gestion implique la remise à l’eau de certaines tailles. De plus, l’hameçon circulaire n’a jamais été étudié pour la pêche à l’omble de fontaine et au touladi, tandis qu’une seule étude a comparé l’hameçon circulaire à l’hameçon « J » pour le doré jaune, sans toutefois évaluer la mortalité à la remise à l’eau (Jones 2005). Une analyse complémentaire a aussi été effectuée sur la sélectivité en fonction de la taille des engins de pêche sportive pour le touladi et l’omble de fontaine. Les résultats de ces analyses et le contexte dans lequel ils s’insèrent sont décrits au chapitre IV.
CHAPITRE II
EFFECTS OF CIRCLE HOOKS USE ON THE RELEASE MORTALITY AND FISHING SUCCESS FOR TWO FRESHWATER SALMONIDS
2.1 INTRODUCTION
Recreational fishing is an important economic activity in many countries, and can globally have a significant impact on the world’s fish stocks (Cooke & Cowx 2004). A recent review by Cooke & Cowx (2004) estimates that anglers contribute to about 12 % of the world’s total fish harvest. Since an important motive of angling is leisure, fish caught in the practice of the activity are often released. This is an increasingly popular phenomenon, as anglers are more and more inclined towards resource conservation (Arlinghaus et al. 2007; Lewin et al. 2006). Furthermore, the decline of many sport fish stocks require management agencies to use restrictions to increase angling quality and protect fish populations from collapse (Post et al. 2002). These restrictions, often taking the form of minimum-, maximum- or slot-length limits, aim to protect a stratum of the population, thus requiring anglers to release a fraction of the fish they catch (Arlinghaus et al. 2007). However, for voluntary and regulatory fish releases to be effective, the mortality of the released fish must be as low as possible (Wydoski 1977).
Recent literature reviews estimated that in average 16-18 % of fish caught and released by anglers die (Bartholomew & Bohnsack 2005; Hühn & Arlinghaus 2011). Considering that 15 million fishes are released annually in Québec (Fisheries and Oceans Canada 2012), the death of 16 % of those fish can have negative consequences on fish populations. While many factors have been found to influence release mortality, the most critical determinant remains the hook-related injuries (Bartholomew & Bohnsack 2005). Typically, hooking fish in critical regions of the mouth such as the gills or the oesophagus (referred to as deep hooking) can lead to serious injuries and cause mortality (Arlinghaus et al. 2007; Bartholomew &
12
Bohnsack 2005; Muoneke & Childress 1994). To minimize deep hooking hence hook damage on fish, one of the few variables over which anglers can have direct control is the fishing gear (Stålhammar et al. 2014). For instance, using artificial lures instead of natural baits can hook fish in shallower locations of the mouth (i.e. the jaw) more often, which could in turn reduce mortality rates (Bartholomew & Bohnsack 2005; Muoneke & Childress 1994). In marine recreational fisheries, circle hooks are a popular alternative to conventional hooks (J-hook, treble hook) to reduce the frequency of deep hooking when practicing catch-and-release (Cooke et al. 2012; Cooke & Suski 2004). A circle hook consists in a single hook for which the point forms an angle of at least 90 degrees with the shank (Cooke & Suski 2004; Serafy et al. 2012). When ingested by a fish, this makes the hook less likely to penetrate the deep tissues of the mouth and more likely to slide out and lodge itself in the jaw, therefore reducing deep hooking and mortality risks (Cooke & Suski 2004; Johannes 1981; Lennox et al. 2015). Numerous studies brought evidence of reduced release mortality of circle hooks compared to J-hooks (e.g. Parmenter 2000; Skomal et al. 2002) and treble hooks (High & Meyer 2014; Jenkins 2003). On the other hand, circle hooks consistently obtain lower or equal fishing success when compared to conventional hook types (Cooke & Suski 2004). This point is particularly important to anglers, since the use of a new hook type will be difficult to accept by the community if it provides a lower fishing success (Sullivan et al. 2013). Little work has been done to assess the potential benefits of the use of circle hooks for freshwater species, particularly salmonids. Yet, they are the target of many recreational fisheries in Canada (Fisheries and Oceans Canada 2012), and are susceptible to deep hooking because of their predatory feeding style (Muoneke & Childress 1994). Moreover, salmonids
can be subjected to substantial catch-and-release. For example, Québec’s lake trout (Salvelinus namaycush) management plan introduces length-based regulations for lake trout fishing, imposing the release of fish that do not meet the length requirements (Ministère du Développement durable, de l'Environnement, de la Faune et des Parcs 2014). Although a few published studies on circle hooks used freshwater salmonids as a model, so far no work has been done to assess the efficiency of circle hooks as a catch-and-release tool in the recreational fisheries of lake trout and brook trout (Salvelinus fontinalis), two of the most exploited salmonids species in Canada. However, previous work on stream-dwelling trout suggest that circle hooks provide lower deep hooking rates, mortality rates and hooking success than J-hooks (High & Meyer 2014).
In this study, a broad approach was used to look for a potential benefit of using circle hooks in the recreational fisheries of lake trout and brook trout. For these two species greatly exploited in Canada, releases are numerous either because of length-based regulations or of heavy exploitation. Using different techniques and terminal gear types commonly used to catch those species, the objectives were to compare the release mortality, deep-hooking rates, capture efficiencies and catch per unit effort of the circle hook to the J-hook and the treble hook. The study was conducted in 2014 by angling and releasing fish of each species from lakes in the province of Québec, Canada, with the help of volunteers.
2.2 MATERIALS AND METHODS 2.2.1 Study design
To reach our objectives, volunteer anglers caught fish from both species with rod and line, using fishing gear and methods commonly employed for the species’ fishery. A fishing
14
technique, terminal gear type and hook type were used simultaneously as treatments (described below). The choice of techniques and terminal gear types used in treatments was based on the most commonly used methods in each fishery. For the same reason, the circle hook was sometimes only compared to one conventional hook type, if the treatment was only used with a J-hook, for example. For a given technique and terminal gear type, the circle hook was always compared to conventional hook types (J-hook and treble hook), except if one of the hook type was not common to the treatment tested. Thirty-six different anglers with various levels of experience participated to the study: fifteen angled lake trout and twenty-one took part to the brook trout study. Each angler was present for at least one fishing-day, fishing with a minimum of two treatments from the same technique (with a circle and a conventional hook). Since none of the anglers had used circle hooks before, they were explained how the hook should be used according to manufacturers (with a light hook-set; Cooke & Suski 2004; Montrey 1999), but no specific hook-setting technique was enforced. For each fish caught with a treatment, numerous measures were taken by anglers: anatomical hooking location (jaw, mouth, gills, oesophagus or external), bleeding severity (heavy, low or absent) and total length (mm). Anatomical hooking location was converted into a binary variable (deep or shallow) as in DuBois & Kuklinski (2004) to calculate deep hooking rates. To emphasize on the hooks’ effects on mortality, other capture stressors were minimized: anglers were instructed to land fish as quickly as possible with a knotless rubber net (Barthel et al. 2003), to remove hooks with pliers (Malchoff & MacNeill 1995) and to minimize air exposure (Ferguson & Tufts 1992). When a fish was deeply hooked, anglers were instructed to remove the hook except for lake trout, for which the line was cut at the snout, leaving the
hook in place. Cutting the line is a practice that can reduce release mortality of deeply hooked fish by eliminating the injuries caused by the removal of the hook (Schisler & Bergersen 1996). Fish were tagged with 12 mm long Passive Integrated Transponder (PIT) tags (Biomark, Inc.) injected in the dorsal muscle tissue with a syringe injector. Each tag was individually numbered for later identification of fish. Catches were kept in 30 L plastic trays for unhooking and measurements, but were brought in large fine-mesh holding cages placed in lakes within one hour following their capture. They were held in the cages for 48 hours, since most hook-related mortalities occur within that time span (Muoneke & Childress 1994). After that holding period, the status of the fish was assessed, and its release was made if it survived. Mortality rates (%) were then computed for each treatment from the proportions of fish that died. Temperature (°C) and oxygen content (mg•L-1) of the water inside the cages was measured once a day. For both species, a trap-net was used to capture fish for a control treatment, which were processed in the same way as angled fish, to identify a potential effect of retention and handling procedures (including tagging) on fish mortality.
To evaluate fishing success, three different variables were used: catch per unit effort (CPUE), capture success and hooking success. CPUE (fish•rod-1hr-1) values were calculated by dividing the number of fish caught by the number of hours fished by treatment per angler per day. Hooking success (%) was obtained by dividing the number of successful hook-ups (fish landed or missed after a fight of 2 or more seconds) by the number of strikes (a bite with a fight of less than 2 seconds), while capture success (%) was the number of fish landed divided by the number of fish missed plus the number of strikes (Sullivan et al. 2013).
16
2.2.2 Sampling
Lake trout were angled from two different lakes in western Québec, Canada: Lake Caugnawana (46°32’41”N, 78°18’46”W) and Lake Maganasipi (46°32’31”N, 78°24’06”W; Figure 2). These lakes, having respectively 746 ha and 919 ha, contain natural populations of planktivorous and piscivorous lake trout, although lake Caugnawana also hosted a small population of brook trout. Lakes were primarily selected for their high catch rates. Angling was conducted in spring, from May 10th to May 19th in 2014. A total of seven treatments were tested, as two different fishing techniques and two terminal gear types were used (Figure 3). The techniques employed were troll fishing and set-line fishing. Gear types were artificial lures (Acme® Little Cleo and Mepps® Syclops) and natural baits (dead emerald shiners (Notropsis atherinoides)). Trolled lures and baits were dragged from a boat at constant speed, and trolled baits had a flashing spoon attached to the line 18 inches above the minnow, as per the common practice. Set-lined baits were weighed with 1 oz. walking sinkers, and were fished with the line kept slack which was reeled slowly a few seconds after a strike was detected.
Figure 2. Location of the studied lakes for the present study. Squares ( ) represent lake trout lakes, while stars ( ) represent brook trout lakes.
Figure 3. Schematized representation of angling treatments studied for lake trout. Artificial lures shown are an Acme® Little Cleo (a) and a Mepps® Syclops (b), while natural baits shown are dead emerald shiners (Notropsis artherinoides). The most popular technique is indicated by an asterisk.
18
Data for brook trout were collected in Lake Elbow (48°47’49”N, 70°38’03”W) and Castor Gras (48°36’29”N, 70°27’55”W) from Québec’s boreal shield, having respectively 40 ha and 73 ha (Figure 2). Lakes contained allopatric brook trout populations, and were selected for their high capture rates and their representative mean fish weight. Brook trout were angled from June 9th to June 20th, 2014. Again, three technique and gear type combinations were tested to compare the circle hook to conventional hooks, but the treatments differed from lake trout’s (Figure 4). This resulted in a total of eight treatments including the control. Terminal gear types included: spinning lures (Mepps® Aglia), earthworms as natural baits, and dry tied flies (Muddler Minnow and Caddis). Earthworms were used to bait spinning lures, but were also baited on single hooks, 18 inches behind a flashing spoon (Lucky Strike® Silver Lake or Toronto Wobbler). These two tackles were fished by trolling from boat and/or casting, depending on the angler’s preference, while flies were fly-fished from a boat.
Figure 4. Schematized representation of angling treatments studied for brook trout. Shown are an artificial lure (Mepps® Aglia), a natural bait (earthworm) and tied flies (Muddler Minnow (a) and Caddis (b)). The most popular technique is indicated by an asterisk.
2.2.3 Hook metrics
Diverse measures were taken for most of the hooks studied, using the criteria suggested by Serafy et al. (2012). Although they were all labeled as circle hooks by the manufacturers, none of the circle hooks used in this study respected Silvertzen’s three criteria defining a circle hook, because the point angle was sometimes a little greater than 90 degrees, and the front length never measured more than 56 % of the hook’s total length (Annexe I). Hook sizes for each species were chosen according to angler popularity. However, sizes do vary between hook types (mostly “J” and circle), because we tried to select hooks with equivalent point-shank distance. Although the use of inline hooks was prioritized, some hooks were offset. However, offset hooks were straightened with pliers if they were compared in treatments with inline hooks. For lake trout, all the treatments testing treble hooks used Gamakatsu® size 4 “round bend” treble hooks. The artificial lure treatments used size 5/0 OWNER® “SSW” circle hooks and size 4/0 Mustad® “Open Eye Siwash” J-hooks, while the natural bait treatments used size 1/0 OWNER® “SSW” circle hooks and size 2 Gamakatsu® “Walleye Wide Gap” J-hooks (Annexe I). For brook trout, hooks on the spinning lures were size 6 Mustad® Baitholder J-hooks, size 6 Kamakazi® Circle hooks, and size 8 VMC® Round Bend Treble hooks. The same circle and treble hooks were used for the two baited hooks treatments, but generic size 6 knotless J-hook rigs were used instead of the J-hooks listed above. Flies were tied on standard size 12 “J” fly hooks and size 12 Eagle Claw® Lazer Sharp Circle Bait hooks.
20
2.2.4 Statistical analyses
Each treatment had a targeted objective of 50 catches. Data from each species were treated independently, so no comparisons were made between lake trout and brook trout. Using lakes as replicates, we calculated average mortality rates for each treatment from the proportions of fish that were dead at the end of their holding period. Deep hooking rates were obtained from the proportion of fish hooked in the gills or in the oesophagus. For such binary variables (i.e. fish being dead or not), we tested the differences in proportions between hook types for each treatment group by calculating pair-wise odds ratios and testing for their significance with Wald tests, as per Lennox et al. (2015). To prevent Type I errors rates, a Bonferroni correction to the p-value was made when multiple comparisons within a categorical variable were needed (Quinn & Keough 2002). For the mortality, the control treatment was compared to that of the different hook types. Otherwise, we prioritized comparing the circle hook to the treble hook and the J-hook, respectively. For continuous variables (total length and CPUE), the differences between means of different hook types of a treatment group were tested with one-way analysis of variance (ANOVA). Data were transformed until their reached distribution normality and variance homogeneity, but in some cases the ANOVA was applied even if the data did not meet the assumptions, since the test is robust to these assumptions (Quinn & Keough 2002). If a significant difference was revealed, a post-hoc test (Tukey’s HSD) was used to identify which means differed. All statistical analyses were conducted using the R software (R Core Team 2014) with a significance threshold of α = 0.05.
2.3 RESULTS
2.3.1 Lake trout experiment
A total of 738 lake trout were angled and released throughout the experiment, with approximatively 50 captures for each treatment except the control (Table 1). In Lake Caugnawana, 3 brook trout were caught accidentally, but all of the strikes noted by anglers were considered to be from lake trout. While none of the 10 control fish died, 38 (5 % of total) mortalities occurred across the treatments involving hooks. The sample size of the control treatment was yet too small to be relevant (Table 1), so it was rejected from the analyses. The experiment being conducted in spring, water temperature (mean ± standard deviation) in the holding cages averaged 9.5 ± 1.3 °C and dissolved oxygen was always above 10 mg•L-1. All fish were held for at least 40 hrs, but the average holding time was 65 hrs. Fish mean total length was significantly different between the two lakes, with fish being in average bigger in lake Maganasipi (F = 135; p < 0.001). However, within a lake, fish size did not differ between any hook type of the treatment groups for any of the two lakes (p = 0.342 and p = 0.563; Figure A1). Furthermore, fish size was not different between dead and surviving fish (F = 1.002; p = 0.317).
22
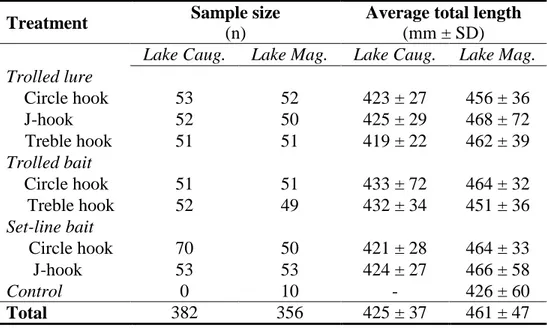
Table 1. Results for lake trout sampling, showing numbers of fish caught for each treatment and their average total length for lakes Caugnawana and Maganasipi.
Treatment Sample size
(n)
Average total length (mm ± SD)
Lake Caug. Lake Mag. Lake Caug. Lake Mag.
Trolled lure Circle hook 53 52 423 ± 27 456 ± 36 J-hook 52 50 425 ± 29 468 ± 72 Treble hook 51 51 419 ± 22 462 ± 39 Trolled bait Circle hook 51 51 433 ± 72 464 ± 32 Treble hook 52 49 432 ± 34 451 ± 36 Set-line bait Circle hook 70 50 421 ± 28 464 ± 33 J-hook 53 53 424 ± 27 466 ± 58 Control 0 10 - 426 ± 60 Total 382 356 425 ± 37 461 ± 47
All treatments combined, a third of angled fish presented signs of bleeding after capture (34.0 ± 0.2 %). Bleeding was more frequent for deeply hooked fish (56 ± 13 %; p < 0.001) and for fish that died (75 ± 9 %; p < 0.001). However, bleeding rate was not significantly different between hook types for any treatment group. For trolled lure treatments, mean mortality was below 3 % and did not vary significantly between hook types (Table 2). Deep hooking rates were also low (< 3 %), indifferently between hooks. Trolled bait treatments led to the same conclusions, as the mortality and deep hooking rates were uniformly low for circle hooks and treble hooks, being always below 6 %. When passively (set-line) fishing a natural bait, odds of observing fish mortality after release were twice higher when using a J-hook as opposed to a circle J-hook. This resulted in a 7 % difference in mean mortality rate between the two hook types. However, this difference was not significant (p = 0.111). For these treatments also, deep hooking was almost four times more likely to occur when using
a J-hook, as a 26 % difference was observed with circle hooks (p < 0.001). While it was not part of the objectives, it is possible to see that when using natural baits, mortality tended to be greater with the set-line fishing technique than when trolling. Indeed, without considering the hook type used, odds of deeply hooking a lake trout were 4.37 times higher when set-line fishing than when trolling (p = 0.013).
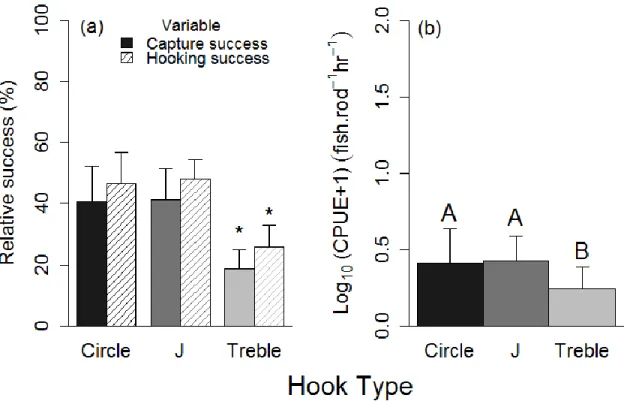
When fishing with circle hooks, fishing success indicators tended to be lower than for other hook types for most treatments (Tables 2 and 3). For the trolled lure treatments, circle hooks led to capture success rates 15 % lower in average than J-hooks and treble hooks (p = 0.009 and p = 0.002; Figure 5a). Hooking success was however equivalent between hook types. Catch per unit effort means for this treatment group were significantly lower for circle hooks than for other hook types, as the formers would catch 1.5 lake trout less per hour (Figure 5b; Table 3). Trolled bait treatments gave about the same results: capture success and hooking success rates were significantly lower with circle hooks than with treble hooks, although the means of CPUE were similar (p = 0.501). Finally, for the set-line treatments the capture success rates were not significantly different between circle hooks and J-hooks (p = 0.062). Successful hook-ups were more likely to happen when using J-hooks, since the hooking success differed between hooks (p = 0.012; Table 2). Nevertheless, it did not translate in significantly different CPUE (p = 0.629; Table 3).
24
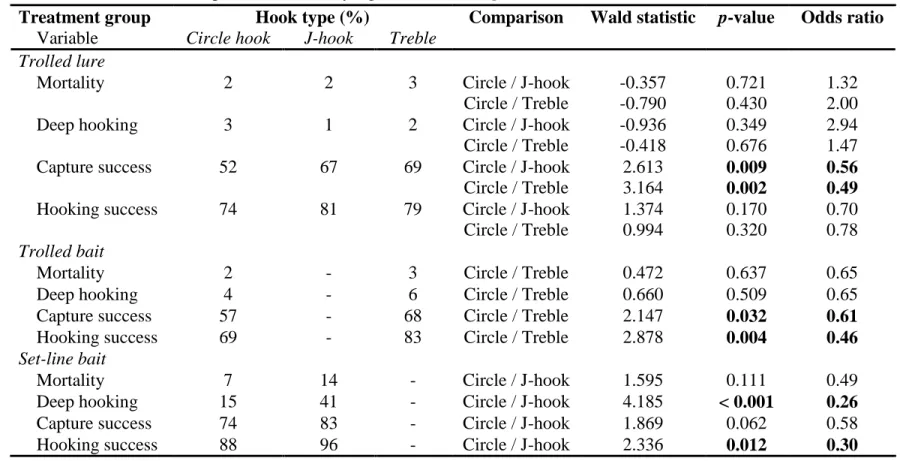
Table 2. Statistical comparison of mortality rates, deep hooking rates, capture success and hooking success of three hook types for lake trout treatments. Values in bold represent statistically significant results (p < 0.05).
Treatment group Hook type (%) Comparison Wald statistic p-value Odds ratio Variable Circle hook J-hook Treble
Trolled lure
Mortality 2 2 3 Circle / J-hook
Circle / Treble -0.357 -0.790 0.721 0.430 1.32 2.00
Deep hooking 3 1 2 Circle / J-hook
Circle / Treble -0.936 -0.418 0.349 0.676 2.94 1.47
Capture success 52 67 69 Circle / J-hook
Circle / Treble 2.613 3.164 0.009 0.002 0.56 0.49
Hooking success 74 81 79 Circle / J-hook
Circle / Treble 1.374 0.994 0.170 0.320 0.70 0.78 Trolled bait
Mortality 2 - 3 Circle / Treble 0.472 0.637 0.65
Deep hooking 4 - 6 Circle / Treble 0.660 0.509 0.65
Capture success 57 - 68 Circle / Treble 2.147 0.032 0.61
Hooking success 69 - 83 Circle / Treble 2.878 0.004 0.46
Set-line bait
Mortality 7 14 - Circle / J-hook 1.595 0.111 0.49
Deep hooking 15 41 - Circle / J-hook 4.185 < 0.001 0.26
Capture success 74 83 - Circle / J-hook 1.869 0.062 0.58
Table 3. Mean catch per unit effort (CPUE) of lake trout for each treatment group. ANOVA results (F-value) are shown on the right, along with degrees of freedom (df) and associated p-values. Standard deviation of each mean is shown in parentheses.
Treatment CPUE (fish•rod-1hr-1) df F-value p-value
Circle hook J-hook Treble
Trolled lure 1.45 (0.2) 2.89 (0.4) 3.05 (0.4) 2 8.71 < 0.001 Trolled bait 1.61 (0.3) - 1.98 (0.4) 1 0.463 0.501 Set-line bait 1.79 (0.3) 2.13 (0.4) - 1 0.236 0.629
Figure 5. Mean capture success (a) and log-transformed catch per unit effort (b) for lake trout angled with trolled artificial lures. Capture success differences were assessed with Wald tests, while catch per unit effort differences were tested with one-way analysis of variance (ANOVA) and Tukey’s Honest Significant Difference (HSD). Asterisks illustrate significant pairwise differences of capture success between circle and conventional hooks, while letters (A, B) show Tukey’s HSD between groups. Error bars represent standard deviations.
26
2.3.2 Brook trout experiment
Out of the 704 brook trout caught-and-released during the experiment, 88 (12 %) were dead at the end of the holding period. Although a sufficient number of catches were made for the control treatment, less than half the targeted sample size was obtained with the fly-fishing treatments and slightly less brook trout than expected were caught with the treble hook treatments (Table 4). Water temperatures averaged 15.8 ± 0.9 °C and oxygen content in the cages was around 7.6 ± 0.5 mg•L-1. Average holding time was 71 hrs, and all fish were held at least 44 hrs. About 5.0 ± 0.9 % of the control fish died during the holding period (Table 5). Bleeding rates resembled those of lake trout, as 32 ± 8 % of total fish caught showed signs of bleeding. Fly-fishing caused minimal bleeding (2 %), while it was more frequent for natural bait treatments, averaging 40 %. Bleeding varied little between treatments, as it was only different between treble hooks (lower) and circle hooks when using a natural bait (p = 0.028). Otherwise, when using an artificial lure, bleeding dwelled around 30 % but was similar between hook types. Fish total length did not vary between the two lakes (F = 0.085; p = 0.771). However, dead fish were in average bigger than surviving fish (F = 15.29; p < 0.001), and for one of the two lakes fish size was only different between the natural bait and the fly-fishing treatments (F = 7.43; p < 0.001; Figure A2).
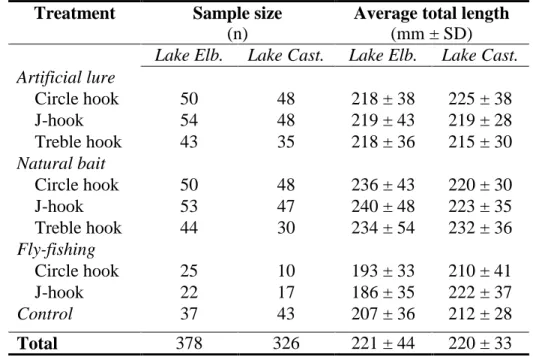
Table 4. Results for brook trout sampling, showing numbers of fish caught for each treatment and their average total length for Lake Elbow and Castor Gras.
Treatment Sample size (n)
Average total length (mm ± SD)
Lake Elb. Lake Cast. Lake Elb. Lake Cast.
Artificial lure Circle hook 50 48 218 ± 38 225 ± 38 J-hook 54 48 219 ± 43 219 ± 28 Treble hook 43 35 218 ± 36 215 ± 30 Natural bait Circle hook 50 48 236 ± 43 220 ± 30 J-hook 53 47 240 ± 48 223 ± 35 Treble hook 44 30 234 ± 54 232 ± 36 Fly-fishing Circle hook 25 10 193 ± 33 210 ± 41 J-hook 22 17 186 ± 35 222 ± 37 Control 37 43 207 ± 36 212 ± 28 Total 378 326 221 ± 44 220 ± 33
For the artificial lure treatments, mortality of all hook types was similar to the control, averaging 3.7 % (Table 5). Deep hooking rates were also low when an artificial lure was used, being always below 2.5 %. On the other hand, natural bait treatments led to mortality rates significantly higher than the control for the circle and the J-hook, as odds of having release mortality when using those hook types were respectively 7 and 11 times higher than the control’s (Figure 6a). However, using a treble hook with natural baits provided mortality rates equal to the control (p = 0.924). Deep hooking rates were significantly higher when using a J-hook than other hook types (Figure 6b). Fly-fishing treatments caused mortality to brook trout up to 10 % for circle hooks, which represents twice the mortality of the control, although the difference was insignificant (p = 0.106). On the other hand, no deep hooking occurred when anglers were fly-fishing (Table 5).
28
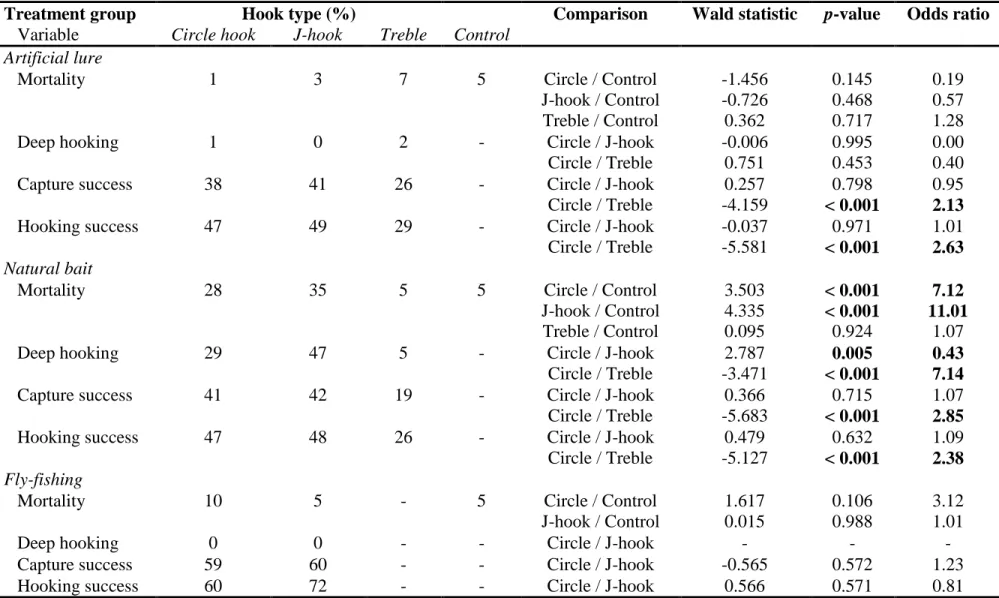
Table 5. Comparison of mortality rates, deep hooking rates, capture success and hooking success of three hook types for brook trout treatments. Values in bold represent statistically significant results (p < 0.05).
Treatment group Hook type (%) Comparison Wald statistic p-value Odds ratio
Variable Circle hook J-hook Treble Control Artificial lure
Mortality 1 3 7 5 Circle / Control
J-hook / Control Treble / Control -1.456 -0.726 0.362 0.145 0.468 0.717 0.19 0.57 1.28
Deep hooking 1 0 2 - Circle / J-hook
Circle / Treble -0.006 0.751 0.995 0.453 0.00 0.40
Capture success 38 41 26 - Circle / J-hook
Circle / Treble 0.257 -4.159 0.798 < 0.001 0.95 2.13
Hooking success 47 49 29 - Circle / J-hook
Circle / Treble -0.037 -5.581 0.971 < 0.001 1.01 2.63 Natural bait
Mortality 28 35 5 5 Circle / Control
J-hook / Control Treble / Control 3.503 4.335 0.095 < 0.001 < 0.001 0.924 7.12 11.01 1.07
Deep hooking 29 47 5 - Circle / J-hook
Circle / Treble 2.787 -3.471 0.005 < 0.001 0.43 7.14
Capture success 41 42 19 - Circle / J-hook
Circle / Treble 0.366 -5.683 0.715 < 0.001 1.07 2.85
Hooking success 47 48 26 - Circle / J-hook
Circle / Treble 0.479 -5.127 0.632 < 0.001 1.09 2.38 Fly-fishing
Mortality 10 5 - 5 Circle / Control
J-hook / Control 1.617 0.015 0.106 0.988 3.12 1.01
Deep hooking 0 0 - - Circle / J-hook - - -
Capture success 59 60 - - Circle / J-hook -0.565 0.572 1.23
For brook trout, capture success and hooking success rates varied significantly between lakes, as odds of capturing or hooking a fish with any treatment were twice as high in Lake Elbow (p < 0.001). Despite this, the same differences between treatments were observed within each lake, so data from the two lakes were pooled for analyses. For the artificial lure treatments, capture and hooking success of circle hooks was significantly higher than that of treble hooks, but not different from J-hooks (Table 5). With artificial lures, CPUE did differ between hooks, as treble hooks would catch in average one less brook trout per hour (Table 6). For the natural bait treatments, hooking success and capture success of circle hooks was always significantly higher than trebles’, but indifferent of that of J-hooks (Table 5; Figure 7a). CPUE were also significantly higher for circle and J-hooks (Table 6; Figure 7b). For fly-fishing treatments, the capture success, hooking success and CPUE were equivalent between the circle hooks and J-hooks (Tables 5 and 6).
Table 6. Mean catch per unit effort (CPUE) of brook trout for each treatment group. ANOVA results (F-value) are shown on the right, along with degrees of freedom (df) and associated p-values. Standard deviation of each mean is shown in parentheses.
Treatment CPUE (fish•rod-1hr-1) df F-value p-value
Circle hook J-hook Treble
Artificial lure 2.06 (0.37) 1.90 (0.39) 1.18 (0.29) 2 3.64 0.032 Natural bait 1.87 (0.38) 1.83 (0.21) 0.84 (0.13) 2 7.55 0.001 Fly-fishing 1.02 (1.13) 1.42 (1.12) - 1 0.60 0.451
30
Figure 6. Mean mortality (a) and deep hooking (b) rates for brook trout angled with natural baits treatments. Mortality of each hook type was compared to the control (Ctrl), while deep hooking rates of J-hooks and treble hooks were respectively compared to the circle hook. Error bars represent standard deviations, and letters illustrate pairwise differences of Wald tests between treatments.
Figure 7. Mean capture success and hooking success (a), and log-transformed catch per unit effort (b) for brook trout angled with natural baits and different hook types. Asterisks illustrate pairwise differences of Wald tests between circle and treble hooks, while letters represent Tukey’s HSD between hook types. Error bars represent standard deviations.
2.4 DISCUSSION 2.4.1 Lake trout
In this study, the objectives were to evaluate and compare the release mortality and fishing success of circle hooks to conventional hook types in the recreational fisheries of lake trout and brook trout. Fish release mortality is an important factor to consider when enforcing regulations involving the release of a fraction of the catch. Meanwhile, fishing success is an important variable for anglers, since it is a relevant component of fishing quality. Recent lake trout release mortality estimates vary between 9-32 % (Bartholomew & Bohnsack 2005). The
32
present study shows a global mortality of 5 %, across different hook types and angling techniques representative of its fishery. A previous study conducted on Lake Maganasipi reported mortality rates between 8 % and 14 % when using the same fishing treatments (except the ones with a circle hook; Nadeau & Lapointe 1991). Since most of the rates reported here are below these values, it is possible that our results underestimate the real release mortality of the fishery for a few reasons. First of all, the study was conducted in early spring, at a moment where the risk of mortality is probably at its lowest, since the lakes’ waters were cold and well aerated. In these conditions, fish metabolism is low, which reduces bleeding and minimizes wound infection risks of released lake trout (Cooke & Suski 2005; Gale et al. 2013). Second, deeply hooked lake trout were released with the hook still in mouth as the line was cut, a technique that has proved to be effective to increase survival rates for other salmonids (Mason & Hunt 1967; Schisler & Bergersen 1996; Tsuboi et al. 2006). We feel that most lake trout anglers would rather recover their hook than cut the line in these conditions, so that the technique used in this study does not reflect the reality of the fishery, even though it is encouraged by Québec’s ministère des Forêts, de la Faune et des Parcs. Therefore, the mortality risk of treatments with high deep hooking rates is underestimated. For example, if deeply hooked lake trout for which the line was cut had been considered as dead fish, mortality rates could have been as high as 40 % for the set-line fishing treatment with a J-hook. As a whole, these factors could explain the results obtained and should be taken into account when estimating the release mortality of lake trout’s recreational fishery. Although the sample size of the control was too little to be considered, it is most likely that the observed mortalities were caused by the angling rather than by the experimental
handling procedures. The vast majority of the mortalities observed were immediate (i.e. fish were dead upon unhooking, before entering the holding cages). Thus, the differences in mortality observed between treatments, even when scarce, are representative of the effect of the treatment used. Results indicate that the mortality is fairly low for treatments involving troll-fishing and treble hooks. Troll-fishing is a technique considered active, for which the lure or bait is dragged at constant speed, leaving little time for fish to swallow the tackle, and needing a sharp and reactive hook-set to set the hook (Sullivan et al. 2013). When such a technique is used, a possible mechanism could be that fish mostly bite the tackle from behind, in a way that the hook is the first thing that comes to their contact, in an angle optimal to lodge itself in the mouth (Zimmerman & Bochenek 2002). These conditions tend to reduce the likelihood of deep hooking and therefore causes fewer mortalities to occur (Gutowsky et al. 2011). As for treble hooks, their bigger width compared to single hooks might make them harder to swallow by fish, leading more often to jaw-hooking which causes minimal damage to fish (see Table A1). However, in the rare case where a treble hook is deeply hooked, its three-pronged design makes it harder to unhook and causes severe tissue damage (Falk et al. 1974). In literature, artificial lures have shown to cause less mortality than baits for many salmonids (Pauley & Thomas 1993; Schisler & Bergersen 1996; Taylor & White 1992). The obtained results highlight that it may not always be the case: the choice of terminal gear type did not impact on the resulting mortality rate when the tackle was troll-fished. However, when a natural bait was fished with the set-line technique, which is somewhat passive, lake trout probably disposed of more time to swallow the bait before the hook was set, causing
34
more frequent deep hooking situations, and possibly explaining the great differences in deep hooking rates between passively and actively fished baits.
When comparing mortality rates between hook types, results indicate that circle hooks can reduce release mortality compared to conventional hooks by providing lower deep hooking rates. This finding confirms results of many recent studies on the topic (Cooke & Suski 2004; High & Meyer 2014; Lennox et al. 2015; Sullivan et al. 2013). That being said, the active techniques used in lake trout recreational fisheries typically cause little deep hooking hence little mortality, which tends to mask the benefit of using circle hooks. In situations where the mortality risk of lake trout is higher (i.e. deep hooking is frequent) like set-line fishing, mortality with circle hooks was slightly lower than with J-hooks. As mentioned above, this difference could be greater, because fish caught with J-hooks were deeply hooked 25 % more often than when caught with circle hooks, but the line was cut in these cases. Set-line fishing with natural baits is the main technique involved in ice-fishing, and has proved to lead to relatively high release mortality for lake trout (Dextrase & Ball 1991; Persons & Hirsch 1994). Although lake trout fishing is not allowed during the winter in Québec, ice-fishing is sometimes practiced in lakes where lake trout can be accidentally caught (Ministère du Développement durable 2014).
For the comparison of fishing success, results suggest that fishing success is generally lower when fishing lake trout with circle hooks, except when using a passive technique. Regardless of the terminal gear type used, the hooking success, capture success and CPUE of circle hooks were below those of conventional hook types when the tackle was trolled. Anyhow, circle hooks did not have a substantial effect on reducing the mortality for this