Technology researchers and makes it freely available over the web where possible.
This is an author-deposited version published in: https://sam.ensam.eu Handle ID: .http://hdl.handle.net/10985/7319
To cite this version :
Ilyass KHLIFA, Olivier COUTIER-DELGOSHA, Sylvie FUZIER, Marko HOCEVAR, Alexandre VABRE, Kamel FEZZAA - VELOCITY MEASUREMENTS IN CAVITATING FLOWS USING FAST X-RAY IMAGING - 2013
Any correspondence concerning this service should be sent to the repository Administrator : [email protected]
VELOCITY MEASUREMENTS IN CAVITATING FLOWS
USING FAST X-RAY IMAGING
I. KHLIFAa, O. COUTIER-DELGOSHAa, S. FUZIERa, M. HOCEVARb, A. VABREc, K. FEZZAAd a. Arts et Métiers ParisTech, LML, UMR CNRS 8107, 8 Bd Louis XIV, 59046 LILLE, (France)
b.Laboratory for water and turbine machines, Univ. of Ljubljana, Askerceva 6, Ljubljana 1000, (Slovenia)
c. CEA LIST, 91191, Gif sur Yvette Cedex, (France)
d. X-ray Science Division, Argonne National Laboratory, Argonne, Illinois 60439, (USA)
Abstract:
A promising method to measure velocity fields in complex two-phase flows such us cavitating flows is presented. Dynamics of the liquid phase and the bubbles are both investigated. The measurements are based on ultra fast X-ray imaging performed at the APS (Advanced Photon Source) of the Argonne National Laboratory. The experimental device consists of a millimetric Venturi test section associated with a transportable hydraulic loop. Various configurations of velocity, pressure, and temperature have been investigated. Radio-opaque particles are used as tracers for the liquid phase, in association with a multipixel sensor to record the successive positions of the particles. The use of X-rays instead of light solves the problems related to light reflection and dispersion on phase boundaries, since X-rays penetrate a gas/liquid flow in straight lines. Images contain simultaneously the information related to the particles (for PIV analysis in the liquid), to the vapour bubbles (for PIV in the gas). The slip velocity between vapour and liquid is calculated.
Résumé :
Le présent papier illustre une méthode expérimentale non-intrusive permettant de mesurer les champs de vitesses dans des écoulements diphasiques complexes tels que les écoulements cavitants. Basée sur l’imagerie par rayons X, cette technique permet d’obtenir simultanément et instantanément la dynamique des deux phases respectives (liquide et vapeur) ainsi que le taux de vide dans l’écoulement. Les expériences ont été conduites au synchrotron de l’APS (Illinois-USA). Le banc d’essais consiste en une boucle hydraulique transportable comportant un venturi millimétrique dans lequel une poche de cavitation est créée. Des particules radio-opaques sont utilisées comme traceurs dans le liquide. L’utilisation de cette technique pour de tels écoulements comporte un avantage considérable par rapport aux techniques classiques car elle permet de résoudre les problèmes de réflexion et de dispersion de la lumière sur les différentes interfaces. Les images obtenues contiennent à la fois les particules et les bulles et nécessite un traitement avant de calculer les champs de vitesses des deux phases et les vitesses de glissements entre ces dernières.
Key words:
cavitation, two-phase flow, X-ray imaging, PIV measurements1
Introduction
Cavitation in rotating machinery leads to considerable difficulties in both design and maintenance operations. Indeed, it is associated with performance drop, blade erosion, vibrations that may lead to damage, and noise due to vapour collapse close to the solid walls. Therefore, a general understanding of the physics that governs flow vaporisation and condensation is required to remove or at least to reduce these effects. A special attention is paid to the mechanisms of generation of instabilities involved in cavitating flows. The understanding of the flow dynamics and structure is of prime importance for the understanding and the control of such mechanisms. However, velocity measurements within cavitating flows encounter strong difficulties. Only a few results have thus been obtained nowadays, although such experiments may be decisive for the physical modelling of cavitation. Let us briefly recall the double optical probe measurements performed in the LEGI laboratory (France) by Stutz and Reboud [12], which have enabled the measurement of time-averaged and phase-averaged velocities in the main flow direction, with an uncertainty close to 20%. PIV measurements have also been performed in USA by the teams of J. Katz [7] and R. Arndt [14] in the wake of sheet cavities, and more recently in Germany by Dular et al. [3, 4]. In this last study, nice results have been obtained by using a Laser Induced Fluorescence (LIF) technique coupled with measurements very
close to one vertical side wall of the test section. This position of the laser light sheet is imposed by the opacity of the sheet cavity when the void fraction is higher than 10 or 20%, which makes hazardous the detection of the particles with a camera located outside from the test section. In the present study, this issue was addressed with an original technique based on ultra fast X-ray imaging, in collaboration with the LIST laboratory of CEA (French Atomic Commission). High-frequency measurements of the local volume fraction of vapour were already performed a few years ago [2] in the scope of such collaboration. The present work consists of an extension of this method to the measurement of the velocities in the gaseous and liquid phases. Ultra fast X-ray imaging has been applied to situations of cavitating flows on a 2D Venturi type section. The flow is seeded with radio-opaque particles that can be detected by X-ray absorption and/or phase contrast enhancement. The vapour bubbles are detected also by this second method. So, such technique enables to obtain by image processing derived from PIV analysis i) the liquid velocity field (from the motion of the particles), ii) the vapour velocity field (from the motion of the bubbles), and the distribution of the vapour volume fraction (from the difference of X-ray absorption in gas and liquid, see [2]). The present paper focuses on the experimental setup and the process of image analysis. Both the hydraulic test rig and the X-ray fast imaging device are presented, several techniques of image analysis are discussed, and first results are presented. Note that this work has been performed in the scope of an original collaboration between researchers in fluid mechanics from LML laboratory and Ljubljana Univ., and specialists of X-ray imaging from the CEA-LIST and the APS of the Argonne National Laboratory.
2
Experimental set-up
Measurements are based on the X-ray absorption technique presented previously by Coutier-Delgosha et al. [2]. Basically, an X-ray source is located on one side of the test section, and a detector on the other side. Radio-opaque particle are injected in the flow. Each time a particle crosses the X-ray beam, local absorption is increased, so intensity received by the detector decreases. To detect this phenomenon, a detector with high spatial resolution must be used. It is composed here of the X-ray sensor, a crystal that converts X-ray into visible light, and a high speed camera that record this information. To detect very small particles that move very fast (the order of magnitude of the velocity is 10 m/s), the X-ray beam must be of very high intensity. Feasibility studies have shown that no portable X-ray source available at the CEA was appropriate, so the APS (Advanced Photon Source) of the Argonne National Laboratory (USA) was used.
2.1
Hydraulic test rig
Using the APS beam has resulted in severe requirements for the hydraulic experimental setup that generates the studied 2D sheet cavity. First of all, the whole installation should be portable in order to travel by plane, and also the test section should be designed with small dimensions, since all material and water thickness crossed by the beam must be reduced as much as possible to ensure a satisfactory ratio signal/noise. A small size test rig has thus been realized. Cavitation is obtained downstream from a 2D Venturi profile which shape is identical to the one used previously by Stutz and Reboud [11]. Its definition can be found in Coutier-Delgosha et al. [1]. It is characterized by an 18° convergence angle and an 8° divergence one.
2.2
Design of the test section
The test section, which is about 30 cm long, is composed of several parts manufactured in Plexiglas. As it can be seen in FIG. 1, the main part (in blue), and the upper part (in brown) forms the top of the test section. Supplementary inserts (in pink) on the vertical and bottom faces of the main part constitute the side walls and the floor (Convergent/divergent) of the test section, respectively, in the cavitation area.
Indeed, to reduce as much as possible the Plexiglas width crossed by the X-ray beam, a 0.5 mm thickness is applied (see FIG. 1). Moreover, the water width is l = 4 mm only, and the height of the test section maximum 5 mm. Thus, two passages for the X-ray beam are available: a horizontal one and a vertical one. This enables to obtain side views and top views of the sheet cavity.
2.3
X-ray imaging
X-ray techniques available at the APS of the Argonne Synchrotron have been applied previously to the measurement of velocities in low-speed flows, which requires low frequency acquisition only [9]. Observations of rapid liquid flows in micro-channels have been also conducted recently by Vabre et al. [13]. The challenge of the present work is to perform velocity measurements in configurations of high speed cavitating flows, with velocity varying between 10 and 20 m/s. For that purpose, high frequency data acquisition is necessary, in order to detect the sheet cavity fluctuations. The maximal energy during experiments was 30 keV white beam, and average 13 keV. The x-ray beam size was approximately 1.7 x 1.3 mm2, and the total number of incident photons on the sample was about 1012 ph/s. The source-to-sample distance was about 60 m, and the sample-to-detector distance was about 50 cm. A 400 µm thick CdWO4 crystal was used to convert X-rays to visible light. The image was magnified using a microscope lens (x5) and recorded with a high-speed camera APX-RS Photron. A 10000 fps frequency was applied, which enables a resolution of 512x512 pixels where the pixel size is 3.7 µm. The beam is equipped with two shutters: i) a slow one (1Hz) opened 30 ms every second, which limits the dose delivered to the sample and the detector, ii) a fast one, which drives time-resolved experiments [8]. The main issue related to ultra-fast acquisition is synchronization of the X-ray flashes, the opening of the fast shutter, and the camera frames, in order to obtain appropriate pairs of images for PIV analysis. Two X-ray flashes are separated by 3.6 µs, and their duration is 500 ns.
FIG.2 – X-Ray imaging experiment
2.4
Radio-opaque particles
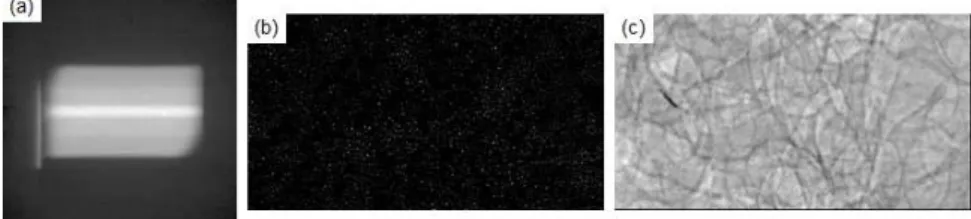
Radio-opaque particles are used as tracers for the liquid phase, in association with a multi-pixels sensor to record the successive positions of the particles. Then, nearly standard PIV treatments are applied to derive the velocity fields from the positions of the tracers. The use of X-rays instead of light solves the problem of light reflection and dispersion on phase boundaries, since X-rays penetrate a gas/liquid flow in straight lines. For the vapour phase, a similar image processing is performed, but it applies on bubble interfaces, not on tracers. Silver coated hollow glass spheres of diameter 17 µm were found to be appropriate. Images contain simultaneously the information related to the particles (for PIV analysis in the liquid), to the vapour bubbles (for PIV in the gas). Several successive acquisitions at different positions are necessary to obtain the complete ray image of the whole sheet cavity. For that purpose, the test section is moved in front of the X-ray beam.
3.
PIV analysis
Images acquired by X-ray imaging are processed to obtain the velocity field in the liquid and vapour phases. For both cases, a PIV treatment based on cross correlation of successive images obtained from two consecutive X-ray flashes is applied. However, both particles and bubbles are visualized on the images, as can be seen for example in FIG. 3. Complex image processing is thus required to eliminate bubbles (to obtain liquid velocities) or particles (for vapour velocities).
3.1
PIV in liquid phase
Figure 4 and 5 show the successive treatments applied to the initial recorded image to obtain the image of particles that enables to perform PIV in the liquid phase : i) image crop and several brightness homogenizations, ii) multi-parameter interface and vapour detection for suppression of bubbles, iii) background suppression. The process of bubbles elimination is described in a previous paper [10]
3.2 PIV in the vapour phase
For vapour phase treatment, particle images obtained for PIV in liquid phase are used. In fact, the previous treatment enables to localise the particles in each images. Thus, they could be deleted from the initial images. These particles are then replaced by the average of the local grey level intensity.
FIG. 6- (a) Initial image, (b) particle detection, (c) image of bubbles only
4.
Results
The reference hydraulic conditions in the experiments were set to a temperature T = 20°C, a mass flow rate Q = 10 l/min, and a mean sheet cavity size Lcav = 9-10 mm. Other values of mass flow rate, sheet cavity
length and temperature have been investigated, but the discussion in the present paper will focus on the reference conditions only. Image processing detailed in the previous section has been applied to obtain the velocity fields in the liquid phase and in the vapour phase. At reference flow conditions, images were recorded for seven contiguous positions of the test section in front of the X-ray beam, in order to scan the whole sheet cavity. Position 1 corresponds to the upstream end of the cavitation area, at the Venturi throat, while position 7 is located at the rear part of the sheet cavity (see examples of positions 1 and 2 in FIG. 3). The sheet cavity on the considered Venturi was systematically unsteady in the experiments performed in the past at large scale [14]: periodical fluctuations of the cavity including large scale vapour cloud shedding was obtained. The major role played by the re-entrant jet mechanism in such behaviour was demonstrated in the last two decades by many authors: when this jet reaches the cavitation sheet interface, the cavity breaks off and its downstream part is convected by the main flow until it collapses. This process, initially evocated by Furness and Hutton [6], was later confirmed by measurements performed with electrical impedance probes [11] and double optical probes [13, 14]. These experiments have clearly shown that the periodic cycle of the cavity is strongly correlated with the progression of the re-entrant jet.
However, in the present case such behaviour is not obtained: only small scale fluctuations of the cavity length are observed, without any shedding. This has been suggested first by FFT performed on the signals of pressure sensors located downstream from the sheet cavity, and confirmed by the visualization of high speed videos. The reason for this flow stabilization at small scale has been analyzed in detail [5], and it has been found that the small height of the test section is the most influent parameter: reducing drastically the height down to a few millimetres leads to a strong modification of the shedding process: vapour cloud detachment
FIG. 4- Image processing for PIV in the liquid FIG. 5- (a) before detection, (b) interface detection (pixels coloured in black), (c) vapour detection
is completely stopped if width of the test section is also very small (which is the case in the present experiments), while partial intermittent shedding is still obtained if the width is increa
was attributed to the inability of the reverse flow to turn upward, cut the cavity and provoke its partial detachment. The small height induces a premature stop of the re
less pronounced low frequency oscillations of the attached cavity, without any shedding. Despite this flow stabilization, an intermittent reverse flow is still obtained, as can be seen in shows the mean velocity fields in the liquid phase for positions 1 to 7.
presents a zoom of the results at positions 1 and
FIG. 8 - Mean veloc
Very low velocities are obtained in the bottom part of the sheet cavity. Time slightly negative, as can be seen in
similar to the data obtained previously at large scale in the
intermittent reverse flow in this area. Note also the increase of velocity at the top of the sheet cavity, where a liquid flow and intermittent vapour
between the sheet cavity area and the main liquid flow. Similar results are obtained in the
can be seen in FIG. – 10 at positions 1 and 2. Comparison between both velocity fields enable to obtain the slip velocity, i.e. the local mean velocity difference between liquid and
FIG. 9 - Time-averaged velocity profiles
FIG. – 11 shows time-averaged velocity profiles in both phases at the mi between liquid and vapour are obtained in
differences are more important. Liquid velocity is higher that the phases behave differently inside a
carried out by the main stream in the wake of the sheet cavity, which was expected. However, note that the slip velocity is of the same order of magnitude than the
results are given here: the amplitude of the instantaneous slip velocity is much close to the liquid velocity. It shows that neglecting
prejudicial for the correct determina
FIG. 11 - Time averaged velocity profiles in liquid
is completely stopped if width of the test section is also very small (which is the case in the present experiments), while partial intermittent shedding is still obtained if the width is increa
was attributed to the inability of the reverse flow to turn upward, cut the cavity and provoke its partial detachment. The small height induces a premature stop of the re-entrant jet progression, leading to more or
requency oscillations of the attached cavity, without any shedding. Despite this flow stabilization, an intermittent reverse flow is still obtained, as can be seen in shows the mean velocity fields in the liquid phase for positions 1 to 7. For a better understanding, presents a zoom of the results at positions 1 and 3 only, with instantaneous X-ray images in the background.
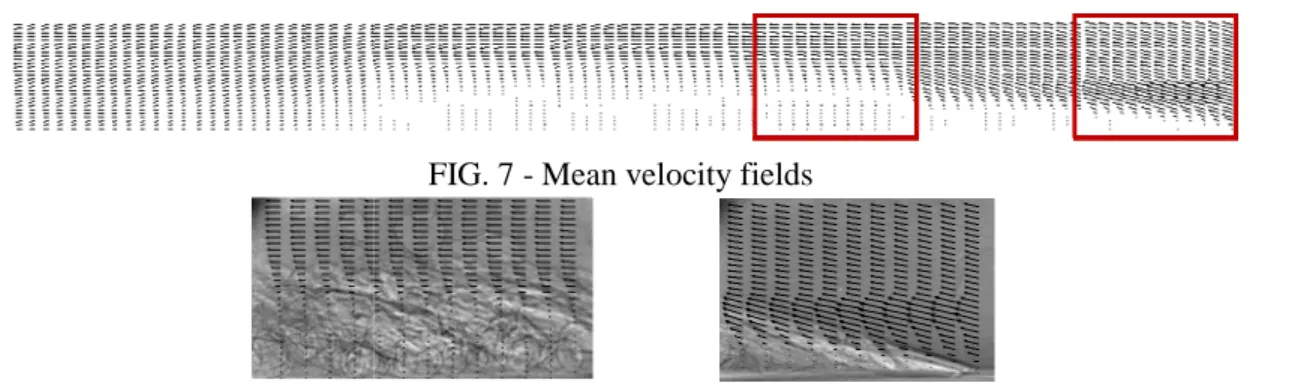
FIG. 7 - Mean velocity fields
Mean velocity fields: zoom on positions 1 and 3
are obtained in the bottom part of the sheet cavity. Time-averaged values are even slightly negative, as can be seen in FIG. – 9 for two velocity profiles. This result, which is qualitatively similar to the data obtained previously at large scale in the vapour phase [12], demonstrates the occurrence of reverse flow in this area. Note also the increase of velocity at the top of the sheet cavity, where a
vapour bubbles coexist. This phenomenon may be related to the between the sheet cavity area and the main liquid flow. Similar results are obtained in the
at positions 1 and 2. Comparison between both velocity fields enable to obtain the local mean velocity difference between liquid and vapour.
averaged velocity profiles FIG. 10 - Time averaged velocity fields of averaged velocity profiles in both phases at the middle of positions
are obtained in all positions, especially in positions iquid velocity is higher that the vapour one in all position.
a sheet cavity. This phenomenon means that bubbles are not perfectly carried out by the main stream in the wake of the sheet cavity, which was expected. However, note that the slip velocity is of the same order of magnitude than the vapour velocity. Moreover, only time
results are given here: the amplitude of the instantaneous slip velocity is much higher, and sometime very close to the liquid velocity. It shows that neglecting this effect in numerical modelling
prejudicial for the correct determination of the dynamics of the vapour structures.
Time averaged velocity profiles in liquid (red) and vapour (blue)
is completely stopped if width of the test section is also very small (which is the case in the present experiments), while partial intermittent shedding is still obtained if the width is increased. Such behaviour was attributed to the inability of the reverse flow to turn upward, cut the cavity and provoke its partial entrant jet progression, leading to more or requency oscillations of the attached cavity, without any shedding.
Despite this flow stabilization, an intermittent reverse flow is still obtained, as can be seen in FIG. - 7, which better understanding, FIG. – 8 ray images in the background.
averaged values are even for two velocity profiles. This result, which is qualitatively ], demonstrates the occurrence of reverse flow in this area. Note also the increase of velocity at the top of the sheet cavity, where a bubbles coexist. This phenomenon may be related to the local friction between the sheet cavity area and the main liquid flow. Similar results are obtained in the vapour phase, as at positions 1 and 2. Comparison between both velocity fields enable to obtain the
averaged velocity fields of vapour ddle of positions 1 to 7. Differences
positions 5 and 6 where these in all position. Hence, the two phenomenon means that bubbles are not perfectly carried out by the main stream in the wake of the sheet cavity, which was expected. However, note that the velocity. Moreover, only time-averaged higher, and sometime very this effect in numerical modelling may be very
Different tests of validation have been carried out. They all show that the errors in both phases are very small (less than one pixel) and are much lower than the observed differences between the two phases.
5.
Conclusion
In this paper, an original experiment based on X-ray imaging has been presented. The objective is the simultaneous determination of the liquid and vapour velocities in a cavitating flow. Only conditions of small scale fluctuations of a 2D sheet cavity, without vapour shedding, were considered here. Images of radio-opaque particles and vapour bubbles have been recorded at high frequency, and post-processing has enabled to obtain images of particles only or bubbles only, for the purpose of PIV treatment. Velocity fields have been obtained at reference flow condition in both phases, which enables to determine the slip velocity between phases. Significant magnitude of time-averaged slip velocity has been obtained in the sheet cavity wake and in the area of re-entrant jet inception, which suggests that this phenomenon should be included in numerical simulations.
Acknowledgments
The PhD of I. Khlifa is supported by CETIM and EDF in the scope of the CIRT organization. Use of the Advanced Photon Source at Argonne National Laboratory was supported by the U. S. Department of Energy, Office of Science, and Office of Basic Energy Sciences.
References
[1] Coutier-Delgosha, O., Fortes-Patella, R., Reboud, JL., Stutz, B., 2005, "Test case number 30: Unsteady cavitation in a Venturi type section". In Validation of Advanced Computational Methods for Multiphase Flow, Editors, Lemonnier, H., Jamet, D., Lebaigue, O., Begell House Inc.
[2] Coutier-Delgosha, O., Stutz, B., Vabre, A., Legoupil, S., 2007, "Analysis of the cavitating flow structure by experimental and numerical investigations", J. of Fluid Mechanics 578: 171-222.
[3] Dular, M., Bachert, R., Stoffel, B. & Sirok, B., 2004, “Experimental evaluation of numerical simulation of cavitating flow around hydrofoil”, European J. of Mechanics B/ Fluids, 24(4): 522-538.
[4] Dular, M., Bachert, R., Schaad, C., Stoffel, B. (2007), Investigation of a re-entrant jet reflection at an inclined cavity closure line, European J. of Mechanics B/ Fluids, 26 (5), 688-705.
[5] Dular, M., Coutier-Delgosha, O., Khifa, I., Fuzier, S., 2012, “Influence of scale effect on unsteady cavitation", submitted to the ISROMAC 14 conference, February 27 - March 02, Honolulu, USA.
[6] Furness, R.A. & Hutton, S.P., 1975, "Experimental and Theoretical Studies of two-dimensional Fixed-Type Cavities". J. Fluids Eng. 97:515-522.
[7] Gopalan, S. & Katz, J., 2000, “Flow structure and modeling issues in the closure region of attached cavitation”, Physics of fluids 12, 895-911.
[8] Gembicky, M., Oss, D., Fuchs, R., Coppens, P., 2005, “A fast mechanical shutter for submicrosecond time-resolved synchrotron experiments”, J. Synchrotron Rad. 12:665-669.
[9] Im, K-S., Fezzaa, K., Wang, Y. J., Liu, X., Wang, J., Lai, M-C, 2007, “Particle tracking velocimetry using fast X-ray phase-contrast imaging”, Applied physics letters 90, 091919.
[10] Khlifa, I., Coutier-Delgosha, O., Hocevar, M., Fuzier, S., Vabre, A., Fezzaa, K., Lee, W.K., 2012, “X-Ray Imaging for Velocity Measurements in Cavitating Flows” submitted to the CAV2012 symposium, August 13 - 16, Singapore.
[11] Pham, T.M., Larrarte, F. & Fruman, D.H., 1999, “Investigation of Unsteady Sheet Cavitation and Cloud Cavitation Mechanisms”, J. Fluids Engng. 121, 289-296.
[12] Stutz, B., & Reboud, JL., 1997, "Experiments on Unsteady Cavitation", Exp. in Fluids 23:191-198. [13] Vabre, A., Legoupil, S., Colin, S., Geoffroy, S., Lee, W.K., Fezzaa, K., 2008, “X-ray propagation-base phaseenhanced imaging of the meniscus of a capillary flow in a rectangular microchannel”, Int. J. of Heat and Technology 26(1): 109-115.
[14] Wosnik, M., Qin, Q., Arndt, R.E.A., 2005, “Identification of Large Scale Structures in the Wake of Cavitating Hydrofoils Using LES and TR-PIV”, 58th Annual Meeting of the Division of Fluid Dynamics, Chicago, USA.