Science Arts & Métiers (SAM)
is an open access repository that collects the work of Arts et Métiers Institute of Technology researchers and makes it freely available over the web where possible.
This is an author-deposited version published in: https://sam.ensam.eu Handle ID: .http://hdl.handle.net/10985/17322
To cite this version :
Mohand OUARABI, Ruben PEREZ MORA, Claude BATHIAS, Thierry PALIN-LUC - Very high cycle fatigue strength and crack growth of thin steel sheets - Frattura ed Integrità Strutturale - Vol. 10, n°36, p.112-118 - 2016
Any correspondence concerning this service should be sent to the repository Administrator : archiveouverte@ensam.eu
M. Ouarabi et alii, Frattura ed Integrità Strutturale, 36 (2016) 112-118; DOI: 10.3221/IGF-ESIS.36.11
112
Focussed on Crack Paths
Very high cycle fatigue strength and
crack growth of thin steel sheets
Mohand Ouarabi,
Ruben Perez Mora, Claude Bathias
Université Paris Ouest Nanterre La Defense, LEME, 50 rue de Sèvres, Ville d’Avray, France mohand.ouarabi@yahoo.fr, ruben.perez-mora@hotmail.fr, claude@bathias.com
Thierry Palin-Luc
Arts et Métiers Paris Tech, I2M, CNRS, Université de Bordeaux, Esplanade des Arts et Métiers, Talence, France thierry.palin-luc@ensam.eu
ABSTRACT.For basic observations or for industrial applications it is of interest to use flat specimens at very
high frequency in the gigacycle regime. In this work, thin flat sheet, with 1.2 mm thickness of a complex phase ferrite-martensitic steels were considered for carrying out fatigue tests at high frequency (20 kHz) up to the gigacycle regime (>109 cycles). The crack initiation tests were carried out with water cooling, while the crack growth test were carried out in laboratory air at room temperature. All the tests were carried out under loading ratio R=-1. To do that, special designs of specimens were made and computed using FEM for defining the stress amplitude for endurance tests. Special attachments for specimens to the ultrasonic system’s horn were enhanced. A particular FEM computing of the stress intensity range on crack growth specimens was carried out for determining the specimen dimensions and an equation that defines the stress intensity range as a function of the harmonic displacement amplitude, dynamic Young’s modulus, material density and crack length. Detailed procedures and fatigue results are presented in this paper.
KEYWORDS. Ultrasonic fatigue; Plate steel fatigue; Fatigue resistance; Fatigue crack growth.
INTRODUCTION
atigue in high and very high cycle regime has been studied by Bathias et al. [1] during the last 30 years. Advances in piezoelectric fatigue testing machines have allowed researchers to carry out accelerated fatigue tests in the very high cycle fatigue (VHCF) regime [2] by using adapted specimens and testing methods for obtaining suitable results at high frequency. Actually, such machines, specimens and methods have been optimized and practically standardized by means of cylindrical specimens (dog bone, hourglass) for endurance tests and block notched specimens for crack growth tests. It is even possible to tests such specimens under controlled environment or temperature [3, 4]. As actually known, the vibration system on a piezoelectric fatigue machine is composed by a generator, a converter, an amplifier (horn), and the specimen, all working in resonance allowing the application of maximum stress amplitude in the smallest cross section of the specimen located at its central part. If the raw material or the component to study is sufficiently plenty for machining cylindrical round specimens the work becomes simple. It is the same for thick hyperbolic profile crack growth specimens [4]. Conversely, for thin raw material, such as steel sheets, fatigue specimens are not common and easy to test at high frequency; there is not a lot of VHCF data in literature. In this work, thin flat sheets of a
M. Ouarabi et alii, Frattura ed Integrità Strutturale, 36 (2016) 112-118; DOI: 10.3221/IGF-ESIS.36.11
113 complex phase ferritic-martensitic steel of 1.2 mm thickness were received for carrying out endurance tests in the very high cycle regime and crack growth tests at ultrasonic frequency (20 kHz). The method for designing the thin specimens and both the procedures for testing them at high frequency and the results are presented hereafter.
MATERIAL AND TESTING METHODS
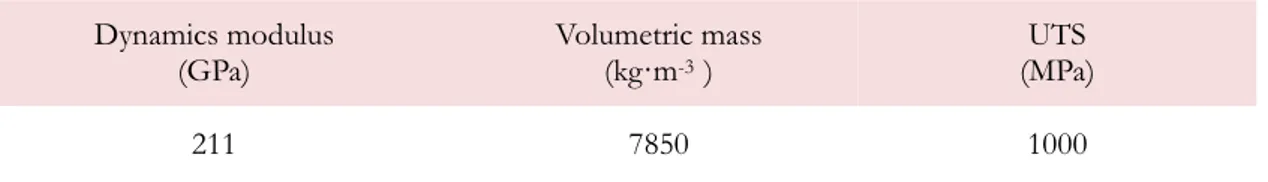
he investigated material is a complex phase ferritic-martensitic steel produced in sheet form by rolling and used for manufacturing automotive parts. The chemical composition this material is given in Tab. 1, its mechanical characteristics are in Tab. 2. These steel sheets are covered by zinc coated (Fig. 1b). The specimens were machined without removing this coating and with their longitudinal axis parallel to the rolling direction. The specimens were tested at ultrasonic loading frequency (20 kHz) with a loading ratio R= –1. All the specimens were tested as received condition.
C Mn Si P
0.1674 2.004 0.225 0.017 Table 1: Chemical composition of the ferritic-martensitic CP1000 steel (w %).
Dynamics modulus
(GPa) Volumetric mass (kg·m-3 )
UTS (MPa)
211 7850 1000
Table 2: Mechanical characteristics of the ferritic-martensitic CP1000 steel.
Figure 1: a) Microstructure of the studied steel CP1000. b) Galvanized coat.
The ultrasonic fatigue testing machine is composed of the following components. An ultrasonic generator transforms the electrical signal of 50 (or 60) Hz to 20 kHz. The piezoelectric converter transforms the 20 kHz electrical signal in a mechanical vibration at 20 kHz. A horn amplifies the displacement amplitude in order to obtain the required strain amplitude in the middle section of the specimen and a computer control system is used to control the different parameters of the test, such as the amplitude and to maintain the resonance frequency. Indeed, the specimen works in resonance vibration state and its center is a displacement node experiencing the maximum stress amplitude. For the calibration of the test, an optical fiber displacement sensor was used. If the resonance frequency drops outside the 19.5 – 20.5 kHz range, the system shuts down automatically. This is characteristic of crack initiation or specimen failure.
Two different types of tests were carried out in this work. The first one is for determining the fatigue strength and the second one is crack growth test. The geometry of the flat specimen for the fatigue strength assessment is illustrated in Fig. 2a. The geometry for the crack propagation test is illustrated in Fig. 2b.
M. Ouarabi et alii, Frattura ed Integrità Strutturale, 36 (2016) 112-118; DOI: 10.3221/IGF-ESIS.36.11
114
Figure 2: a) Geometry of smooth flat specimen for fatigue strength assessment [5], b) Geometry of flat specimen for crack propagation tests [6].
For keeping the temperature constant and close to room temperature during the test a cooling system with compressed air was used for crack propagation tests. For the crack initiation tests (S-N curve) the specimen self-heating was too high. Indeed the stabilized temperature was more than 350°C with such air cooling device. The temperature increase was measured with a FLIR infrared camera on mat black paint specimens. This self-heating has been first attributed to zinc coated. Experiments have been carried out on specimens without zinc coated but temperature heating was the same. Transformation of residual austenite in martensite due to high strain rate was another assumption for explaining this phenomenon but residual austenite content is less than 1% in CP1000 steel, consequently the reason of so intense self-heating is still an open question. Consequently a water cooling system has been developed (like in [3, 4]) to keep the specimen temperature lower than 60°C. In such case the temperature cannot be measured with infrared camera because of water but with thermocouple.
Figure 3: Material element with length (dx) in mechanical vibration along x direction.
CALCULATION OF THE SPECIMEN GEOMETRY
For crack initiation test
or working at a resonance frequency of 20 kHz, the specimen geometry and the horn should be calculated. For an element (dx) in longitudinal vibration along x direction as illustrated in Fig. 3, if a one dimensional vibration is considered the force balance according to Newton’s law is:
f mx
(1) It can be written: 2 2 ( , ) U x t dS dx S dx S x dx S t (2)where, U(x, t) is the axial displacement at position x and time t, (x, t) is the normal stress, S(x) is the cross section area at position x and is the density of material.
M. Ouarabi et alii, Frattura ed Integrità Strutturale, 36 (2016) 112-118; DOI: 10.3221/IGF-ESIS.36.11
115 If we assume that, the material is isotropic with a linear elastic behavior, the following equation is obtained where Edis the dynamic modulus. 2 2 2 2 ( , ) 1 ( , ) ( , ) 0 d U x t U x t dS U x t x S x dx E t (3)
The sinusoidal displacement can be expressed as follow: ( , ) ( )i t
U x t U x e (4)
Finally, the equation for the displacement vibration along the specimen is:
2 ''( ) ( ) '( ) ( ) 0 U x P x U x k U x (5) where: k ,c Ed and 2 f c
The geometry of the specimens is designed with a reduced cross section to obtain the maximum stress amplitude in the middle section (Fig. 2a) or/and to obtained the maximum stress intensity factor as shown in Fig. 2b.
For having a resonance frequency of 20 kHz, we must calculate the resonance length L1. There are two ways for doing that. The first one is to use the analytic solution of the previous equation.
*
1 2 1 1 arctan (coth( ) ) L L k k (6) * 2 1 max 0 2 cos( ) sinh( ) L d kL e E U L (7) where: * 1 2 2 1 ln 2 T L T (8)The second way is to use the numerical solution computed by Finite Element Analysis (FEA). Ansys software was used in this study. First, the specimen geometry was computed with the analytic solution. Then the resonance frequency was computed by modal analysis. Finally, with an imposed sinusoidal displacement with and amplitude of 1 µm, the stress amplitude in the middle of the specimen was computed by harmonic analysis. The difference between, the numerical and analytical solution was less than 1 %.
Crack propagation test
The method for calculating the mode I stress intensity factor range is reported in several documents, so that [3, 6]. Usually the Paris’ law is used to determine a crack growth curve, and then it is needed to relate the stress intensity factor range (K) with the crack growth rate
da dN/
. Wu [6] has shown that Eq. 9 can be used for calculating K during ultrasonic fatigue test since such test is carried out under displacement control. In this equation Ed is the dynamic modulus and is the Poisson ratio of the material, U0 is the displacement amplitude, a is the crack length, w is the specimen width andf(a/w) is a shape function depending on the specimen geometry. Wu has determined this function for hyperbolic profile
crack growth specimen with a thickness of 8 mm (Eq. 10).
0 2 ( ) (1 ) d E a K U f a w (9)
M. Ouarabi et alii, Frattura ed Integrità Strutturale, 36 (2016) 112-118; DOI: 10.3221/IGF-ESIS.36.11 116 where: 2 3 4 ( ) 0.64( ) 1.73( )a a a 3.98( )a 1.96( )a f w w w w w (10)
In the present work a similar methodology has been followed considering that physically a flat specimen will vibrate in resonance at 20 kHz. The main idea is to find the shape function for a flat specimen with a thickness of 1.2 mm. The proposed method consists in modeling a plane 2D geometry by using FEM software. Considering the specimen small thickness and the problem symmetry, only half of the specimen geometry was modeled assuming plane stress condition, and a singular element (Barsum element) was placed at different lengths representing the crack tip (as shown in Fig. 4a). Numerical value of K was obtained by FEA. For this problem, we use this equation defined in plane stress:
0 ( ) d a K E U g a w (11) 2 3 4 ( ) 0.2363( ) 1.0600( )a a a 1.7067( )a 1.4397( )a g w w w w w (12)
The resulting mode I stress intensity factor range as a function of the ratio between crack length, a, and the width of the specimen, w, is plotted in Fig. 4b. The obtained values are for an amplitude displacement U0 of 1 µm. Note that since crack opening cannot be measured in real time at 20 kHz the range of the effective stress intensity factor has been computed by considering the positive part of the loading cycle only. The crack is assumed to be closed during the compression part of the loading cycle. Of course, with this procedure the range of the effective stress intensity factor is a little bit overestimated, but according to the authors, up to now this is only way to assess it at 20 kHz [4].
Figure 4: Modeling of a crack in a flat specimen of 1.2 mm thickness, a) field of the mode I stress intensity factor, b) Stress intensity factor range as a function of (a/w) for a flat specimen.
RESULTS
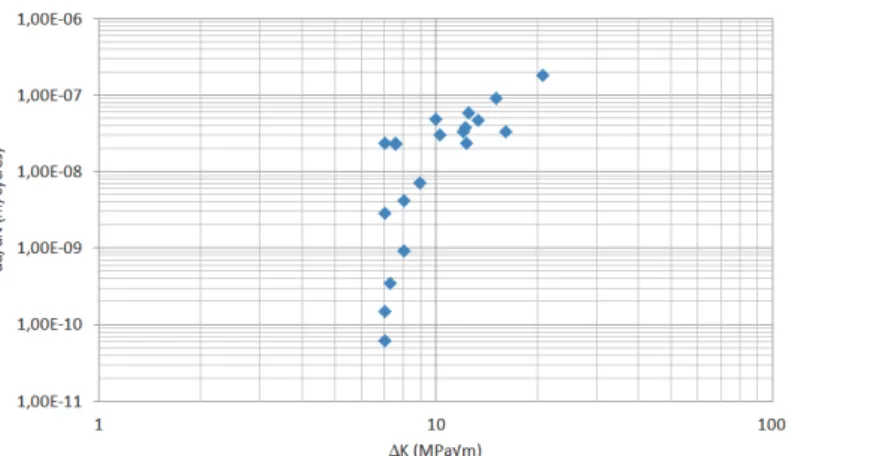
he S-N curve of the studied steel has been obtained on specimens with zinc coated, at room temperature, with water-cooling, under fully reversed tension-compression (Fig. 5). A large scatter in fatigue life can be observed. The blue points show the specimens that break during the test, while the red ones represent the specimens that did not break at 109 cycles. The fatigue strength at one thousand millions of cycles can be observed around 352 MPa. On the other hand, the experiments on crack growth flat specimens of 1.2 mm thickness demonstrated that such thin samples can be tested at high frequencies (20 kHz). In Fig. 8, the results of crack propagation test show that the threshold value of the stress intensity range is around 7 MPa√m for the CP1000 steel. This is in agreement with literature for steel [1].
SEM observations of the fracture surfaces of crack initiation specimens show that crack initiated either at the surface on rolling defect, Fig. 6 ( a and b), or on corner defect, Fig. 7( a and b).
M. Ouarabi et alii, Frattura ed Integrità Strutturale, 36 (2016) 112-118; DOI: 10.3221/IGF-ESIS.36.11
117 Figure 5: SN curve on smooth flat specimens in CP1000 (1.2 mm thickness) under tension-compression R = -1at 20 kHz, with water cooling at room temperature.
Figure 6: a) surface crack initiation on rolling defect (Samp = 360 MPa and Nf = 1.6×10⁸ cycles), b) crack initiation on rolling defect
(Samp = 360 MPa and Nf = 7.6×10⁶ cycles).
Figure 7: a) crack initiation at a corner defect (Samp = 360 MPa and Nf = 1.6×10⁸ cycles), b) crack initiation at a corner defect (Samp
M. Ouarabi et alii, Frattura ed Integrità Strutturale, 36 (2016) 112-118; DOI: 10.3221/IGF-ESIS.36.11
118
Figure 8: Experimental dadN f(Keff) curve in mode I under R=-1, for CP1000 (at 20 kHz) with air cooling and at room temperature.
CONCLUSION
n this work, the procedures for testing thin steel sheets in fatigue against crack initiation and crack propagation have been developed. Flat specimens of 1.2 mm thickness were used. It has been shown that it is possible to obtain appropriate results by using high frequency resonant fatigue testing machine in tension-compression. Fatigue endurance tests have shown fatigue strength in the gigacycle regime for CP1000 ferritic-martensitic steel around 352 MPa under fully reversed tension. For the crack propagation test on CP1000, the threshold value of the mode one effective stress intensity factor range is around 7 MPa√m in laboratory air. The proposed computing methodology is consistent since frequencies for each specimen geometry are practically the same in experimentation. Flat specimens must be perfectly designed to avoid any problem with bending deviation of the stress amplitude or stress intensity factor.
ACKNOWLEDGEMENTS
he authors thank the European Commission for the financial support of the FREQTIGUE (CECA) project and all the partners of this project: ARCELOR MITTAL, FIAT, GERDAU, Karlstadt University, Karlsruhe Institute of Technology, Aachen University, University Paris Ouest Nanterre La Defense.
REFERENCES
[1] Bathias, C., Paris, C., Gigacycle fatigue in mechanical practice, Marcel Dekker, New York, (2005)
[2] Bathias, C., Piezoelectric fatigue testing machines and devices, International Journal of Fatigue, 28 (2006) 1438-1445. [3] Palin-Luc, T., Perez Mora, R., Bathias, C., Dominguez, G., Paris, P.C., Arana, J., Fatigue crack initiation and growth
on a steel in the very high cycle regime with sea water corrosion, Engineering Fracture Mechanics, 77-11 (2010) 1953-1962.
[4] Perez-Mora R., Palin-Luc T., Bathias C., Paris, P.C., Very high cycle fatigue of high strength steel under sea water corrosion: a strong corrosion and mechanical damage coupling, Int. J. Fatigue, 74 (2015) 156-165.
[5] Wang, C., Microplasticité et dissipation en fatigue à très grand nombre de cycles du fer et de l’acier, PhD Thesis Université Paris Ouest Nanterre – La Défense, (2013).
[6] Wu, T.Y., Modelisation de la fissuration en fatigue vibratoire à haute temperature; applications aux alliages à base de nickel, PhD Thesis Ecole Centrale de Paris, (1992).
![Figure 2: a) Geometry of smooth flat specimen for fatigue strength assessment [5], b) Geometry of flat specimen for crack propagation tests [6]](https://thumb-eu.123doks.com/thumbv2/123doknet/7374035.214950/4.892.115.809.118.316/figure-geometry-specimen-strength-assessment-geometry-specimen-propagation.webp)