The full version can be obtained at: 1
http://www.springerlink.com/openurl.asp?genre=article&id=doi:10.1007/s
200216-009-2869-7
3 4Title: Quantitative methods for food allergens, a review.
5 6
Authors: Stéphanie Kirsch1*, Séverine Fourdrilis1*, Rowan Dobson1, Marie-Louise 7
Scippo2, Guy Maghuin Rogister2, Edwin De Pauw1, 8
9
Affiliation: 1 University of Liège, Mass spectrometry laboratory CART/GIGA-R, 10
2Laboratoire d’Analyse des denrées alimentaires, University of Liege, 4000-Liege 11
Belgium 12
13
* The two authors equally contributed to the paper 14
15
Abstract:
16
The quantitative detection of allergens in the food chain is a strategic health objective 17
as allergy continues to rise. Food allergenicity is caused by proteins either in their 18
native form or in forms resulting from food processing. The progress in mass 19
spectrometry widely opened the field of proteomics. These advances are now 20
available for the detection and the quantification of traces of allergenic proteins in 21
complex mixtures, and complete the set of biological tests used until now, such as 22
ELISA or PCR. The paper will review both families of methods and underline major 23
advances in the mass spectrometric methods. 24
25
Keywords: absolute quantification, allergenic protein, cross contamination, ELISA,
26
isotopically labelled peptide, Label free, mass spectrometry, PCR, tagging. 27
28
Abbreviations used:
29
AQUA , heavy peptides: isotopically labelled peptides used as internal standards for 30
MS 31
BHR: Basophil histamine release 32
CID: Collision induced dissociation 33
DBPCFC: Double-blind placebocontrolled food challenge 34
DNA: Desoxyribonucleic acid 35
EAST: Enzyme-allergosorbent test 36
ELISA: Enzyme-linked immunosorbent assay 37
ICAT: Isotope Coded Affinity Tag 38
ICP-MS: Inductively coupled plasma-mass spectrometry 39
Ig: Immunoglobulin 40
ITRAQ: Isobaric tag for relative and absolute quantitation 41
LOD: Limit of detection 42
LOQ: Limit of quantification 43
MRM: Multiple reaction monitoring 44
MS/MS: tandem mass spectrometry 45
PCR: Polymerase chain reaction 46
PVDF: Polyvinylidene difluoride 47
RAST: Radio-allergosorbent test 48
RIE: Rocket immuno-electrophoresis 49
SILAC: Stable isotope labeling with amino acids in cell culture 50
Introduction
51 52
The prevalence of food allergy continues to rise, especially in industrialised countries 53
where 2% of the adult population and 5-8% of children are affected [1, 2]. Cows’ milk 54
and egg allergies predominate among young children in Europe and in the United 55
States (2,5-3%), whereas the major food allergens come from Rosaceae fruits for 56
European adults (0,5%) or from shellfish for American adults (2%) [3, 4, 5, 6]. Despite 57
the importance of food allergies, considered to be the 4th most important public health 58
problem by the World Health Organisation, allergy sufferers have no other possibility 59
of effective treatment than the total avoidance of allergen-containing food [7]. But 60
avoidance is difficult when allergens are ubiquitous food proteins such as egg or milk 61
proteins. In 2003, the European legislation (Directive 2003/89/EC amending Directive 62
2000/13/EC) established a list of ingredients with potential adverse (allergenic) 63
effects. These ingredients have to be indicated on the label of food products by food 64
producers. This obligation allows the allergic consumers to be warned of the 65
presence of allergens in foodstuffs [7, 8]. Since 2007, 14 substances are to be 66
mentioned on the label if they are present in a food product [9]. The risk of cross-67
contamination of food products is however still present. Indeed, allergens can be 68
transferred to food that is not supposed to contain allergens, during production 69
(unsuitable cleaning procedures of equipment), storage, shipment or preparation of 70
meals in restaurants. The available detection and quantification methods for food 71
allergens do not allow certifying the absence of cross-contamination. Therefore, food 72
producers use very often a so called “precaution labelling” by mentioning on 73
packaging « may contain traces of… » or « produced in a factory handling… ». 74
There is an urgent need to improve the robustness of the available analytical 75
methods and to develop new standardized methods, in order to provide an 76
appropriate tool for food and catering industries, and « allergen-free » foodstuffs for 77
allergic consumers. The new or improved tests must be fast, more sensitive (lower 78
LOD), more accurate (better LOQ), and more specific for a better reliability to 79
discriminate close sequences of allergenic proteins. They should ideally allow 80
unambiguous identification of the allergens 81
Monaci et al. [10] have described all the aspects of separation and MS-based 82
methods that allow identification and characterization of allergenic food proteins in a 83
recent review. Our review goes beyond the scope of that review and gives a status 84
report of the current methods of quantification of allergens in food products, 85
especially methods using proteomics and mass spectrometry.. The present review is 86
concerned with classical methods in the first part, with only a brief description of the 87
available detection methods for allergens in food because the paper of Poms et al. 88
[10] reviews in detail all these methods with their advantages and drawbacks, and 89
with mass spectrometry based methods in the second part. By classical methods, we 90
mean indirect methods measuring allergen coding genes (PCR), antibody/antigen 91
complexes (ELISA), or mediators released by cells (BAT). Mass spectrometric 92
methods allow to both identify and quantify allergens in food independently of the 93
individual sensitivity of each allergic consumer or independently of the use of serum. 94
95
1. Classical methods for food allergens detection and quantification
96 97
Food allergy is an adverse immune response to an exposition to food allergens 98
through the oral route. The allergic reaction is commonly mediated by key molecules, 99
the allergen-specific immunoglobulins E (IgE), but it also exists a non IgE-mediated 100
mechanism. IgE have the capacity to bind specifically to antigens, to high-affinity 101
FcЄR1 receptors residing on mast cells, basophils and denditric cells or to low-affinity 102
receptors FcЄR2 and CD23 expressed on monocytes and lymphocytes. In IgE-103
mediated allergy, the crosslinking by an allergen to a receptor-bound IgE triggers an 104
immediate response characterized by the release of various potent cell derived 105
mediators such as histamine, N-acetylhexoaminidase, proteases, leukotrienes or 106
proinflammatory cytokines. A late-phase response follows in few hours, involving 107
eosinophils and T lymphocytes secreting cytokines and interleukines that regulate 108
IgE synthesis and are responsible for the inflammatory response [10, 11, 12, 13]. 109
The diagnosis of food allergy of patients is based on several indirect detection tools 110
using blood serum properties. The blood of allergic patients contains IgE antibodies 111
that specifically recognize and bind to the antigen (allergen), and white blood cells 112
that express active receptors and release mediators when the allergen is present. 113
Therefore, most of the diagnosis tools are based on the immunochemical detection of 114
IgE, receptors or mediators. On the other hand, to prevent contamination of the food 115
chain by allergens, detection methods of allergens in foodstuffs have been 116
developed. The challenge today is the detection and the quantification of trace 117
amounts of allergens in miscellaneous food matrices, which are able to provoke an 118
allergic reaction more or less severe according to the allergen and to the individual. 119
The quantification of allergens in food firstly aims to guarantee with a high confidence 120
level the absence of allergens in food for the allergic consumer. In parallel, the 121
quantitative data obtained on patient serum can bring useful information about the 122
allergenic potential of the food sample and the potential allergic reaction of the 123
patient induced by ingestion of the analyzed foodstuff. In principle, the 124
immunochemical methods used for diagnosis could be applied to the detection and 125
quantification of hidden allergens in food. However, among the range of available 126
methods for that purpose, only ELISA and PCR based tests are currently convenient 127
for routine screening and semi-quantification in catering and food industry, whereas 128
certain others methods are nowadays applicable in research field only. 129
130
1.1 Methods for large-scale food allergen quantification in catering and food industry 131
132
1.1.1 ELISA, ELISA-ICP-MS 133
Among available immunochemical methods, we can quote first the most commonly 134
used method in laboratories to detect hidden allergens in food, the Enzyme-linked 135
Immunosorbent Assay (ELISA). In an ELISA designed to screen allergenic proteins in 136
food, antibodies mainly come from serum of an immunised animal serum. This serum 137
contains immunoglobulins G able to bind to the allergen used to immunise the 138
animal. Whereas in tests used for clinical diagnostic, the properties of IgE present in 139
human serum are used. The food extract is analysed in microplate wells. The 140
quantification rests on the measure of the enzymatic activity of a second protein-141
specific antibody (anti-IgG, e.g. a rabbit anti-human antibody) coupled to an enzyme. 142
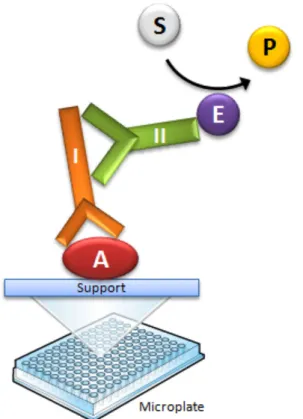
This 2nd antibody binds to the allergen-primary antibody complex (Fig. 1).The 143
quantification can also rest on the measure of the primary antibody wearing the 144
enzyme label if any secondary antibody is used as it is the case in the direct ELISA. 145
A reaction with the enzyme substrate produces a coloured product whose absorption 146
is proportional (direct, indirect and sandwich ELISA) or inversely proportional 147
(competitive ELISA) to the quantity of allergen in food sample. A multi-allergen 148
immunoassay built starting from the ELISA model has been developed and allowed 149
the simultaneous determination of at least 1 µg/g protein of each peanut and tree 150
nuts allergens in chocolate, but a limit of quantification has not been established yet 151
[14]. ELISA has recently been combined to Inductively coupled plasma-mass 152
spectrometry (ICP-MS) in order to increase the sensitivity and the precision of the 153
detection of a simple ELISA [15]. In ELISA-ICP-MS the secondary antibody is 154
labelled with a stable isotope instead of an enzyme, which can be used for 155
quantification with a mass spectrometer. Down to 2 µg of peanut allergens per gram 156
of cereal-based matrix have been detected [15]. 157
158
159
Fig. 1 Generalized ELISA scheme for detecting a target antigen (A = target antigen, I = Primary
160
antibody, II = secondary antibody, E = enzyme linked to the secondary antibody, S = colorless
161
substrate, P = colored product).
162 163
1.1.2 PCR, RT-PCR, PCR-ELISA 164
The Polymerase chain reaction (PCR), a tool based on nucleic acids, has been 165
developed for the indirect analysis of allergenic ingredients in food. It consists in 166
targeting a segment of the gene coding for the allergenic protein of interest and 167
amplifying only this DNA fragment to make them detectable. This tool is highly 168
specific and sensitive, showing a LOD <10 mg/kg for almond, hazelnut, soy, milk or 169
peanut [16]. PCR is also available as Polymerase chain reaction coupled to ELISA 170
(PCR-ELISA) and Real-Time Polymerase chain reaction (RT-PCR). In PCR-ELISA, 171
the detection is gel-free since the amplified DNA fragments are hybridized to a 172
protein probe and detected by ELISA. In RT-PCR, the detection is gel-free and 173
performed in real-time, amplification of the PCR product results in the emission of 174
fluorescence proportionally to the amount of the gene of interest in food sample. 175
There is the possibility to perform quantification using a unique internal standard to 176
compensate for the variability in DNA extraction and amplification efficiencies [17]. 177
178
1.2 Methods for small-scale food allergen quantification in the research field 179
180
1.2.1 Other immunoglobulin-based tests 181
Three other immunochemical tests, the Enzyme-allergosorbent test (EAST), the 182
Radio-allergosorbent test (RAST), and the Dot immunoblotting, function with a 183
principle similar to ELISA. The food extract is analysed in microplate wells (RAST, 184
EAST) or spotted on a PVDF, nitrocellulose or polyester cloth membrane (Dot blot). 185
In case of RAST, the secondary antibody is labelled with a radioactive isotope 186
instead of an enzyme, and the quantification is performed with a gamma counter 187
(RAST). In case of EAST and Dot blot, the absorption of the coloured product is 188
proportional (Dot blot) or inversely proportional (EAST) to the quantity of allergen in 189
food sample. At last, RAST and EAST inhibition tests have been applied for the 190
quantitative analysis of hazelnut in food products and milk in baby-food cereal flour 191
with a LOD of 1 µg/g but no LOQ has been determined [18, 19]. A multiplex enzyme 192
immunoassay system consisting in a reverse dot blot has also been developed for 193
the multiple detection of allergens and shows a LOD of 0.1 µg/g for peanut allergens 194
in various food, and for hazelnut and Brazil nut allergens in chocolate ice cream [20]. 195
Two other immunochemical methods exist. Instead of binding allergens with 196
antibodies in a complex matrix sample, the food proteins including allergens are 197
beforehand separated on a 1D gel or 2D sodium dodecyl sulphate polyacrylamide gel 198
electrophoresis (SDS-PAGE) according to their molecular weight (1D gel), or to their 199
molecular weight and isoelectric point (2D gel). The immunoblotting is then 200
performed on separated proteins. In the SDS-PAGE immunoblotting, proteins are 201
transferred to a nitrocellulose of PVDF membrane and protein-specific radio- or 202
enzyme-labelled antibodies are added after the blotting. Detected allergens appear 203
like protein bands on 1D gel or like individualised spots on 2D gel. In the Rocket 204
immuno-electrophoresis (RIE), antibodies are beforehand incorporated in the gel, so 205
the antigen-antibody complexes precipitation occurs from the beginning of the 206
migration. Detected allergens appear in the form of a rocket shape. A 1D SDS-PAGE 207
immunoblot technique using rabbit antisera and chemiluminescent detection has 208
been developed for routine screening of low levels of potentially allergenic hazelnut 209
and almond proteins in chocolate and allows the detection of less than 0.5 µg/g of 210
chocolate [21]. However, gel-procedures are time-consuming and not well fit for the 211
purpose of routine analysis. 212
213
1.2.2 Cell-based methods 214
Among others immunochemical methods, the Basophil histamine release assay 215
(BHR) and the β-hexosaminidase release assay are based on the quantification of 216
two mediators released by blood cells from allergic patients named basophils and 217
mast cells respectively following the allergen binding to the cell receptors. The 218
quantity of histamine or β-hexosaminidase is proportional to the concentration of the 219
specific allergen. Several kinds of in vitro mediator release assays have been used to 220
test the allergenicity of soybean allergens [22, 23] or to control the standardization of 221
allergen extracts from different manufacturers [24], and show a high sensitivity and 222
reproducibility. The Basophil activation test (BAT), also called flow-cytometric 223
allergen stimulation test (FAST), targets mediators released (e.g., histamine, 224
leukotriene C4, interleukin IL-4 and IL-13) and surface receptors (e.g., CD63, 225
CD203c) appearing on activated basophils coming from allergic patients after 226
allergen exposure. The quantification is performed thanks to dye-labelled antibodies, 227
which bind to active receptors and are detected by flow cytometry [25, 26, 27]. The 228
quantification of the allergen of interest rests on the measured fluorescence. The 229
BAT has been shown to have a better sensitivity and specificity than BHR tests in 230
food allergy diagnosis [28, 29]. Roasted and native hazelnut extracts have been 231
analyzed by BAT in order to prove the reduction of allergenicity after processing of 232
hazelnut ; 8.2 µg/mL of roasted extract are needed to induce 50% of basophils 233
activation against 0.15 µg/mL for non processed extract [30]. Others authors are also 234
developing an in vitro BAT to quantify trace amounts of hazelnut and soy allergens in 235
food in the framework of the ALLERRISK project and results are obtained with a high 236
analytical sensitivity (Ebo et al., work in progress, personal communication). 237
238
1.3 Limitations of immunochemical methods and nucleic acids based methods 239
The similarity between all the immunochemical methods is the use of biological sera 240
and the fact that the detection is based on the antigen-antibody recognition. Thus, 241
the quantification depends on the quality of this recognition and might be distorted by 242
several things but mainly by the Ig specificity. The epitope of the allergen involved in 243
the Ig-binding is either linear, or conformational. The linear epitope, also called 244
sequential, is a continuous string of aminoacids and the recognition is specific to the 245
aminoacid sequence (primary structure). The conformational epitope can be a 246
continuous or discontinuous string of aminoacids and the recognition depends on the 247
three-dimensional shape of the protein (tertiary structure). As antibodies do not 248
recognize the whole molecule but only epitopes, the specificity of an antibody 249
depends on the uniqueness of the epitope. A lack of specificity leads to false 250
positives and negatives due to cross-reaction between closely related proteins. 251
Moreover, the natural presence of IgG is susceptible to compete with IgE for the 252
binding to the same allergen [31]. On the other hand, the variability of human or 253
animal sera means a variability of IgE and IgG between individuals which limits the 254
validity of results for others patients. 255
In case of cell-based tests, in vitro activated-basophils also suffer from the use of 256
human or animal cells that implies a broad variability in basophil activity between the 257
different basophil donors and an extremely heterogeneous response between 258
individuals [32]. Moreover, basophils in vitro activation relies upon the use of natural 259
allergen extracts which might be heterogeneous with varying composition [27]. 260
Despite these pitfalls, BAT offers potentials and perspectives in quantifying allergens 261
in food and in assessing the allergenic potency of a food extract. However it is 262
important to keep in mind that a large scale application of BAT could be limited due 263
to the need of a sizeable quantity of human cells. It is not possible today to collect 264
and store cells enough in order to constitute a collection representative of a 265
population of allergic patients. BAT should be used in complement of classical 266
immunochemical tests such as ELISA and PCR. 267
PCR and RT-PCR methods are not based on the use of serum or cells but the 268
quantification remains indirect and semi-quantitative like immunochemical methods. 269
The presence of the target in food, a DNA fragment corresponding to the gene of a 270
protein (the allergenic protein or a protein specific to the source species), does not 271
necessarily prove the presence of the allergen itself but indicates the source species 272
in case of contamination. PCR methods are suitable to know the origin (taxonomy) of 273
the contaminating species. 274
Two additional phenomena are the adsorption of allergens on solid matrices such as 275
cellulose or nitrocellulose, and the food processing, which may destroy epitopes by 276
altering their three-dimensional structure or modifying their accessibility [24]. In case 277
of PCR, food processing and biological variability differently affect a nucleic acid than 278
a protein marker. 279
In summary, despite the great diversity of Ig-, cell- and DNA-based methods, the 280
quantification is indirect because it does not target the food allergen itself. 281
282
1.4 Threshold issue and perspectives in routine analysis 283
A pivotal issue in food allergen quantification is the impossibility to define a useful 284
threshold (a limit below which a stimulus causes no reaction) and valuable limits of 285
quantification. The sensitivity of a patient to a given allergen varies from a patient to 286
another and over the years. Accordingly, it is difficult to define threshold doses for 287
allergenic foods. Some authors tried to established threshold values for some 288
ingredients, using published data from low-dose challenges from the clinical literature 289
and assessing them statistically [33]. Defined threshold values that would protect 290
99% of allergic individuals were 8.6 mg (milk), 3.4 mg (egg), 1.2 mg (peanut) and 2.2 291
mg (soybean). However, this approach is complicated by the uncertainties associated 292
with failure to identify a NOAEL in most existing observations, the effects of 293
differences in the protocols, and other factors. Moreover, no international agreement 294
has been reached on an acceptable level of risk for allergic individuals. Thus, a 295
consensus protocol based on low-dose DBPCFC has been proposed in order to 296
standardize data that would improve these estimates above [34, 35]. For the 297
moment, without well-defined thresholds, the quantification methods must be as 298
sensitive, accurate and reliable as possible. This demand level can be achieved by 299
targeting directly the allergen rather than a marker of the presence of the allergen. 300
Although the colorimetric-based enzyme-linked immuno-sorbent assay (ELISA) is 301
presently used as the official screening method of food samples for allergen 302
detection, several problems such as selectivity, accuracy and cross-reactivity lead to 303
severe limitations in the applicability of this screening technique. The robustness of 304
the commercially available immunochemical methods must be improved to cope with 305
the problem of the high variability among allergens, and to guarantee safe food for 306
the consumer. Immunochemical methods applied today in the research field might be 307
applied in the future for routine analysis. Current ELISA and PCR screening methods 308
should be confirmed by more reliable methods of molecular identification and 309
quantification of allergens. Such confirmatory methods have necessarily to be based 310
on mass spectrometry. 311
2: Mass spectrometric methods for quantification of food allergens
312 313
Mass spectrometry has long been used for the study of proteins. The first 314
experiments were designed for their identification and are now routinely used in high 315
throughput proteomics. Hyphenated methods coupling separation techniques and 316
mass spectrometry allow to identify and quantify allergens on a direct and absolute 317
way. The development of such quantification methods for food allergens in trace 318
amounts will improve the safety of the food chain. Food products could be certified 319
« allergen-free » and be consumed in total safety. The quantification is independent 320
of the allergic sensitivity of patients. Finally, for protein allergens, mass spectrometric 321
methods can be performed at the peptide scale making the quantification 322
independent of the three-dimensional structure of the allergen and the marker 323
peptide chosen can still be valuable after food processing. 324
Simultaneous quantification and identification rapidly appeared to be a priority issue. 325
In the last few years, routine analytical methods used for small molecules were 326
adapted for protein quantification. These methods are based on the principle of 327
external or better, internal standards (IS), consisting in the comparison of mass 328
spectrometry signal intensities of the analytes to those of references. The standard 329
should have similar physicochemical properties to those of the analyte. With external 330
calibration, the standard can be the analyte itself, thus avoiding problems with 331
response factors. Nevertheless this advantage is minimal compared to the qualities 332
of the internal standard. The best internal standard is an isotopically labelled version 333
of the analyte, as it will have similar extraction recovery, chromatographic elution, 334
ionization ionisation response, and spectral similarity. In practice, the internal 335
standard is added in a constant known amount to samples (blank, analyte, calibration 336
standard). It can be used for calibration by plotting the ratios of signals for the analyte 337
and the internal standard as a function of the analyte concentration. Two approaches 338
of this global concept are available, the first one where the analyte and therefore the 339
standard, is the intact protein and the second one, where the analyte is a peptide 340
resulting from the protein digestion by proteolytic enzymes, such as trypsine. 341
Selection of the analyte is based on experiments like those described in the review of 342
Monaci et al. [10]. Methods proposed in their paper enable the characterization of the 343
proteins that will subsequently be quantified, taking into account, for example, the 344
presence of isoforms or protein modifications. 345
346
2.1 Quantification at the protein level 347
The analyte is the protein itself, so no modification of the protein during the 348
quantification process is involved. Spraying directly intact proteins from solutions 349
using electrospray yields MS spectra consisting in a series of peaks corresponding to 350
charge state distributions of the protein. This technique however presents strong 351
limitations. The identification of targeted proteins in complex mixtures is hindered by 352
two factors. The first one is the ion suppression that appears when different proteins 353
elute at the same time. The second is the superposition of numerous peaks in the 354
mass spectra, corresponding to different proteins that may not be resolved even 355
using deconvolution algorithms. 356
Unlike for serum where there is very large number of different proteins and where 357
there is a very large dynamic range of concentrations, food matrices are not too 358
complex allowing conducting different studies, all aiming to the quantification of 359
proteins. Milk allergy is one of the most known and is triggered by milk proteins. 360
There are two groups of milk proteins, made up of 80 % caseins, and 20 % whey 361
proteins. The latter includes α-lactalbumin (α-LA), β-lactoglobulins (β-LG A and B), 362
bovine serum albumin and immunoglobulins. Huber et al. did the first quantitative 363
experiments on all the whey proteins [36]. Selected ion monitoring was used to follow 364
the most abundant ions. An external calibration curve (0.01-1 mg/ml) allowed the 365
concentrations of the three proteins to be determined in a commercial whey drink. 366
The measured concentrations were 0.684, 1.839 and 1.599 mg/ml) for α-lactalbumin, 367
β-lactoglobulins B and A, respectively. Czerwenka et al introduces the concept of 368
internal standards for the quantification of the β-lactoglobulin in different cows’ milk 369
products [37]. After sample preparation (lipid removal and casein precipitation), 370
proteins were separated by liquid chromatography using a C8 column. The mass 371
spectrometer was in full scan mode in order to acquire the entire charge state 372
distributions of the proteins. Quantification was done after deconvolution. Two 373
internal standards, species variants of bovine β-LG, were used, one to determine the 374
recovery, the other for MS quantification. Calibration curves were constructed 375
(without matrix) and displayed good linearity over a range of 25-1000 µg/ml for 376
bovine β-LG and 12.5-500 µg/ml for caprine β-LG (IS for recovery) proteins. A good 377
correlation was found between bovine β-LG concentration in the analyzed whole milk 378
(3.25 ± 0.15 g/l) and previous literature reports. Recovery rates ranged from 107.2% 379
for whole milk to just 53.5% for processed milk products. The influence of processing 380
was investigated, showing an increasing loss of β-LG with increasing heat treatment. 381
Monaci et al. developed a method using solid-phase extraction to detect traces of 382
these three allergenic cows’ milk proteins in mixed-fruit juice samples [38]. Proteins 383
were separated by liquid chromatography using a C5 column. Two different 384
acquisition modes were used and compared: full scan and multiple ion monitoring 385
modes. For this last one, most abundant specific masses, corresponding to different 386
protonated states of the same protein, were recorded for each protein. This mode 387
allowed the selectivity of the method to be increased when more complex matrices 388
were analyzed. External standards were already used but this time with matrix-389
matched calibration curve. Their method was linear in a range of 5-40 µg/ml and the 390
limits of detection (LOD) and quantification (LOQ) were estimated at 1 and 4 µg/ml 391
respectively. 392
Although good results are obtained by this method, fragments or derived peptides 393
that may still have immunological activity are not included. The second approach 394
could solve this problem. 395
The classical DIGE technique can also be used. It allows multiple samples to be co-separated 396
and visualized on one single 2-D gel through the use of multiple fluorescent dyes to label 397
intact proteins prior to 2-D PAGE. Relative quantification can be performed followed by PMF 398
(peptide mass fingerprinting) and MS/MS are subsequently used to identify the proteins 399
extracted from the gel. Hobson et al. used DIGE to identify protein biomarkers of food 400
allergy in mice exposed to ovomucoid (OVM), a major food allergen found in chicken 401
egg white [44]. Alm et al. used DIGE to determine the proteomic variation within and 402
between different strawberry varieties, in order to breed a red strawberry with low 403
amount of allergen [45]. 404
405
2.2 Quantification at the peptide level 406
Quantification at the peptide level can be classified in methods involving stable 407
isotopes: tagging by light (12C) and heavy (13C labelled) tags and using isotopically 408
labelled synthetic peptide to achieve respectively relative or absolute quantification. 409
More recently the so-called label free quantitative method has been introduced based 410
on signal intensity. The final analyte is the peptide; therefore all of these methods 411
have to achieve a digestion step in order to obtain the peptides to be analyzed. In 412
addition, the sequence of the peptides must be determined to insure identification. 413
Tandem MS is mandatory. 414
2.2.1 Tagging methods 415
Many strategies have been developed during the last decade to label proteins or 416
peptides with stable isotopes. These methods are mainly used for relative 417
quantification purposes; however, most can also be used for absolute quantification 418
as well. All of these strategies incorporate isotopically labelled chemical moieties into 419
the samples. They are useful in order to find biomarkers, in order to detect changes 420
in protein abundances, for example, before and after the roasting of peanuts. They 421
can be classified into: metabolic labelling (SILAC); chemical labelling (ICAT, ICPL, 422
iTRAQ,…) and enzymatic labelling (H216O, H218O). Ong et al. introduced the SILAC 423
method in 2002 [39]. Two cell populations are generally studied. All the proteins in 424
each cell population are metabolically labelled with a light or heavy, non-radioactive 425
isotope form of an essential amino acid. For ICAT and ICPL, the tagging reaction 426
occurs on the protein level, whereas for iTRAQ, it is the peptides that are labelled. 427
These tags are specifically designed to react chemically with a particular amino acid: 428
cysteine residues in the case of the ICAT reagent [40] or the DIGE dyes, or lysines or 429
N-terminals in the case of iTRAQ and ICPL reagents [41]. iTRAQ was developed by 430
Darryl Pappin and colleagues at Applied Biosystems in 2004 [42]. With iTRAQ, four 431
(or eight) independent reagents of the same mass that, upon fragmentation in 432
MS/MS, give rise to four (or eight) unique reporter ions (m/z =114–117) that are 433
subsequently used to quantify the four (or eight) different samples, respectively. 434
Because this region is free of other common fragment ions, signals found in this 435
region are due only to contributions from the reporter ions from the corresponding 436
labelled sample digests. A patent has been deposed for the analysis of allergens 437
using this technique [43]. Most of these techniques result in the same peptides 438
labelled heavy or light. The same peptide act therefore as an internal standard. 439
Fensleau’s group developed an isotope coding approach that uses ‘normal’ water 440
(16O) as the solvent for proteolytic digestion of proteins from one cell state, and 441
‘heavy water’ (18O) as the solvent for proteolytic digestion of the proteins in the 442
second cell state. The use of heavy water results in the incorporation of two 18O 443
atoms in the C-terminal carboxy moiety of each proteolytic peptide, giving a 4 Da 444
isotope code [46]. 445
446
2.2.2 Isotopically labelled synthetic peptides method 447
When the identity of the protein to be quantified is known in advance, this is currently 448
the method of choice. This method uses a reference analyte, which is an isotopically 449
labelled peptide. This reference peptide incorporates 13C and 15N stable isotopes on 450
one of its amino acids leading to a known mass difference with the endogenous 451
peptide. There are three critical steps in the development of this method, each 452
leading to bad results if they are not well evaluated: the selection of the peptide, the 453
design of the mass spectrometry analysis and the digestion step. 454
The selection of the peptide is obviously a crucial point as this peptide will be the 455
analyte (endogenous or reference) that will be quantified. This peptide must be 456
unique to the protein of interest. If this is not the case, the protein of interest might be 457
overestimated, this can lead to false positives. The selected peptide must also be 458
efficiently liberated by digestion of the protein. This peptide must be stable in solution 459
during the whole process. Some amino acids should therefore be avoided like 460
methionine and cysteine that can be irregularly oxidized. At least the peptide must be 461
well analyzed by the system (liquid chromatography and especially mass 462
spectrometry). It must be what is called a proteotypic peptide. If these three 463
conditions are not fulfilled, the protein concentration would be underestimated and 464
this would give rise to false negative results. 465
Another major advantage lies in the choice of the reference peptide regarding the 466
issue of modifications induced by industrial processes. Roasting, boiling or different 467
kind of cooking may spoil the quaternary structures of the allergen and prevent 468
antibodies from recognizing conformational epitopes, leading to false negatives. In 469
the AQUA method, the reference peptide can be chosen to be both present in the 470
amino acid sequence of the native allergen and in the amino acid sequence of the 471
processed allergen. It allows to detect the two forms of the allergenic protein and to 472
quantify the entirety of traces of allergen in a processed foodstuff. 473
The design of the mass spectrometric analysis is also important. Different mass 474
spectrometers can be employed for such analyses but the most dedicated for this 475
kind of analysis is the triple quadrupole running in the multiple reactions monitoring 476
(MRM) mode. The first quadrupole only allows the precursor ions of a selected m/z 477
ratio to pass. These selected precursor ions are fragmented by CID in the second 478
quadrupole. The third quadrupole only transmits the fragmented ions of a selected 479
mass to charge ratio to the detector. This mode increases the selectivity of the 480
analysis. As this spectrometer is a low resolution mass analyzer, more than one 481
MRM transition is required to ensure the specificity of the signal. 482
The last critical point is the digestion step. With the traditional AQUA concept [47, 483
48], where the internal standard is the isotope labelled peptide, we deduced the 484
concentration of the protein from the measurement of the concentration of the 485
peptide. To ensure that the molar concentration of both is equal, the digestion must 486
be complete. It is well known that this is hard to accomplish. To circumvent this 487
problem, different strategies have been employed. Pratt et al. designed artificial 488
QConCat proteins that are concatemers of tryptic peptides for several proteins [49]. 489
Although by this way the internal standard undergoes the digestion step, in reality the 490
sequence is not exactly the same as that in the endogenous proteins. There are still 491
different cleavage kinetics due to the surrounding different amino acids. Another 492
concept has been used in our laboratory [50]. As the studied proteins (IGF-1 and 493
IGFBP-3) were commercially available, calibration curves were built based on 494
digestions carried out on samples of serum fortified with increasing concentrations of 495
the proteins of interest. The amount of standard added was low compared to the total 496
amount of proteins in the samples. Therefore completeness of the digestion should 497
be the same in the calibration standard as in unknown samples. Synthetic isotopically 498
labelled peptides were only used to correct the mass spectrometry signal. Brun et al. 499
developed the PSAQ concept, protein standard for absolute quantification [51]. The 500
internal standard is the labelled protein, enabling all the systematic variations due to 501
the sample sample process to be taken into account. 502
Many studies have used these different concepts with success. 503
In the field of food allergens, few developments of this method were investigated and 504
only for two types of allergens, casein and peanut proteins. 505
As previously said, casein is the most abundant milk protein. Weber et al. 506
investigated the applicability to detect this protein in cookies [52]. The mass 507
spectrometer was operated using data-directed analysis. Using the reconstructed ion 508
chromatograms of two peptides, it was possible to detect 1.25 ppm in the spiked 509
food. Comparisons with ELISA results were done on 27 samples (positive and 510
negative) and good agreements were obtained. 511
There are three major peanut proteins that cause allergic reactions, Ara h1, Ara h2 512
and Ara h3/4. As Ara h1 accounts for 20 % of the total proteins and is therefore the 513
major protein. It was the first that was studied by Shefcheck et al. In a preliminary 514
study, data-dependent MS/MS was used to determine specific Ara h1 peptides [53]. 515
Selected ion chromatograms of a product ion from MS/MS scan obtained from each 516
four peptides allowed the detection of Ara h1 in vanilla ice cream at a value of 10 517
ppm. The method was improved by using MRM [54]; three product ions were 518
monitored for each selected parent mass. The two targeted peptides were different 519
from those followed in the first experiment. Peptide selection was done based on the 520
signal intensity, retention time position, deficiency of missed cleavages and overlap 521
with immunologically active epitope. Optimisation of the sample preparation permitted 522
to reach a LOD of 2 ppm in dark chocolate. As the author said, the perspectives were 523
to develop an appropriate internal standard. The group of Chassaigne undertook a 524
big study to determine the best peptides that can serve as markers for the detection 525
of Ara h1, Ara h2 and Ara h3/4 [55]. Multiple ion monitoring was used and identity 526
was verified by MS/MS. Peptide selection included among others overlap with 527
epitopes and stability during the heat process of peanuts. Careri et al. introduces the 528
concept of internal standard for the quantification of Ara h2 and Ara h3/4 in chocolate 529
rice crispy-based snacks [56]. The main selection criterion of the peptides was the 530
presence in the different isoforms. Two peptides were selected for each protein. 531
Compared to the previous study of Shefcheck, only one peptide is in common. 532
Peptides for Ara h2 didn’t overlap immunologically active epitope. Multiple reaction 533
monitoring was achieved with one transition for each peptide, so 4 transitions in total. 534
LOD and LOQ were 5 and 14 µg protein g-1 matrix for Ara h2 and better results were 535
obtained for Ara h3/4 with the LOD and LOQ at 1 and 3.7 µg protein g-1 matrix, 536
respectively. The internal standard chosen for this study was leucine-enkephalin, a 537
five aminoacids peptide (YGGFL). As said by the authors, this internal standard did 538
not completely overcome the matrix suppression effect. In order to improve their 539
method, a completely different sample treatment was developed [57]. An 540
immunomagnetic bead-based method was used to extract Ara h3/4 from breakfast 541
cereals. The type of analyser used was changed for an IT mass analyser in order to 542
allow simultaneous acquisition in product ion and MRM mode, permitting therefore 543
the unambiguous identification of the peptides. All the modifications of the sample 544
treatment allowed an LOD and an LOQ of 3 and 10 µg peanuts g-1 matrix to be 545
obtained, respectively. This seems to be higher than in the previous article, however, 546
here the values include the extraction yield. Commercial samples were analysed and 547
results were consistent with those obtained by ELISA. 548
Shefcheck’s and Careri’s groups compare two different sample preparations. Both 549
studies were somewhat similar, however, the results obtained from each respective 550
study were diverging. Careri’s group performed the protein extraction step before the 551
digestion, whereas Shefcheck’s group preferred the digestion step before the 552
extraction. Both groups based their conclusions on the results from the experiments, 553
however, the results from Shefcheck’s group were also in agreement with the fact 554
that there are strong interactions between proteins and the tannin from the chocolate. 555
This shows that the sample preparation is important in order to obtain good 556
performances from the method in terms of LOQ and LOD. 557
558
2.2.3 The label free method 559
A more recent method is the label free approach. It was designed to simplify the 560
experimental procedure and avoid the use of stable isotopes. The quantification 561
relies either on the measurement of the so-called spectral counting [57, 58] or on the 562
ion signal intensity. In spectral counting the intensity is estimated through the number 563
of times an MS/MS transition of a peptide belonging to the quantified protein is 564
chosen. Even if this relation may be questioned, it has a link with the 565
chromatographic peak intensity and thus to the protein’s abundance. 566
The signal intensity can also be used as in classical analytical methods. As the 567
response of the mass spectrometer is not considered constant, an internal standard 568
is used, based on a known amount of an external proteins mixture [59]. 569
Very recently, in order to overcome the difficulties encountered with external 570
standards, the use of proteins of constant quantity in the mixtures has been proposed 571
as pseudo internal standard [60]. This allows finding “standard peptides” at retention 572
times close to that of the “analytes” peptides. 573
In both cases, the method is very demanding in terms of retention time quality and 574
mass spectrometric duty cycle but the new generation of instruments and the 575
availability of adapted software make those methods attractive at least for semi-576
quantification, in view of the experimental simplification they bring. The bioactives 577
proteins in lupin were analysed recently using a label free method [61]. 578
579
Conclusion
580 581
Allergens detection can be direct or indirect. For diagnosis, a large panel of well-582
established indirect methods exists. For the direct quantitative detection of the 583
presence of allergens in the food chain, the amplification of the markers of the 584
allergen contact by the patient has not taken place and the levels may be very low. 585
Mass spectrometric methods will certainly help by a major contribution: the 586
simultaneous identification of allergens and their quantification. Once identified, the 587
allergens are best quantified by absolute methods taking benefit from the use of 588
stable isotope standards. Screening tests using label free methods will certainly play 589
a part in the overall strategy provided the peptides from allergens are univocally 590
identified, mostly when processed foodstuffs are analysed. 591
Aknowlegments 592
The authors thank the belgian SPF « santé publique » for funding the Allergen and 593
Allerrisk projects. The FNRS (Fund for scientific research) is aknowlegded for his 594 continuous support. 595 596 Bibliographical references : 597 598
1. Ortolani C, Ispano M, Scibilia J, Pastorello EA (2001) Allergy 56 Suppl 67: 5-8 599
2. Kagan RS (2003) Environ Health Perspect 111: 223-225 600
3. Sicherer SH, Sampson HA (2006) J Allergy Clin Immunol 117: 470-475 601
4. Kanny G, Moneret-Vautrin DA, Flabbee J, Beaudouin E, Morisset M, Thevenin F 602
(2001) J Allergy Clin Immunol 108: 133-140 603
5. Meyer R (2008) J Fam Health Care 18: 27-30 604
6. Cercle d’investigations cliniques et biologiques en allergologie alimentaire 605 (CICBAA), (2005) 606 http://www.cicbaa.com/pages_fr/donnees/allergenes_adultes.html and 607 http://www.cicbaa.com/pages_fr/donnees/allergenes_enfants.html 608
7. European Commission (2000) Official Journal L 109, p. 29. 609
8. European Commission (2003) Official Journal L 308, p. 15 610
9. European Commission (2006) Official Journal L 310, p. 11. 611
10. Poms RE, Klein CL, Anklam E (2004) Food Additives & Contaminants 21: 1-31 612
11. Leung DYM (1997) Mol Genet Metab 63: 157-167 613
12. Sampson HA (1999) J Allergy Clin Immunol 103: 717-728 614
13. Wal J-M (2005) In Arbault P and Daussant J (2005) Tec & Doc Lavoisier (Editors), 615
Collection Sciences et techniques agroalimentaires, 444p 616
14. Ben Rejeb S, Abbott M, Davies D, Cléroux C, Delahaut P (2005) Food Addit 617
Contam 22: 709-715 618
15. Careri M, Elviri L, Mangia A, Mucchino C (2007) Anal Bioanal Chem 387: 1851-619
1854 620
16. Poms RE, Anklam E, Kuhn M (2004) J AOAC Int 87: 1391-1397 621
17. Hirao T, Hiramoto M, Imai S, Kato H (2006) J Food Prot 69: 2478-2486 622
18. Frémont S, Kanny G, Bieber S, Nicolas JP, Moneret-Vautrin DA (1996) Allergy 623
51: 749-754 624
19. Koppelman SJ, Knulst AC, Koers WJ, Penninks AH, Peppelman H, Vlooswijk R, 625
Pigmans I, van Duijn G, Hessing M (1999) J Immunol Methods 229: 107-120 626
20. Blais BW, Gaudreault M, Phillippe LM (2003) Food Control 14: 43-47 627
21. Scheibe B, Weiss W, Ruëff F, Przybilla B, Görg A (2001) J Chromatogr B Biomed 628
Sci Appl 756: 229-237 629
22. Yamanishi R, Kondo K, Tsuji H, Ogawa T (1995) Biosci Biotechnol Biochem 59: 630
1272-1275 631
23. Yamanishi R, Tsuji H, Bando N, Yoshimoto I, Ogawa T (1997) Biosci Biotechnol 632
Biochem 61: 19-23 633
24. Kaul S, Lüttkopf D, Kastner B, Vogel L, Höltz G, Vieths S, Hoffmann A (2007) Clin 634
Exp Allergy 37: 141-150 635
25. Sanz ML, Maselli JP, Gamboa PM, Oehling A, Diéguez I, de Weck AL (2002) J 636
Investig Allergol Clin Immunol 12: 143-154 637
26. De Weck AL, Sanz ML, Gamboa PM, Aberer W, Bienvenu J, Blanca M, Demoly 638
P, Ebo DG, Mayorga L, Monneret G, Sainte-Laudy J (2008) Int Arch Allergy 639
Immunol 146: 177-189 640
27. Ebo DG, Bridts CH, Hagendorens MM, Aerts NE, De Clerck LS, Stevens WJ 641
(2008) Cytometry B Clin Cytom 74: 201-210 642
28. Moneret-Vautrin DA, Sainte-Laudy J, Kanny G, Frémont S (1999) Ann Allergy 643
Asthma Immunol 82: 33-40 644
29. Ebo DG, Hagendorens MM, Bridts CH, Schuerwegh AJ, De Clerck LS, Stevens 645
WJ (2005) Cytometry B Clin Cytom 64: 28-33 646
30. Worm M, Hompes S, Fiedler EM, Illner AK, Zuberbier T, Vieths S (2000) Clin Exp 647
Allergy 39: 159-166 648
31. Kadooka Y, Idota T, Gunji H, Shimatani M, Kawakami H, Dosako S, Samori T 649
(2000) Int Arch Allergy Immunol 122: 264-269 650
32. Kleine-Tebbe J, Erdmann S, Knol EF, MacGlashan DW Jr, Poulsen LK, Gibbs BF 651
(2006) Int Arch Allergy Immunol 141: 79-90 652
33. Bindslev-Jensen C, Briggs D, Osterballe M (2002) Allergy 57: 741-746 653
34. Taylor SL, Hefle SL, Bindslev-Jensen C, Atkins FM, Andre C, Bruijnzeel-Koomen 654
C, Burks AW, Bush RK, Ebisawa M, Eigenmann PA, Host A, Hourihane JO’B, 655
Isolauri E, Hill D J, Knulst A, Lack G, Sampson HA, Moneret-Vautrin DA, Rance 656
F, Vadas PA, Yunginger JW, Zeiger RS, Salminen JW, Madsen C, Abbott P 657
(2004) Clin Exp Allergy 34: 689-695 658
35. Crevel RWR, Ballmer-Weber BK, Holzhauser T, Hourihane JO’B, Knulst AC, 659
Mackie AR, Timmermans F, Taylor SL (2008) Allergy 63: 597–609 660
36. Huber CG, Premstaller A (1999) J Chromatogr A 849: 161-173 661
37. Czerwenka C, Maier I, Potocnik N, Pittner F and Lindner W (2007) Anal Chem 79: 662
5165-5172 663
38. Monaci L and van Hengel AJ (2008) J Chromatogr A 1192: 113-120 664
39. Ong SE, Blagoev B, Kratchmarova I, Kristensen DB, Steen H, Pandey A, Mann M 665
(2002) Mol Cell Proteomics 1: 376-386 666
40. Gygi SP, Rist B, Gerber SA, Turecek F, Gelb MH, Aebersold R (1999) Nat 667
Biotech 10: 994–999 668
41. Schmidt A, Kellermann J, Lottspeich F (2005) Proteomics 5: 4–15 669
42. Ross PL, Huang YN, Marchese JN, Williamson B (2004) Mol Cell Proteomics 3: 670
1154-1169 671
43. Ulla S (2007) WO 2007/031080 A1 672
44. Hobson DJ, Rupa P, Diaz GJ, Zhang H, Yang M, Mine Y, Turner PV, Kirby GM 673
(2007) Food Chem Toxicol 45: 2372-2380 674
45. Alm R, Ekefjärd A, Krogh M, Häkkinen J, Emanuelsson C (2007) J Proteome Res 675
6: 3011-3020 676
46. Ji J, Chakraborty A, Geng M, Zhang X, Amini A, Bina M, Regnier F (2000) J 677
Chromatogr B 745 : 197–210 678
47. Gerber SA, Rush J, Stemman O, Kirschner MW, Gygi SP (2003) Proc Natl Acad 679
Sci USA 100: 6940-6945 680
48. Gygi SP and Gerber SA (2003) WO 2003/016861 A2 681
49. Pratt JM, Simpson DM, Doherty MK, Rivers J, Gaskell SJ, Beynon RJ (2006) Nat 682
Protoc 1: 1029-1043 683
50. Kirsch S, Widart J, Louette J, Focant JF, De Pauw E (2007) J Chromatogr A 684
1153: 300-306 685
51. Brun V, Dupuis A, Adrait A, Marcellin M, Thomas D, Court M, Vandenesch F, 686
Garin J (2007) Mol Cell Proteomics 6: 2139-2149 687
52. Weber D, Raymond P, Ben-Rejeb S, Lau B (2006) J Agric Food Chem 54: 1604-688
1610 689
53. Shefcheck KJ, Musser SM (2004) J Agric Food Chem 52: 2785-2790 690
54. Shefcheck KJ, Callahan JH, Musser SM (2006) J Agric Food Chem 54: 7953-691
7959 692
55. Chassaigne H, Norgaard JV, Hengel AJ (2007) J Agric Food Chem 55: 4461-693
4473 694
56. Careri M, Costa A, Elviri L, Lagos JB, Mangia A, Terenghi M, Cereti A, Perono 695
Garoffo L (2007) Anal Bioanal Chem 389: 1901-1907 696
57. Choi H, Fermin D, Nesvizhskii A (2008) Mol Cell Proteomics 7: 2373-2385 697
58. Liu H, Sadygov RG, Yates JR (2004) Anal Chem 76: 4193-4201 698
59. Bantscheff M, Schirle M , Sweetman G, Rick J, Kuster B (2007) Anal Bioanal 699
Chem 389: 1017–1031 700
60. Tabata T, Sato T, Kuromitsu J, Oda Y (2007) Anal Chem 79: 8440-8445 701
61. Brambilla F, Resta D, Isak I, Zanotti M, Arnoldi A (2009) Proteomics 9: 272-286 702
7. United Nations Environment Programme, International Labour Organisation, World 704
Health Organization, International Programme On Chemical Safety (1999) 705
Environmental Health Criteria No 212 706