Comparative responses to sodium selenite and Sel-Plex
®organic selenium supplements in Belgian Blue cows and
calves
H. GUYOT1, F. ROLLIN1, SYLVIE ANDRIEU2 AND PETER SPRING3
1?; 2Alltech Inc., Dunboyne, Co. Meath, Ireland; 3Swiss College of Agriculture, Zollikofen, Switzerland
Introduction
The most common problems in bovine medicine are multi-factorial in nature. Beef cattle herds typically experience post-natal maladjustment syndrome, neonatal diarrhoea, respiratory problems, dermatological problems (mange), myopathies (skeletal and cardiac muscles, congenital myopathy of the tongue) and fertility problems. Such problems are increasingly treated by prevention, which proves more economical and better preserves health. Vitamin and trace element deficiencies are frequently identified as causative together with other biological and environmental factors. These deficiencies develop due to increasing nutrient demand with higher production (genetic selection) and decreasing supply due to impoverishment of soils and forages, monocultured cropping systems and the reluctance of farmers to invest in fertilizers, concentrates and food supplements. The hypermuscular Belgian Blue (BB) breed of cattle is particularly sensitive to trace element deficiencies, especially to selenium. Additionally, this breed is often maintained under conditions that increase the likelihood of deficiencies (depleted soils and forages).
SELENIUM DEFICIENCIES IN BELGIUM AND EUROPE
Soils in Belgium and in neighbouring areas tend to have low pH and significant amounts of iron. These factors, plus high rainfall, lead to soil retention of selenium and poor uptake by plants (Cary and Allaway, 1969; Miller et al., 1993). In consequence, selenium deficiency in Belgian Blue herds is common (Table 1); and effects of selenium supplementation are easily demonstrated. In recent studies (Guyot, 2002; Rollin et al., 2002), 26 out of 30 (87%) of Belgian Blue herds reporting diarrhoea and respiratory problems were deficient in selenium. A more recent survey indicated 76 of 101 herds were selenium deficient (Guyot, unpublished, 2005). In Europe, such situations are commonly described. Mee et al. (1994) reported that up to 70% of Irish dairy herds were deficient in selenium. A more highly available selenium supplement is needed to address this ruminant health problem (Cottrill et al., 2004).
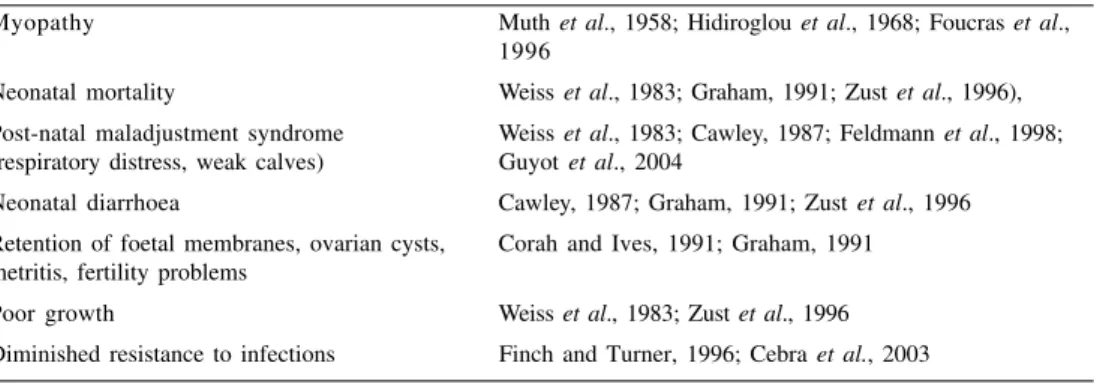
Table 1. Symptoms of selenium deficiency
Myopathy Muth et al., 1958; Hidiroglou et al., 1968; Foucras et al., 1996
Neonatal mortality Weiss et al., 1983; Graham, 1991; Zust et al., 1996), Post-natal maladjustment syndrome Weiss et al., 1983; Cawley, 1987; Feldmann et al., 1998; (respiratory distress, weak calves) Guyot et al., 2004
Neonatal diarrhoea Cawley, 1987; Graham, 1991; Zust et al., 1996 Retention of foetal membranes, ovarian cysts, Corah and Ives, 1991; Graham, 1991 metritis, fertility problems
Poor growth Weiss et al., 1983; Zust et al., 1996 Diminished resistance to infections Finch and Turner, 1996; Cebra et al., 2003
SHOULD HIGHER THAN RECOMMENDED LEVELS BE FED?
Given the higher selenium demand of Belgian Blue cattle and the low natural organic selenium content of native feed ingredients and mineral supplements, it is important to provide a form of selenium that can be easily absorbed and retained. Scientific agencies recommend 0.1-0.5 ppm Se in dry matter. The lower dosage is achieved in Belgium with standard mineral supplements, but measurements of blood Se concentration reveal that this dosage is just barely sufficient to avoid clinical deficiency signs in most cattle. This marginal selenium status is indicated by values in the range of 60-70 µg Se/L. Villar et al. (2002) has stated that 68.4 ± 17 µg Se/L is the ‘normal’ range, but that higher levels lead to better immunity and performance.
Economically the goal in bovine production must not be simply restricted to the ‘visible part of the iceberg’, which are the clinical signs of diseases. However, the clearest diagnosis is an improvement in growth or health in response to a specific supplement (Suttle, 1986). If subclinical disease is present, then higher than ‘normal’ dietary mineral levels may be indicated.
Selenium levels and forms for Belgian Blue cattle
AIMS OF THE STUDY
Trials in dairy cattle have demonstrated efficacy of organic selenium in the form of
Sel-Plex® selenium yeast (Baumgartner et al., 1998; Ortman and Pehrson, 1999). In humans,
bioavailability of selenomethionine has been found to be higher than that of inorganic Se sources (Rayman, 2004). The objective of this field trial was to evaluate the effects of selenium supplementation level and form on performance and health in selenium-deficient Belgian Blue cattle.
METHODS Animals
Sixty Belgian Blue cows from two farms with low selenium status were enrolled in the study a minimum of 60 days prior to expected calving date. Approximately a third of
the animals were heifers and the remaining were multiparous. The trial was conducted as a controlled field test set up as a double-blinded study.
Farm 1 started the trial on 8December 2004 and ended on 11 April 2005. Farm 2
started the trial on 10 December 2004 and finished on 27 April 2005. Farm 1 ended earlier owing to good weather prompting the farmer to turn the cattle out to pasture.
Animals were allocated to treatments according to age and expected date of calving. Date of calving was either calculated using artificial insemination date or estimated through rectal palpation and/or ultrasound examination. Animals on the same treatment were housed together. All calvings were by caesarean section. All calves were monitored at least 45 days post-partum.
Diets and treatments
Feed was distributed twice daily and was composed of corn silage (60%), beet pulp silage (33%), hay (3%) and cereal (spelt, 3%) on Farm 1; and hay (64%), molasses (8%) and 28% of a special mix (dried beet pulp-dried alfalfa-bran) on Farm 2. The total daily dry matter (DM) ingested was ~12 kg/cow on each farm. Mineral supplement (75 g/head/day, Table 2) was distributed once daily and manually mixed into the ration. Supplementation began a minimum of 60 days before expected calving date and lasted until at least 60 days after calving. The mineral formulas differed only in level and source of selenium resulting in three dietary treatments:
A: 0.5 ppm Se as Sel-Plex®
(Alltech Inc., Nicholasville, Kentucky, US) B: 0.5 ppm Se as sodium selenite
C: 0.1 ppm Se as sodium selenite
Three ear tag colours and similarly marked mineral buckets identified animals and treatments.
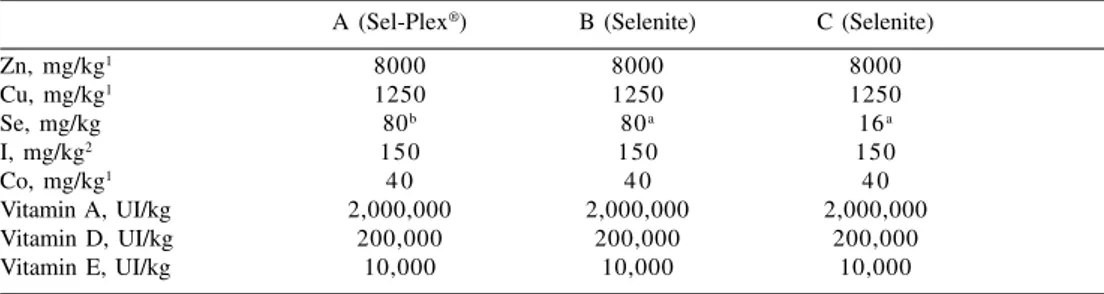
Table 2. Mineral supplement composition.
A (Sel-Plex®) B (Selenite) C (Selenite)
Zn, mg/kg1 8000 8000 8000 Cu, mg/kg1 1250 1250 1250 Se, mg/kg 80b 80a 16a I, mg/kg2 150 150 150 Co, mg/kg1 4 0 4 0 4 0 Vitamin A, UI/kg 2,000,000 2,000,000 2,000,000 Vitamin D, UI/kg 200,000 200,000 200,000 Vitamin E, UI/kg 10,000 10,000 10,000
aSelenium added as sodium selenite bSelenium added as Sel-Plex® 1Sulphate
2Iodate
All calves suckled colostrum. If a cow had low milk production, the calf was given milk replacer twice daily. The quantities increased from 5 L/day during the first month to 6 L/day thereafter. Selenium content of calf milk replacer (0.03 mg/L) was identical on the two farms. All calves had free access to water, hay and starter feed. Consumption of hay and calf starter was negligible.
Housing
Cows were tethered in concrete-floored stalls bedded with straw. Calf housing depended on the feeding system but was similar on each farm. When receiving milk replacer, calves were placed in individual boxes for the two first weeks of life and were then removed to a free area with straw. When suckling, calves were in free areas with straw, either behind their dams or tethered beside them.
Measurements
Blood samples were drawn from the caudal vein of two cows and one heifer per treatment on each farm and from the jugular veins of their calves for measurement of plasma Se content (Se), glutathione peroxidase (GSH-Px) and total IgG (calves). Initial samples were taken from cows on Day 1 before mineral was fed. Subsequent blood samples were drawn immediately after ration and mineral were distributed in the morning respectively days 15, 60, 90, 120 and on day 150 when possible.
Colostrum and milk selenium contents were determined on samples from the same two cows and one heifer per treatment on each farm. Colostrum samples were taken at calving and milk was taken from the same animals one week after calving.
Calves were weighed at birth and at ~2 months of age (+/-15 days). Average daily gain (ADG) was calculated. Blood samples drawn at T0 (between 0 and 15 days of age), T15, T45 and T75 were used to determine total Ig and selenium concentration. The last two samples were taken only if cows had not been put out to pasture. General health of calves was assessed.
Statistical evaluation
Data were found to be normally distributed. Blood mineral and colostrum/milk data were analysed using the GLM procedures of SAS and least squares means were calculated. Influence of farm, treatment and two-way interactions were tested as fixed effects. Calf ADG was analysed using a linear model with farm, group, treatment, sex and two-way interactions as fixed effects (Proc GLM, SAS) and least squares means were computed. A logistic regression was used to compare disease incidence between groups. Although a p value of <0.05 is usually taken as significant, this study considered values differing at p<0.1 significant in light of the usual difficulties of bovine medicine under field conditions.
RESULTS
Selenium status: dams
Plasma Se. At the start of the study plasma Se was low (deficient) in all treatment
groups, but was significantly higher for cattle in Group C (0.1 ppm selenite Se) (p=0.00065). The threshold defined for deficiency is <70 µg/L (Villar et al., 2002). At the end of the study, plasma Se in Group C remained low (Figure 1). An effect of selenium form on plasma Se was noted after one month of supplementation. The effect of dietary selenium dose (0.5 ppm vs 0.1 ppm) was noted after only 15 days. In both groups given 0.5 ppm Se, plasma Se progressively increased and plateaued at 60 days. In contrast, plasma Se in cattle given 0.1 ppm Se as selenite remained static. Results were similar on the two farms.
0 20 40 60 80 100 120 140 160 T0 T15 T30 T60 T90 T final Se (µg/L) Sel-Plex® 0.5 ppm Se Selenite 0.5 ppm Se Selenite 0.1 ppm Se
Figure 1. Effect of selenium level and form on plasma selenium content of cows.
GSH-Px in RBCs. GSH-Px in red blood cells is highly correlated with plasma Se
content in cattle (Paglia and Valentine, 1967; Backall and Scholz, 1979; Koller et al., 1984; Counotte and Hartmans, 1989). It was used in this study to further corroborate dam plasma Se status. Nevertheless, GSH-Px activity can sometimes show spiked activity, which can reflect sudden oxidative stress. This oxidative stress is not always accompanied by clinical signs and is only indicated by a sudden increase in GSH-Px. In our experience, the threshold for GSH-Px deficiency/adequacy in cattle is <250 UI/gHb. This value corresponds to about 70 µg/L plasma Se for adult cattle.
At the beginning of the study, GSH-Px activity in all groups was below that considered normal. As noted for plasma Se, cattle given 0.1 ppm selenite Se began the study with higher GSH-Px activity; however values were still in the deficient range. At the end of the study, GSH-Px activities in cattle given 0.5 ppm Se from either source were in the normal range, however values for those given 0.1 ppm had marginal status (Figure 2). No significant difference at the end of the trial was seen due to selenium form at 0.5 ppm Se, but values in cattle given 0.1 ppm selenite Se were lower (P<0.01).
0 50 100 150 200 250 300 350 400 450 500 T0 T15 T30 T60 T90 T final GSH-Px activity (Ul/gHb) Sel-Plex® 0.5 ppm Se Selenite 0.5 ppm Se Selenite 0.1 ppm Se
Selenium content of colostrum and milk
As demonstrated in numerous other studies, selenium content of colostrum and milk
was increased in cattle given Sel-Plex®
Se (Figure 3). There were not differences between values for cows given 0.1 or 0.5 ppm Se from selenite. Plasma Se of the dam was correlated (P<0.01) with colostrum and milk selenium concentration.
0.00 0.05 0.10 0.15 0.20 0.25 Sel-Plex® 0.5 ppm Se Selenite 0.5 ppm Se Selenite 0.1 ppm Se Se (mg/L) Colostrum Milk
Figure 3. Effect of dietary selenium level and form on selenium level of milk and colostrum.
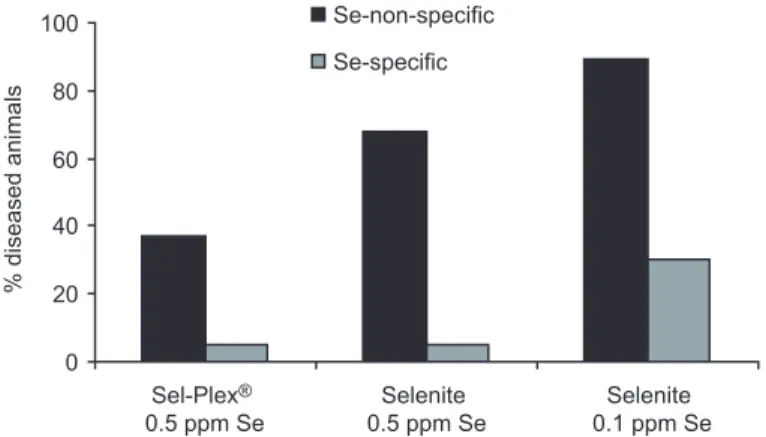
Health of cows
Disease incidence was classified as either having a close link to selenium deficiency (specific) or with no reported association with selenium status (non-specific). Se-specific diseases were considered to be udder oedema, mastitis (clinical and subclinical), placental retention and metritis. Se-non-specific diseases are accident, lameness and mange. As it is an empiric designation, few conclusions can be drawn, however trends can be noted. Lameness comprised the majority of non-Se-specific disease (Figure 4). Of the Se-specific diseases, cattle given 0.5 ppm Se appeared to be less affected than those given 0.1 ppm. 0 20 40 60 80 100 Sel-Plex® 0.5 ppm Se Selenite 0.5 ppm Se Selenite 0.1 ppm Se % diseased animals Se-non-specific Se-specific
Figure 4. Effect of selenium level and form on incidence of Se-specific and non-specific diseases in Belgian Blue cattle.
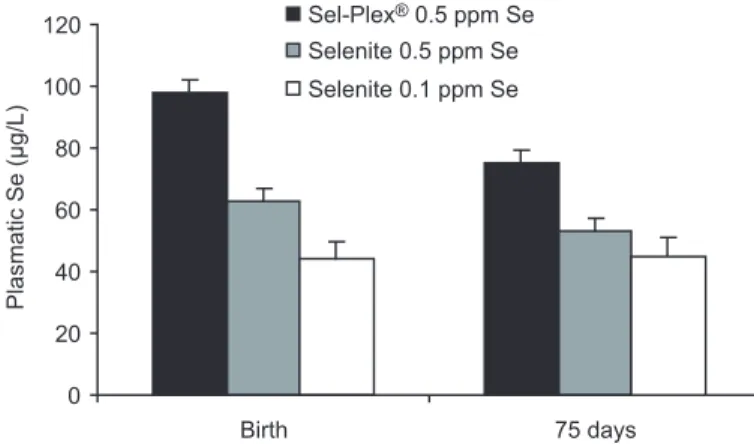
Selenium status: calves
Plasma Se. Only calves born to dams receiving Sel-Plex®
were born in good selenium status (>70 µg Se/L, Figure 5). Calves from dams receiving 0.5 and 0.1 ppm Se from selenite had marginal and deficient selenium status, respectively. At day 75 the differences between treatment groups remained, with selenium status higher than the other treatments
in the Sel-Plex®
group (P<0.01) and no difference between those given selenite (P=0.31).
0 20 40 60 80 100 120 Birth 75 days Plasmatic Se (µg/L) Sel-Plex® 0.5 ppm Se Selenite 0.5 ppm Se Selenite 0.1 ppm Se
Figure 5. Effect on plasma selenium of calves of selenium level and source fed the dam. Calf feeding systems and thus selenium level differed between the farms, which complicates this comparison. All sampled calves from dams given 0.1 ppm selenite Se
were nursing, however all calves in the Sel-Plex®
group received milk replacer on Farm 1, but only 33% on Farm 2. On Farm 1, 66% of calves in the 0.5 ppm selenite Se group received milk replacer, but none in the same group on farm 2. Selenium derived from milk replacer (5 L @ 0.03 mg Se/L) is ~0.15-0.18 mg of Se/calf/day. If a calf also drinks 5 L/day if nursing, then daily selenium intakes for the sampled calves on Farm 1 would be ~0.9 mg (1.5 ppm Se for 50 kg calf), 0.2 mg (0.3 ppm) and 0.1 mg (0.16 ppm) for treatments A, B and C, respectively. On Farm 2, sampled calves received ~0.35 mg (0.58 ppm) in group A and 0.1 mg (0.16 ppm) in groups B and C. Calves
nursing dams given Sel-Plex®
would receive ~5 times more selenium than if drinking milk replacer. Calves from cows given either level of dietary selenite received about the same amount of selenium whether nursing or consuming milk replacer.
RBC GSH-Px. GSH-Px activity at birth was similar among treatments; and levels
were higher in calves than dams in all cases. Two months later, GSH-Px in calves from
cows given Sel-Plex®
was higher than those in the 0.1 ppm selenite Se group (P=0.02), but did not differ from values in the 0.5 ppm selenite Se treatment (Figure 6).
CALF HEALTH AND DAILY GAIN
During the first 15 days of life, diarrhoea is the disease most often observed. Incidence
of diarrhoea was 6, 21 and 29% in calves from dams given 0.5 Sel-Plex®
Se, 0.5 and 0.1 ppm selenite Se, respectively. Chi square analysis indicated a significant difference
0 100 200 300 400 500 600 700 Birth T15 T45 T75
GPXe activity (Ul/gHb)
Sel-Plex® 0.5 ppm Se Selenite 0.5 ppm Se Selenite 0.1 ppm Se
Figure 6. GSH-Px activity in calf red blood cells.
0 100 200 300 400 500 600 700 800 ADG (g/day) Sel-Plex® 0.5 ppm Se Selenite 0.5 ppm Se Selenite 0.1 ppm Se
Figure 7. Daily gain of calves.
from the 0.1 ppm selenite Se treatment for Sel-Plex®
only (0.039). The odds ratio (logistic regression) was 10.215 for group A vs group C, meaning that probability of Se-specific disease was ~10-fold higher in calves in the 0.1 ppm Se treatment than in
those in the Sel-Plex®
group.
Calves from Sel-Plex®
-supplemented cows had higher rates of gain than those in the selenite treatments (P<0.06), which were similar (Figure 7). The two farms reported similar rates of gain.
Conclusions
Selenium status of cows given 0.1 ppm Se and their calves remained below the 70 µg/ L threshold considered adequate for good health, indicating that the standard practice of
providing 0.1 ppm Se to Belgian Blue cattle is insufficient. Selenium status of cows given 0.5 ppm Se in either form resulted in increased plasma Se and GSH-Px activity in
cows, with highest values in cows given Sel-Plex®. Cows given 0.5 ppm Sel-Plex® Se
were also better able to supply selenium to their calves, as indicated by better Se status at birth, higher colostrum and milk Se, higher plasma Se and GSH-Px activity 75 days post-partum, and improved daily gain. For both cows and calves, disease incidence was
reduced when cows were given 0.5 ppm Se, particularly in Sel-Plex® form.
References
Backall, K.A. and R.W. 1979. Scholz. Reference values for a field test to estimate inadequate glutathione peroxidase activity and selenium status in the blood of cattle. Am. J. Vet. Res. 40:733-738.
Baumgartner, W., B. Matzka, E. Scherr E. and F. Tataruch. 1998. Selenium values in blood and milk of cattle after selenium supplementation. AACV, Sydney, pp. 1059-1062. Cary, E.E. and W.H. Allaway. 1969. The stability of different forms of selenium applied to
low selenium soils. Soils. Sci. Amer. Proc. 33:571-574.
Cawley, G.D. 1987. Selenium and weak calf syndrome. Vet. Rec., pp. 10-47.
Cebra, C.K., J.R. Heidel, R.O. Crisman and B.V. Stang. 2003. The relationship between endogenous cortisol, blood micronutrients, and neutrophil function in postparturient Holstein cows. J. Vet Intern. Med. 17:902-907.
Corah, L.R. and S. Ives. 1991. The effects of essential trace minerals on reproduction in beef cattle. Vet. Clin. North. Amer. Food Anim. Pract. 7(1) :41-57.
Cottrill, B., E. Mccartney and B. Pehrson. 2004. Solving a human nutritional problem? Feed International, July, pp. 14-18.
Counotte, G.H.M. and J. Hartmans. 1989. Relation between selenium content and glutathion-peroxidase activity in blood of cattle. The Veterinary Quaterly 11:155-160.
Feldmann, M, G. Jachens, M. Holtershinken and H. Scholz. 1998. Effects of a selenium/ vitamin E substitution on the development of newborn calves on selenium-deficient farms. Tierarztl Prax Ausg G Grosstiere Nutztiere. 26(4):200-204.
Finch, J.M. and R.J. Turner. 1996. Effects of selenium and vitamin E on the immune responses of domestic animals. Res. Vet. Sci. 60:97-106.
Foucras, G., F. Schelcher and J.F. Valarcher. 1996. La dystrophie musculaire nutritionnelle chez les ruminants. Le Point Vétérinaire 172:841-846.
Graham, T.W. 1991. Trace elements deficiencies in cattle. Vet. Clin. North Amer. Food Anim. Pract. 7:153-215.
Guyot, H. 2002. Evidence of trace elements deficiencies in Wallonian dairy and beef cattle herds. Mémoire présenté en vue de l’obtention du Diplôme d’Etudes Spécialisées en Gestion Intégrée de la Santé et des Productions Animales. ULg, FMV.
Guyot, H., H. Aliaoui and F. Rollin. 2004. Trace elements deficiencies in the pathogenesis of respiratory distress syndrome in the mature newborn calf. In: Proceedings: XXIII World
Buiatrics Congress. Quebec, Canada.
Hidiroglou, M. and K.J. Jenkins. 1968. Factors affecting the development of nutritional muscular dystrophy in northern Ontario. Can. J. Anim. Sci. 48:7-14.
selenium levels and glutathione peroxidase activity in bovine whole blood. Can. J. Comp. Med. 48:431-433.
Mee, J.F., K.J. O’Farrel and P.A.M. Rogers. 1994. Base-line survey of blood trace elements status of 50 dairy herds in the south of Ireland in the spring and autumn of 1991. Irish Vet. J. 47:155-122.
Miller, J.K., E. Brzezinska–Slebodzinka and F.C. Madsen. 1993. Oxidative stress, antioxidants and animal function. J. Dairy Sci. 76:2812.
Muth, O.H., J.E. Oldfield, L.F. Remmert and J.R. Schubert.1958. Effects of selenium and vitamine E on white muscle disease. Science 128:1090.
National Research Council. 2001. Nutrient Requierements of Dairy Cattle. National Academy
Press (7th Rev. Ed.), Washington, DC.
Ortman, K. and B. Pehrson. 1999. Effect of selenate as a feed supplement to dairy cows in comparison to selenite and selenium yeast. J. Anim. Sci. 77:3365-3370.
Paglia, D.E. and W.N. Valentine. 1967. Studies on quantitative and qualitative characterisation of erythrocyte glutathione peroxidase. J. Lab. Clin. Med. 70:158-169.
Rayman, M.P. 2004. The use of high-selenium yeast to raise selenium status: how does it measure up? Brit. J. Nutr. 92:557-573.
Rollin, F., P. Lebreton and H. Guyot. 2002. Trace elements deficiencies in Belgian beef and dairy herds in 2000-2001. In: Proceedings: XXII World Buiatrics Congress. Hanover, Germany.
Suttle, N.F. 1986. Problems in the diagnosis and anticipation of trace elements deficiencies in grazing livestock. Vet. Records 119:148-152.
Villar, D., J.R. Arthur, J.M. Gonzalez and F.J. Pallares. 2002. Selenium status in cattle: interpretation of laboratory results. The Bovine Practioner 36:73-80.
Weiss, W.P., V.F. Colenbrander, M.D. Cunningham and C.J. Callahan. 1983. Selenium/ vitamin E: Role in disease prevention and weight gain of neonatal calves. J. Dairy Sci. 66:1101-1107.
Zust, J., B. Hrovatin and B. Simundic. 1996. Assessment of selenium and vitamin E in dairy herds and clinical disease in calves. Vet. Rec. 139(16):391-394.