Crop Protection Volume 56, February 2014, Pages 91–97
Contribution of spray droplet pinning
fragmentation to canopy retention
• H.H. Boukhalfa a, b, M. Massinon a, M. Belhamra b, F. Lebeau a,
• a UMC, Gembloux Agro-Bio Tech, University of Liege, Passage des Déportés, 2,
B-5030 Gembloux, Belgium
• b University Mohamed Khidar, BP 145 RP, 07000 Biskra, Algeria
Highlights
• We investigated retention for drops splashing in the Wenzel wetting regime. • 45–58% of the volume of these drops remained on the leaf after impact.
• This contributed from 28 to 46% of the retention on barley, and was a function of formulation and VMD.
• The contribution of these drops should be included in process-based retention models.
Abstract
Drop behaviour during impact affects retention. Increasing adhesion is usually seen as an objective when applying crop protection products, while bouncing and shattering are seen as detrimental to spray retention. However, observation of drop impacts on barley (Hordeum
vulgare L.) using high speed shadowgraphy shows that bouncing and fragmentation can occur in Cassie–Baxter as well as in Wenzel wetting regimes. In this last regime, a part of the drop may remain stuck on the surface, contributing to retention. Using simultaneous measurements of drop impacts with high speed imaging and of retention with fluorophotometry for spray mixtures on excised barley leaves using a Teejet 11003 nozzle at 0.2 MPa, it was observed that about 50% of the drops that fragmented in the Wenzel state remain on the horizontal leaf. Depending on the spray mixture, these impact outcomes accounted for 28–46% of retention, the higher contribution being correlated with bigger VMD (Volume Median Diameter). This contribution is not negligible and should be considered when modelling spray retention processes.
Keywords
• Pinning fragmentation; • Retention; • Drop impact; • Splashing;1. Introduction
The efficiency of pesticide application methods has been a concern for decades. Numerous studies have addressed the issue using an experimental approach based either on pest control trials using various application technologies and settings, or on retention studies using chemical tracers (Shuterud et al., 1988). Stevens (1993) addressed primary adhesion effects showing that velocity and droplet size gave a high degree of correlation with adhesion. Model track sprayer studies have led to the design of models to explain the retention effect (Stock, 1997). Interpretation of these trials is always tricky because of the numerous parameters involved. However, most of the relevant parameters governing the retention process have been identified including, for example, the following (Wilson, 2003): drop velocity and
diameter, resulting from application rate, forward speed, pressure and nozzle or atomizer type; spray formulation properties such as dynamic surface tension, dynamic viscosity, etc.; target surface properties such as plant species, leaf angle, hydrophobicity and growth stage. These parameters have been the foundation of a universal spray droplet adhesion model (Forster et al., 2005) based on four easily measured variables; dynamic surface tension, static contact angle for a 50% water-acetone solution, droplet velocity and impact angle that predict spray droplet adhesion at initial contact with a leaf surface. Such models are still refined to include new parameters as hairs (Nairn et al., 2013). Maximising pesticide application efficiency therefore requires good control of droplet size and velocity distributions (Butler Ellis et al., 1997). Drift-reducing adjuvants and many other adjuvants used to improve droplet behaviour on the target influence spray formation, droplet transport to the target and droplet interaction with the target (Butler Ellis et al., 1999).
In order to evolve a better comprehension of pesticide application efficiency, it has been proposed that treatments should be divided into appropriate models of each successive step of deposition, retention, uptake and translocation (Zabkiewicz, 2007) and process driven models based on detailed fundamental studies developed that may substitute to laboratory screening methods, empirical tests and field trials. A global process-based efficacy model is still far from being achieved. However, substantial effort in this direction is underway. Amongst these processes, the wetting of leaf surfaces has long been known to govern retention and been the subject of numerous theoretical studies on lotus effect or super-hydrophobicity (Caviezel et al., 2008). Mechanisms for the wetting of leaf surfaces by agrochemicals are reviewed in Taylor (2011). Surface roughness enhances the hydrophobicity of the material compared to Young's ideal model. The theory of wetting for rough surfaces is often described by two models based on Young's equation:
-
Wenzel sticking or pinning wetting regime (Wenzel, 1936) where an increase in the surface area is observed due to the micro-texture, describes when the liquid fills the rough grooves completely and replaces the air trapped in the surface roughness to fit into the microstructure of the material.
Cassie–Baxter wetting regime (Cassie and Baxter, 1944) describes the wetting of rougher (porous) surfaces where air pockets are trapped in the surface texture beneath the liquid. The drop contacts only the top of the surface asperities.
Retention and distribution of spray drops within the canopy have a direct effect on the biological efficacy of pesticides. For instance, higher spray deposition on the target leaves will likely result in more uptake by the plant in the case of a systemic pesticide and less pesticide available for environmental contamination (Smith et al., 2000). In order to maximise spray retention, droplets should remain on the plant at first impact.
Retention studies are an old story (Furmidge, 1962 and Wirth et al., 1991) but they nevertheless have benefited recently from developments in theoretical physics, mainly because of industrial interest in self-cleaning surfaces as well as technical developments in artificial substrate synthesis. Customisable synthetic superhydrophobic substrates offer new tools to investigate the effect of the various geometrical and chemical parameters involved in drop impacts outcomes (Rioboo et al., 2008). These studies have resulted in
phenomenological phase diagrams (Fig. 1) that map the transition from adhesion to bouncing and finally splashing for increasing impact energy according to Wenzel surface roughness, a topographical parameter (Massinon and Lebeau, 2013). For low roughness, a drop with low kinetic energy is deposited in the Wenzel state. By gradually increasing its kinetic energy, the drop is fragmented with a fraction of the droplet adhering at the impact point. Depending on the impact energy, a single satellite drop (referred to as ‘partial rebound’) or several satellite drops (referred to as ‘pinning fragmentation’) can leave the surface, whereas the rest of the drop adheres to the impact point. For intermediate Wenzel roughness, low velocity drops adhere in a Cassie–Baxter regime. With increasing speed, the drop bounces completely. If impact pressure is great enough, depending on liquid surface tension, the liquid can penetrate the surface roughness, modifying the outcome from Cassie–Baxter to Wenzel wetting regime. Thus, sticking, partial rebound or pinning fragmentation outcomes can be observed. Finally, for higher Wenzel roughness, a drop can, depending on impact velocity, adhere in a Cassie– Baxter regime, rebound or shatter completely. If it splashes, all of the liquid is shattered into numerous satellite drops that leave the surface with no fraction of the drop remaining at the point of impact. Further information about droplet impact can be found in Yarin (2006).
Fig. 1.
Impact phase diagram for a drop depending on leaf hydrophobicity and droplet impact velocity.
As three outcomes are possible when a droplet impacts a leaf surface: adhesion, bouncing or splashing, these have a direct influence on spray retention. Leaf morphology plays an
important role in spray deposition because different leaf structures such as waxes, hairs, edges and veins are important impingement and retention variables (Smith et al., 2000). Drops that bounce or splash can continue their journey through the canopy until a new interception by the plant or the ground (Cox et al., 2000). Physical process-based retention models based on drop bouncing, adhesion and splashing have been described (Mercer et al., 2010). This has allowed differences in total spray retention to plants, due to the spray formulation used or vegetative species studied, to be predicted (Forster et al., 2010) and included in a spray application software (Forster et al., 2012). This method was used to illustrate the effect of different spray formulation and application parameters on predicted retention and compared with measured retention. This approach proved very successful (Forster et al., 2013) but some increase of retention with the decrease of DST was not accounted for on barley. Indeed, in these models, splashing was considered to occur in the Cassie–Baxter wetting regime and to leave no residue on the plant. It has been observed using droplets produced by agricultural sprays that this simplification of the reality may result in systematic modelling errors, especially when surfactants are used, the most widely used adjuvant type in agrochemical applications and the most efficient in enhancing their efficacy (Wang and Liu, 2007). Indeed, surfactants affect the physicochemical properties of spray droplets in terms of their ultimate impaction and spreading behaviour (Holloway et al., 2000). This results in a transition from Cassie–Baxter to Wenzel regime on difficult-to-wet species. Therefore a significant part of fragmentation outcomes may occur in Wenzel regime. This pinning fragmentation results in a deposit of a fraction of the drop during impact. This partial splash may need to be accounted for in models for retention but the sticking proportion must be evaluated. This paper addresses this issue. The objective was to assess the contribution of pinning fragmentation to spray retention on barley leaves (Hordeum vulgare L.). The methodology relies on the simultaneous
observation of impacts by high speed imaging of drops delivered by an agricultural nozzle and fluorescent tracer analysis of deposits.
2. Materials and methods
2.1. Test bench
A laboratory test bench was developed to record droplet impacts using high speed
shadowgraphy (Massinon and Lebeau, 2012a). It consists of a spray nozzle mounted on a linear actuator with track roller guidance system and toothed belt drive unit and moved at constant speed above a spray area using a servo-motor and controller. A constant pressure was applied to the fluid using a pressurised vessel and controlled using a pressure gauge
measurement at the nozzle level. A high speed camera (Y4 CMOS, Integrated Design Tools) records the droplet impacts on the target at 20,000 frames per second using backlighting to maximise the contrast and allow a good identification of drop impacts. A LED lighting (19-LED Constellation, Integrated Design Tools) with a beam angle of 12.5° was placed 500 mm behind the target surface to provide both high illumination and uniform background to the images. The lighting was used in a pulsed mode and triggered by the image acquisition. The optical system (12× zoom system, Navitar) offers a working distance of 341 mm and
11.47 µm pixel−1 spatial resolution. A background correction was performed before tests with embedded camera software (Motion Studio, Integrated Design Tools) to provide a homogeneous image. A signal from the controller was used to trigger the camera recording. The measurement zone was about 2 mm high by 10 mm long. A linear translation stage was used to adjust the position of the horizontal barley leaf sample in the camera focal plane. In this configuration, drop size and velocity can be measured just before impact using image analysis and impact outcome observed. Leaves excised longitudinally 3 mm wide were fixed horizontally using tape between the two arms of a U-shaped bracket. Only the central part of the leaf samples (10 mm long) located between the arms and not laying on any support were used for imaging and chemical analysis. The leaf was fixed without stretching, free to bend between the fixation points. As consequence, airflow is similar to the one encountered by a horizontal leaf. Droplets missing the leaf were not considered.
2.2. Image analysis and data processing
In this step, velocities and sizes of impacting droplets are computed by a Particle Tracking Velocimetry Sizing (PTVS) Matlab algorithm developed by Massinon and Lebeau (2012a). The impact type and the splashing proportions retained by the leaf are determined by the operator. No rebound on initial impact either sticking or no sticking (Wenzel or Cassie– Baxter regime) was counted as adhesion; fragmentation with no visual evidence of a part of the droplet remaining on the surface where it impacted was counted as splashing in the Cassie–Baxter regime, while partial rebound and partial splashing leaving evidence of the droplet where it impacted is considered partial fragmentation in the Wenzel regime; complete rebound was counted as rebound in the Cassie–Baxter regime; the droplets that were not suited to computer processing because of field of view limitation – the border of some big droplets touching the edge of the image – were processed by the operator on the basis of a manual determination of the droplet centre and diameter and added to the results tables. Because of evaporation, fluorescein concentrations in drops increase before impact depending on drop diameter and ambient conditions. Therefore, initial diameter is needed to determine
the fluorescein quantity impacting the leaf on the basis of initial fluorescein concentration in the spray mixture. Initial drop sizes were calculated in a Matlab algorithm on the basis of the evaporation model developed by Guella et al. (2008) using the measured diameter 50 cm below the nozzle as input. Initial exit velocity from the nozzle was set at 15 m/s, and ambient conditions of the spray chamber were measured to take into account the experimental
conditions and properly compute the initial droplet diameter.
2.3. Trials
Trials were performed using a Teejet XR11003VK nozzle at 0.2 MPa, 0.96 l/min, typically producing a fine to medium spray covering the 50–600 µm range of drop diameters. The nozzle was moved at 2 m/s, corresponding to 160 l/ha application rate for 50 cm nozzle spacing. Three spray mixtures were tested:
- Tap water + 1% mass natrium fluorescein,
- Tap water + 0.1% Vol/Vol Break Thru S240® (Evonik Industries AG, Essen, Germany) + 1% mass natrium fluorescein,
- Tap water + 0.25% Vol/Vol Li-700 (350 g/l Soyal phospholipids 350 g/l propionicacid, United Agri Products Inc), +1% mass natrium fluorescein.
Sprays were performed on the test bench at 18 °C temperature and 40% relative humidity. Ten sample slices 10 mm long, 3 mm wide excised from barley leaves were sprayed for each tank mix tested. The barley was grown indoor at 23 °C under Metal Halide lamps at
200 µmol m−2 s−1 on expanded clay pebbles using hydroponic nutritive solution. High speed shadowgraphy videos of spray impacts were recorded for image analysis. Each leaf sample sprayed was transferred in 20 ml of K2HPO4 (8.71 g/l) solution and kept in a dark refrigerated
box until analysis. Each solution was analysed using a spectrophotometer (RF-1501,
Shimadzu Corporation) at 460 nm excitation wave length and 540 nm emission wave length in order to quantify the spray mixture retained by the leaf samples. A calibration curve was performed for each spray mixture as adjuvants influence fluorometry measurements.
3. Results and discussion
3.1. Observed impact outcomes
Fig. 2a–c presents the impact outcomes observed using the high speed imaging for the three spray mixtures. The diagrams are in a log–log scale for a clear representation of the wide drop size and speed. In such a graph, a constant Weber number corresponds to a straight line with a −0.5 slope. The Weber number was computed for all formulations as ρV2D/σ with ρ the fluid density, V the drop velocity, D the drop diameter, σ water static surface tension (72.2 mN/m). Eleven water Weber number energy classes separated by a 3 times increase of Weber number transition lines are shown on the graphs. The first limit was set to a 0.02 Wb number. This way, an energy scale that depends only on the physical parameters of the drops is created.
Fig. 2.
Impact outcomes extracted from 10 trials: adhesion, rebound, fragmentation in Cassie–Baxter regime, fragmentation in Wenzel regime - as a function of drop speed and diameter on horizontal barley leaf slice, Teejet XR11003VK, 0.2 MPa, 50 cm height, 2 m/s forward speed; a) Water, b) Water - Break Thru S240 0.1% v/v, c) Water
- Li 700 0.25% v/v; inner Y-axis labels refer to the water Weber Number energy classes bordered by tilted dashed lines.
In trials with water (Fig. 2a) four different impact outcomes are observed. Adhesion is the only outcome for lower energy impacts (Weber energy classes 1 and 2 on the graph). For droplets as small as 150 µm and as slow as 0.3 m s−1 up to 300 µm and 4 m s−1 (Weber energy classes 3 to 8 on the graph), we observe a coexistence of drop adhesion and bouncing on a wide range of situations. This behaviour is clearly not what is expected if a clear
transition between adhesion and bouncing is stated. On some species such as barley, the high variability of the leaf surface results in a coexistence of both behaviours over a wide range of impact energies. This behaviour is usually taken into account using either a logistic regression in empirical models (Forster et al., 2005) or on the basis of advancing and receding angles for process-driven ones (Mercer et al., 2010). For diameters and speeds of about 300 µm and 4 m/s range corresponding approximately to Weber energy class 9, splashing appears in both Cassie–Baxter and Wenzel wetting regime as well as adhesion and rebound. For higher speed and diameters, corresponding to Weber energy class 11, only splashing, mainly in Wenzel regime occurs resulting in considerable pinning fragmentation. The observed behaviour is clearly not a simple transition at a fixed threshold. Some plants such as black-grass
[Alopecrus myosuroides HUDS. (ALOMY)] for instance present a much clearer transition between the different possible impact outcomes (Massinon et al., 2012). The coexistence of bouncing and adhesion may be related to the low high variability of contact angles at the scale of drops for the adaxial barley leaf surface, as observed by Mercer et al. (2010). The same coexistence has been observed for outdoor grown winter wheat (Massinon and Lebeau,
2012b). The splashing in the Wenzel regime is prevalent for the same reason. When the Break Thru S240 is added to the solution (Fig. 2b), rebound disappears up to drops of about 300 µm and 3 m s−1, corresponding to energy class 8. This behaviour is the result of the low dynamic surface tension of this super-spreader organosilicone adjuvant. The bouncing outcomes are not observed anymore under this limit on this very difficult-to-wet surface, confirming the still poorly understood high superwetting efficacy of this superspreader (Venzmer, 2011). The Cassie Baxter regime is seldom observed in Weber energy class 9, with little bouncing and only a single splash observed.
Fig. 2c presents the results for Li 700, a more traditional adjuvant and that appears a less efficient wetting agent at the timescale of drop impact. The effect on the adhesion-rebound transition is therefore limited to about 200 µm, 0.7 m/s drops corresponding approximately to energy class 5/6, offering a significant increase comparatively to water but far from Break-thru S240 performance. However, splashing in Cassie–Baxter regime disappears, what may be linked to the increase of the contact surface with the drop diameter. Fig. 3a–c present the relative volumetric percentage for each impact outcome depending on eleven energy classes for the three spray formulations. These histograms typically summarize the information extracted by high speed imaging in a convenient form that offers a statistical view of droplet behaviours as a function of energy class for a spray formulation/surface combination. Such histograms could be used when modelling the capture of spray by the canopy. It is also very clear that the modification of the fragmentation threshold by surface active adjuvants is of a much lower importance than for the adhesion-bouncing transition. In addition, the volumetric percentages in each energy class are represented in histograms (+). This information coupled with the impact outcome determines the retention in the field. The final retention is therefore a sum of all the volumes in each impact outcome weighted by the relative volume proportion of each energy class. On Fig. 3a–c, it can be seen that the major part of the spray is located
within the energy classes 10 and 11, proving the magnitude of errors in neglecting the fraction of droplet pinned on the surface during an impact.
Impact outcomes volumetric percentage as a function of Weber energy class on horizontal barley leaf slice - adhesion, rebound, fragmentation in Cassie–Baxter regime, fragmentation in Wenzel regime, + volume percentage in this class - a) Water, b) Water Break Thru S240 0.1% v/v, c) Water Li 700 0.25% v/v.
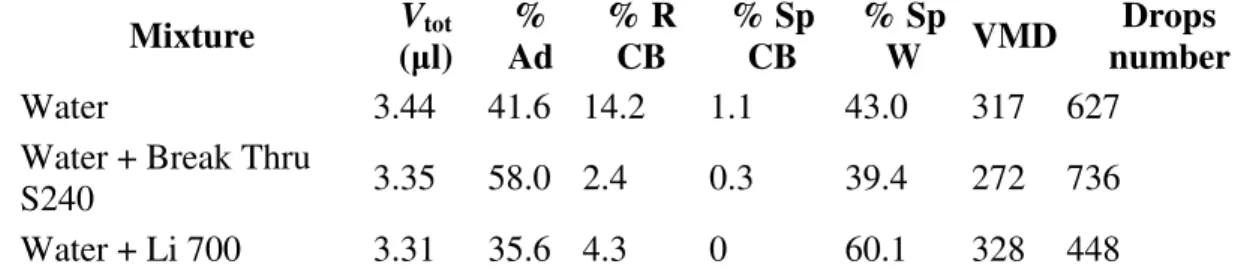
Table 1 presents some average parameters observed during the trials for the three spray formulations. As expected, the total volume of drops (Vtot) measured for 10 trials immediately before spray impact is very similar between formulations because the same application rate was used. A mean of 115 l ha−1 was observed below the nozzle on the target, which is notably below the theoretical 160 l ha−1 that would be expected if adjacent nozzles were present at 50 cm interval. Table 1 also offers a quantitative view of the effect of adjuvant used for this nozzle setting. As expected, comparatively to water, the Volumetric Median Diameter (VMD) is lower when Break Thru is used and increased for Li 700 (Butler Ellis et al., 1997; Holloway et al., 2000 and Butler Ellis and Tuck, 1999). The number of drop impacts on the surface is modified accordingly, as a lower VMD leads to a higher droplet number. The volumetric proportions of impact outcomes are modified. Adhesion percentage (% Ad) is increased for Break Thru while reduced for Li 700. This last result may not be intuitive at first sight but is explained by the VMD increase. Rebound proportion (% R CB) is highly reduced by both adjuvants. Cassie–Baxter splashing (% Sp CB), already scarce for water on this surface, almost disappears. Wenzel splashing (% Sp W) is greatly increased for Li 700 while reduced for Break-Thru as a consequence of the VMD modification. As a consequence, 39–60% of the spray volume observed at impact on the barley leaf for common nozzle and adjuvants are splashing in the Wenzel regime.
Table 1.
Total volume (Vtot), Volumetric percentage of the spray outcome for impacting
droplets on horizontal barley leaves; adhesion (%Ad), rebound in Cassie–Baxter regime (% R CB), splashing in Cassie–Baxter regime (% Sp CB), splashing in Wenzel regime (%SpW) and characteristics of sprays; Volumetric Median diameter (VMD), drop number as a function of tank formulations.
Mixture Vtot (µl) % Ad % R CB % Sp CB % Sp W VMD Drops number Water 3.44 41.6 14.2 1.1 43.0 317 627
Water + Break Thru
S240 3.35 58.0 2.4 0.3 39.4 272 736
Water + Li 700 3.31 35.6 4.3 0 60.1 328 448
3.2. Retention observed by shadowgraphy and measured by
spectrophotometry
The question that arises is what proportion of the spray mixture stays on the target from pinning fragmentation, also referred to as splash in the Wenzel regime. To address this issue, sodium fluorescein deposits on leaf samples observed by shadowgraphy were quantified by spectrophotometry. From Table 2 results, it appears that adhesion accounts only for a fraction of retention as the retention volume measured by fluorometry (VF) is always higher than the volume that adheres at impact (V Ad). A variable fraction of the volume of drops splashing in the Wenzel regime should be added to reach the measured deposits. Indeed, high speed
imaging records show that a variable proportion of the partially fragmented drop stays at the impact location. In some cases, the measurement of fluorescence slightly exceeds the total volume seen impacting, which may result from measurement uncertainties or unintended contamination of the leaf samples.
Table 2.
Retention volume of the different impact types using shadowgraphy and deposits measured by spectrophotometry for the three spray mixtures.
Spraying Vtot (µl) V Ad (µl) V RCB (µl) V Sp CB (µl) V Sp W (µl) VF(µl)
Tap water and sodium fluorescein tank mix
1 0.345 0.055 0.144 0.000 0.146 0.124 2 0.379 0.194 0.015 0.000 0.171 0.289 3 0.311 0.27 0.014 0.000 0.028 0.292 4 0.335 0.188 0.005 0.000 0.142 0.286 5 0.448 0.142 0.078 0.000 0.228 0.294 6 0.401 0.052 0.055 0.030 0.264 0.088 7 0.189 0.075 0.065 0.009 0.040 0.087 8 0.298 0.192 0.023 0.000 0.083 0.262 9 0.189 0.045 0.063 0.000 0.082 0.068 10 0.542 0.216 0.030 0.000 0.295 0.396 Average 0.344 0.143 0.049 0.004 0.148 0.219 Std. dev. 0.108 0.081 0.042 0.010 0.092 0.115 Tap water, Break Thru and sodium fluorescein tank mix
1 0.266 0.188 0.001 0.000 0.076 0.270 2 0.414 0.192 0.017 0.000 0.205 0.266 3 0.276 0.208 0.000 0.000 0.068 0.257 4 0.304 0.155 0.000 0.000 0.149 0.294 5 0.470 0.201 0.035 0.000 0.234 0.364 6 0.400 0.254 0.000 0.009 0.136 0.282 7 0.213 0.176 0.000 0.000 0.037 0.206 8 0.364 0.236 0.026 0.000 0.103 0.307 9 0.393 0.241 0.000 0.000 0.152 0.264 10 0.252 0.093 0.000 0.000 0.159 0.196 Average 0.335 0.194 0.008 0.001 0.132 0.271 Std. dev. 0.084 0.047 0.013 0.003 0.062 0.048 Tap water, Li 700 and sodium fluorescein tank mix
1 0.351 0.211 0.000 0.000 0.140 0.300
2 0.349 0.168 0.017 0.000 0.164 0.202
3 0.452 0.103 0.023 0.000 0.326 0.342
4 0.282 0.059 0.024 0.000 0.199 0.142
Spraying Vtot (µl) V Ad (µl) V RCB (µl) V Sp CB (µl) V Sp W (µl) VF(µl) 6 0.298 0.099 0.010 0.000 0.189 0.199 7 0.274 0.113 0.000 0.000 0.161 0.282 8 0.275 0.056 0.029 0.000 0.190 0.086 9 0.215 0.121 0.025 0.000 0.069 0.160 10 0.384 0.132 0.007 0.000 0.246 0.200 Average 0.331 0.118 0.014 0.000 0.199 0.221 Std. dev. 0.076 0.046 0.011 0.000 0.077 0.081 Table 3 was constructed from visual estimation of the retained fraction of each partially fragmented drop in Wenzel regime. The estimated percentage for each trial (%SpW Rt) and spray mixture is used to estimate the retention, by addition of then volume that adheres with the fraction splashing in the Wenzel regime. A comparison using the ratio (VF/RetP) between the measured retention using spectrophotometry and estimated retention using this method is performed. Although the ratio diverges unexpectedly from one in some cases, it is remarkable that the average of this parameter is very close to unity, as expected. The retained fraction of the partially fragmented drop in the Wenzel regime is the lowest for water at 45%, a bit higher for Li 700 at 48% and at 58% for Break Thru.
Table 3.
Contribution of partial fragmentation in the Wenzel regime to retention by barley leaves for the three tank formulations.
Water Water + Break Thru Water + Li 700
Spraying
%SpW Rt VF/RetP %SpW Rt VF/RetP %SpW Rt VF/RetP
1 44.4 1.03 66.8 1.12 56.4 1.04 2 71.9 0.91 42.0 0.96 39.0 0.87 3 14.4 1.07 67.3 1.01 68.1 1.05 4 38.0 1.18 70.5 1.13 32.7 1.15 5 48.2 1.17 63.7 1.04 50.8 1.07 6 29.8 0.67 36.5 0.92 74.3 0.83 7 5.0 1.13 30.0 1.10 45.3 1.52 8 83.9 1.00 46.6 1.08 43.4 0.62 9 57.0 0.75 91.4 0.70 36.2 1.10 10 62.4 0.99 70.2 0.96 37.0 0.90 Average 45.5 0.99 58.5 1.00 48.3 1.01 Std. dev. 24.75 0.17 19.00 0.13 14.05 0.24
These observations confirm that pinning fragmentation is not a negligible component of retention, that in our trials accounted for 35% of retention for tap water, 46% for Li 700 mixture and 28% for Break Thru. The differences between mixtures are highly correlated with VMD because of the effect of this parameter on the proportion of different impact behaviours.
In conclusion, different drop behaviours during impact have long been identified in crop protection, and dimensional analysis has been applied to find relevant parameters such as the Weber number (Lake and Marchant, 1983). On this basis models have been developed to calculate the capture of pesticides by the canopy on the basis of the droplet, spray formulation and leaf water repellency characteristics (Cox et al., 2000). However, adhesion has been considered the only contributor to spray retention in most studies. In recent works Mercer et al. (2010) have developed a physical model of retention based on drop behaviour as a function of the energy balance during impact, taking into account shattering. However, the authors considered that during the spreading phase, the droplet breaks into smaller droplets that leave the leaf, a typical Cassie–Baxter regime.
Forster et al. (2012) have presented a physical process based retention model that has been implemented within an experimental build of the spray application simulation software AGDISP using a similar hypothesis, considering the recapture of secondary droplets by the same leaf. Simulations performed on wheat, which presents a very similar leaf surface to barley, are in good agreement with retention measurements. However, it is possible that on an advanced target growth stage the overall error in predicted retention may be minimized due to secondary drops being predicted to intercept and be retained. However, on small plants, a typical stage for weeding, the errors in overall retention could be higher because of reduced chance of secondary interception. Observations prove that neglecting the occurrence of partial splash in the Wenzel wetting regime may account for a significant underestimation of
retention at interception, as about 50% of the drop volume has been found to remain on the leaf. The effect may be even higher when modelling the retention of low drift nozzles because of the larger droplets produced that are more likely to fragment at impact. Another
phenomenon that is often neglected in state of the art retention models is the coexistence of different impact behaviours for the same energy level. Logistic regression curve based on experimental data should be preferred to fixed threshold between the different outcomes. Experimental methods based on high speed imaging (Massinon and Lebeau, 2012a) may contribute to the ultimate goal of highly accurate process-driven retention models as realistic phase diagrams of impact behaviour are obtained for more spray-mixture/leaf combinations this way.
Acknowledgements
The work was performed thanks to the funding from the Higher Education and Scientific Research Ministry of People's Democratic Republic of Algeria.
References
Butler Ellis et al., 1997: M.C. Butler Ellis, C.R. Tuck, P.C.H. Miller, The effect of some adjuvants on sprays produced by agricultural flat fan nozzles, Crop Prot., 16 (1997), pp. 41– 50
Butler Ellis and Tuck, 1999: M.C. Butler Ellis, C.R. Tuck, How adjuvants influence spray formation with different hydraulic nozzles, ., 18 (1999), pp. 101–109
Butler Ellis et al., 1999: M.C. Butler Ellis, C.R. Tuck, P.C.H. Miller, How surface tension of surfactant solutions influences the characteristics of sprays produced by hydraulic nozzles used for pesticide application, Coll. Surf., 180 (1999), pp. 267–276
Cassie and Baxter, 1944: A.B.D. Cassie, S. Baxter, Wettability of porous surfaces, Trans. Faraday Soc., 40 (1944), pp. 546–551
Cox et al., 2000: S.J. Cox, D.W. Salt, B.E. Lee, M.G. Ford, A model for the capture of aerially sprayed pesticide by barley, J. Wind Eng. Ind. Aerodyn., 87 (2000), pp. 217–230 Forster et al., 2005: W.A. Forster, M.O. Kimberley, J.A. Zabkiewicz, A universal spray droplet adhesion model, Trans. ASAE, 48 (4) (2005), pp. 1321–1330
Forster et al., 2010: W.A. Forster, G.N. Mercer, W.C. Schou, Process driven models for spray droplet shatter, adhesion or bounce, Proc. 9th Int. Symp. Adj. Agrochem (2010), pp. 277–285 Forster et al., 2012: W.A. Forster, G.N. Mercer, W.C. Schou, Spray droplet impaction models and their use within AGDISP software to predict retention, N. Z. Plant Prot., 65 (2012), pp. 85–92
Forster et al., 2013: W.A. Forster, W.C. Schou, G.N. Mercer, Evaluation of a Modified AGDISP Model to Predict Spray Canopy Retention. Proc. ISAA 2013 (2013), pp. 301–309 Foz do Iguaçu, Brazil April 22–26, 2013
Furmidge, 1962: C.G.L. Furmidge, Physico-chemical studies on agricultural sprays IV, the retention of spray liquids on leaf surfaces, J. Sci. Food Agric., 13 (1962), pp. 127–140 Massinon and Lebeau, 2012a : M. Massinon, F. Lebeau, Experimental method for the assessment of agricultural spray retention based on high-speed imaging of drop impact on a synthetic superhydrophobic surface, Biosyst. Eng., 112 (1) (2012), pp. 56–64
Massinon and Lebeau, 2012b: M. Massinon, F. Lebeau, Comparison of Spray Retention on Synthetic Superhydrophobic Surface with Retention on Outdoor Grown Wheat Leaves, Int. Adv. Pest. Ap.: Asp. Appl. Biol., vol. 114Association of Applied Biologists, Warwick, UK (2012), pp. 261–268
Massinon et al., 2012: M. Massinon, H.H. Boukhalfa, P. Marechal, F. Lebeau, The Effect of Leaf Orientation on Spray Retention on Blackgrass, Proc. 11th Int. Conf. Precision
Agriculture (2012) Indianapolis, USA
Massinon and Lebeau, 2013: M. Massinon, F. Lebeau, Review of physicochemical processes involved in agrochemical spray retention, Biotechnol. Agron. Soc. Environ., 17 (3) (2013), pp. 494–504
Mercer et al., 2010: G.N. Mercer, W.L. Sweatman, W.L. Forster, A model for spray droplet adhesion, bounce or shatter at a crop leaf surface,Math. Ind., 15 (2010)
Nairn et al., 2013: J.J. Nairn, W.A. Rorster, Van leeuwen, ‘Universal’ spray droplet adhesion model – accounting for hairy leaves, Weed Res. (2013) http://dx.doi.org/10.1111/wre.12039 pp. 11
Rioboo et al., 2008: R. Rioboo, M. Voué, A. Vaillant, J. De Coninck, Drop impact on porous superhydrophobic polymer surfaces, Langmuir, 24 (24) (2008), pp. 14074–14077
Stock, 1997: D. Stock, Do we need adjuvants? Mechanistic studies and implications for future developments, Proc. 50th N.Z. Plant Prot. Conf. (1997), pp. 185–190
Taylor, 2011: P. Taylor, The wetting of leaf surfaces, Curr. Opin. Coll. Interface Sci., 16 (4) (2011), pp. 326–334
Venzmer, 2011: J. Venzmer, Superspreading – 20 year of physichochemical research, Curr. Opin. Coll. Interface Sci., 16 (4) (2011), pp. 335–343
Wang and Liu, 2007: C.J. Wang, Z.Q. Liu, Foliar uptake of pesticides-present status and future challenge, Pestic. Biochem. Physiol., 87 (2007), pp. 1–8
Wilson, 2003: M. Wilson, Optimising Pesticide Use, 0-471-49075-XJohn Wiley and Sons Ltd, England (2003)
Wirth et al., 1991: W. Wirth, S. Storp, W. Jacobsen, Mechanisms controlling leaf retention of agricultural spray solutions, Pestic. Sci., 33 (4) (1991), pp. 411–420
Zabkiewicz, 2007: J.A. Zabkiewicz, Spray formulation efficacy - holistic and futuristic perspectives, Crop Prot., 26 (2007), pp. 312–319