Article Title
Data on elemental concentrations in marine sediments from the South and South West of England.
Authors
Jonathan Richir1,2, 3,+, Simon Bray4,5, Tom McAleese, Gordon J. Watson1,+
Affiliations
1 Institute of Marine Sciences, School of Biological Sciences, University of Portsmouth, Ferry Road,
Portsmouth, PO4 9LY, UK
2 Chemical Oceanography Unit, FOCUS, University of Liège, Liège, Belgium 3 Laboratory of Oceanology, FOCUS, University of Liège, Liège, Belgium
4 AQASS Ltd, Hound Road, Southampton, SO31 5QA, UK
5 School of Biological Sciences, Life Sciences Building 85, University of Southampton, SO17 1BJ,
United Kingdom
+ Authors equally contributed to this study
Corresponding author(s)
jonathan.richir@uliege.be, gordon.watson@port.ac.uk
Abstract
The present Data In Brief methodological paper details the acquisition, mining and pre-processing of elemental concentration data in marine sediments (coastal and open sea) of Southern England, presented and discussed in the co-submitted Environment International paper entitled: “Three decades of trace element sediment contamination: the mining of governmental
databases and the need to address hidden sources for clean and healthy seas” [1]. Elemental sediment concentration data were obtained from the two main UK environmental sources, i.e. the Environment Agency (EA) and the Marine Environment Monitoring and Assessment National database (MERMAN) managed by the British Oceanographic Data Centre (BODC). The merged database is the result of a rigorous data selection-validation process and provides spatially and temporally extensive records of arsenic (As), cadmium (Cd), chromium (Cr), copper (Cu), iron (Fe), mercury (Hg), nickel (Ni), lead (Pb) and zinc (Zn) concentrations for hundreds of sites over 31 years (1983-2013). More spatially and temporally limited records of manganese (Mn), aluminium (Al), lithium (Li), tin (Sn) [and tributyltin, TBT], barium (Ba), antimony (Sb), boron (B), calcium (Ca), molybdenum (Mo), cobalt (Co), selenium (Se), potassium (K), magnesium (Mg), beryllium (Be), vanadium (V), titanium (Ti), sodium (Na), silver (Ag), thallium (Tl) and strontium (Sr) are also included. The full secondary database is hosted in the Mendeley Data repository and the geo-spatial information to map sites is given in supplementary files to the paper. To provide end-users with the relevant context on spatial and temporal coverage, monitoring statistics are given for the nine trace elements (TEs). Site-specific statistics include: the first and last year of sediment monitoring, the number of years monitored, and minimum, maximum, mean and median numbers of years monitored. Also given are summary data on the number of sites monitored each year, from the first records from 1983 to 2013. For the nine TEs (total and strong acid digestion techniques are considered separately for Cr and Fe), monitoring statistics are presented separately for coastal and open sea sites. Data are relevant to diverse end-users to assess the local and regional contaminant loads and to contextualize anthropogenic threats to benthic systems in multiple locations from the, French/English Channel, southern North and Celtic Seas.
Keywords
trace element, heavy metal(loid), sediment, public data repository, data mining, benthic, anti-fouling, shipping
Specifications Table
Subject Environmental Science – Pollution
Specific subject area Analysis of elemental concentration data from public repositories to assess the contamination in marine sediments.
Type of data Figure Table Database
How data were acquired Data on sediment elemental concentrations were acquired from the Environment Agency and the British Oceanographic Data Centre.
Data format Analyzed
Filtered
Secondary data
Parameters for data collection
Only data provided by the two UK key public repositories identified were included in the analysis and processing stages.
Description of data collection
Coastal and open sea monitoring data recording sediment sample elemental concentrations were requested from two key UK public repositories: a) the Environment Agency (EA) and b) the MERMAN database managed by the British Oceanographic Data Centre (BODC). Files were requested for sediment elemental concentration data for all UK marine waters (BODC, .xls(x) extension files); and
from the two regions South England and South-West England (EA, .mdb extension files).
Data source location Principal data sources are hosted by the Environment Agency and the British Oceanographic Data Centre.
Data accessibility The database is hosted in the Mendeley Data repository (http://dx.doi.org/10.17632/m68k63nnk3.1).
Related research article Richir J., Bray, S., McAleese T., Watson, G.J., 2021. Three decades of trace element sediment contamination: the mining of governmental databases and the need to address hidden sources for clean and
healthy seas. Env. Intern. 149, 106362.
https://doi.org/10.1016/j.envint.2020.106362.
Value of the Data
• The database provides spatially and temporally extensive records of arsenic (As), cadmium (Cd), chromium (Cr), copper (Cu), iron (Fe), mercury (Hg), nickel (Ni), lead (Pb) and zinc (Zn) concentrations in sediments from coastal and open sea sites for 320 UK sites over 31 years.
• Spatially and temporally limited records of manganese (Mn), aluminium (Al), lithium (Li), tin (Sn) [and tributyltin (TBT)], barium (Ba), antimony (Sb), boron (B), calcium (Ca),
molybdenum (Mo), cobalt (Co), selenium (Se), potassium (K), magnesium (Mg), beryllium (Be), vanadium (V), titanium (Ti), sodium (Na), silver (Ag), thallium (Tl) and strontium (Sr) represent approximately 13% of the full database (334 UK sites when considering the twenty-nine chemicals).
• The database can be used to assess the contaminant load for specific sites, but also to strengthen and target current and future legislative control measures for anthropogenic inputs.
• Sediment contamination assessment is necessary to understand potential anthropogenic
threats and subsequently for managing contaminant impacts upon benthic habitats and trophic bioaccumulation at local, regional and national levels.
• Information published in this paper is relevant to marine ecotoxicologists, coastal ecologists (practitioners, scientists and policy makers) and government decision makers.
Data Description
The secondary data linked to this article and hosted in the Mendeley Data repository http://dx.doi.org/10.17632/m68k63nnk3.1) provide a summary of >45,000 contaminant concentration data points for twenty-nine marine sediment chemicals from 334 Southern England (UK) sites (Fig. 1, sites within the English/French Channel and the southern North and Celtic Seas), covering a survey period of 31 years (1983-2013). The geo-spatial information contained in geographic data files (.kml extension files, Suppl. File 1) enables end-users to directly visualize and select sites of interest from their geolocalisation on Google Earth (Google LLC). The data were obtained from two UK key public repositories - the Environment Agency (EA), and the MERMAN (ME) database managed by the British Oceanographic Data Centre (BODC) and were subjected to a rigorous selection-validation process. That process is fully described in the Experimental Design, Materials and Methods section of this paper. The secondary data (.csv extension file) have been organized and labelled for interrogation and searching by end-users. Hereafter are given explanations with regard to interpreting the content. The first variable is the Southern England sampling ‘Area’, the second a single number-letter code for each site (‘SITEnb_db’), then ‘Latitude’ and ‘Longitude’ coordinates (WGS84). These are followed by the
sampling ‘Location’: either a coastal site (i.e. in transitional, estuarine and coastline waters) or an open sea site (distant/remote from the coastline). With regard to the ‘SITEnb_db’ variable, it has no specific significance except for the _EA or _ME component, indicating the original source, i.e. EA or MERMAN database. The ‘Site Name’ variable is the full site name from the original database (this could be useful for local studies). After the sampling ‘Date’ comes the ‘Dete. Desc.’, the determinand descriptor variable from the original database (‘ME’ character string added for MERMAN determinand descriptors). This variable enables end-users to select data according to the chemical and the related sample processing technique, e.g. grain size fraction used (e.g., <2000 µm or <63 µm) or digestion method (e.g. total hydrofluoridric acid specified for EA data). From the categorized data, summary statistics are presented in Tables 1 and 2. The last variables are the ‘Chemical’ name, the concentration or value of the analytical detection limit (DL) when lower [‘Result (ppm, <DL)’], and the concentration with the values under the DL replaced by half of it [2] [‘Result (ppm)’].
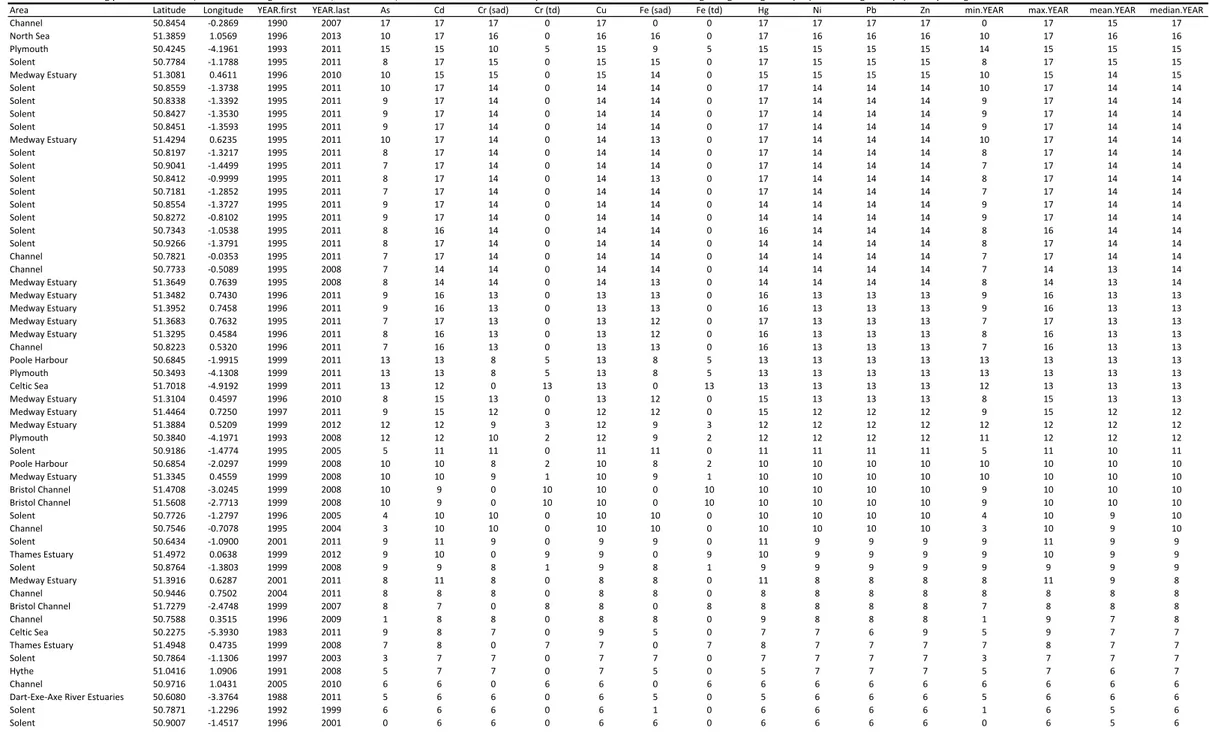
The overall aim of this paper is to give ecotoxicologists, coastal ecologists (practitioners, scientists and policy makers) and government decision makers a ready-to-use .csv database detailing elemental composition of sediments (http://dx.doi.org/10.17632/m68k63nnk3.1), useful for local, regional and global case studies. The data for nine trace elements (TEs; As, Cd, Cr, Cu, Fe, Hg, Ni, Pb and Zn), represent 87% of the database and all (except Fe) included on the US EPA priority pollutant list [3]. The nine TEs have on average 4,434 ± 607 SD sedimentary - silt and clay [4] - measurements from 320 of the 334 sites. In addition, data detailing 20 supplementary elements (Mn, Al, Li, Sn [including tributyltin (TBT)], Ba, Sb, B, Ca, Mo, Co, Se, K, Mg, Be, V, Ti, Na, Ag, Tl and Sr) are included. To provide end-users with the relevant context on spatial and temporal coverage, monitoring statistics are given for the nine TEs in Table 1. These include the first and last year of sediment monitoring, the number of years monitored, and summary statistics showing minimum, maximum, mean and median numbers of years monitored. Statistics are given separately for coastal (Table 1.A) and open sea (Table 1.B) sites. Two columns for Fe and Cr are included because the extraction effiency differs according to the technique used [total fluoridric (td) or strong acid (sad) digestion, see Experimental Design, Materials and Methods section for details]. Statistics on the number of sites monitored for six years and more are given
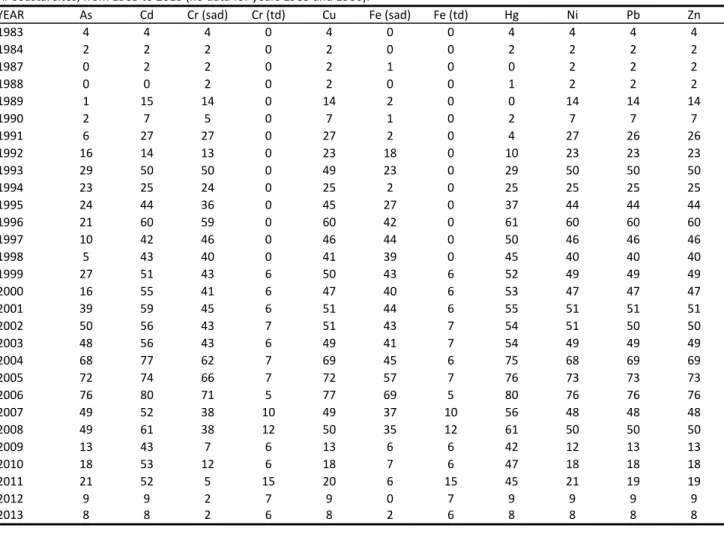
for each of the nine TEs (Table 1.C). Table 1 also contains site geographic coordinates and their regional location (Area). Table 1, used in conjunction with the map of the sites (Suppl. File 1), allows for site identification and elements for which the monitoring effort was greatest, without having to analyze the complete .csv database. Finally, Table 2 gives, for each of the nine TEs (td and sad techniques considered separately for Cr and Fe), the number of sites monitored per year, from the first 1983 records to 2013. Statistics are given separately for coastal (Table 2.A) and open sea (Table 2.B) sites. There were no Southern England coastal sites monitored for sediment elemental concentrations for years 1985 and 1986 (and globally few sites for years 1983 to 1990; Table 2.A); and open sea sites were monitored mainly in the years 2008, 2009 and 2012 (Table 2.B).
Experimental Design, Materials and Methods
1. Mining public databases
1.1. Database selection and data processing
UK coastal monitoring data on elemental concentrations in sediment samples are held in two key public repositories: a) the EA and b) the MERMAN database managed by the BODC under the Clean Safe Seas Environmental Monitoring Programme (CSEMP) [5]. From these a merged EA-MERMAN database focused on the Channel, southern North and Celtic Seas was generated [using Microsoft Excel (Microsoft Corporation, US), R [6] in RStudio [7] and Google Earth (Google LLC)]. Based on detailed lists of the ‘Determinands’ sent by the BODC (e.g., ‘chromium’, ‘mercury’) and ‘Determinands’ (e.g. ‘Arsenic, <63 µm : Dry Wt’, ‘Cadmium : HF Digest : Dry Wt’) and ‘Sample Point Types’ (e.g. ‘saline water - estuarine sites - non bathing/shellfish’, ‘miscellaneous environment – sediments’) sent by the EA, elementary concentration data: i) for all UK marine waters from the BODC; and ii) from the two regions South England and South-West England from the EA were requested.
Data stored in the MERMAN database are dedicated to marine waters only (coastal and open sea waters) from 1999 onwards. They were provided as a list of files (.xls(x) extension files), each corresponding to one year of sediment monitoring with a unique ‘Determinand Full Name’ per element. Georeferenced MERMAN sites (WGS84 coordinates) were projected on to maps (Google Earth projection, Google LLC) and subsampled northwards from the Celtic Sea to the Bristol Channel and Thames Estuary. To one site there corresponded several georeferenced sampling points, resulting in multiple close coordinates for the same location. These multiple coordinates were averaged so that each site only corresponded to a unique geolocation. The resulting secondary MERMAN dataset for Southern England contained sediment concentration data of thirteen TEs: Al, As, Cd, Cr, Cu, Fe, Pb, Li, Mn, Hg, Ni, V and Zn from 95 sites, for a total of 12,540 data points.
The two South and South West England datasets sent by the EA (codes SO and SW, held in one dataset separated by region [.mdb extension files]) contained elemental concentration data from the mid-1980s. To avoid losing any data along the transition from estuarine to coastal water continuum, both inland and marine site data were requested. Georeferenced EA sites were projected on to maps (Google Earth), after coordinate transformation from OSGB36 format to WGS84 for ease of use with Google Earth and ArcGis (Esri, Redlands, CA). Only sites in transitional, estuarine and coastal waters were considered; i.e. all sites under marine and tidal influence (terrestrial and freshwater sites were discarded). We considered that geographic coordinates of EA-sampled sites were correct, since we selected sites according to their geographic position; although in earlier sampling years, site coordinates corresponded sometimes/often to the highest point of the tide on the shoreline. Nowadays, EA site coordinates correspond to sampling locations within water bodies (EA, C. Ashcroft pers. com.).
Early EA records preceded computer-recording processes, which sometimes resulted in a mismatch of sample material codes with more recent records. We, therefore, selected EA data as follows. Each data, for previously georeferenced selected sites only, had a unique material description identifier, or ‘MATERIAL_DESC’. EA data with a ‘MATERIAL_DESC’ related to sediments: ‘ESTUARY SEDIMENT’, ‘ESTUARY SEDIMENT - <63UM FRACTION’, ‘COASTAL / MARINE SEDIMENT’, ‘RUNNING SURFACE WATER SEDIMENT - <63UM FRACTION’, ‘RUNNING SURFACE
WATER SEDIMENT’, ‘ESTUARY SEDIMENT - INTER TIDAL’, ‘ESTUARY SEDIMENT - SUB TIDAL’, ‘COASTAL / MARINE SEDIMENT - <63UM FRACTION’ and ‘ESTUARY SEDIMENT - INTER TIDAL - <63UM FRACTION’ were first selected. Limiting our request to these nine sediment identifiers, would have missed the older data for which the ‘MATERIAL_DESC’ identifier hadn't been properly encoded. Because the main objective of the co-submitted Environment International paper [1] was to investigate the temporal trend of TE contamination, additional data with material identifiers not linked to sediments were also selected. From an extended dialogue and question and answer process with the EA, we were able to select additional sediment elemental concentration data, belonging to nine supplementary ‘MATERIAL_DESC’ such as ‘UNCODED’, ‘SOIL’, ‘SEA WATER’ etc. This time consuming, but necessary, approach required checks of all selected mapped sites for concentration data that did not correspond directly to one of the sediment-related identifiers. If any doubt remained for sites and/or an elemental concentration data points, they were discarded from the final filtered EA dataset. The data filtering related to sediment identifiers only, resulted in a dataset of 30,395 data; but with the supplementary nine MATERIAL_DESC identifiers, we generated a dataset of 39,910 data, i.e. 31% larger, for twenty-nine chemicals (including the thirteen in MERMAN dataset), in 254 sites. These chemicals were: As, Cd, Cr, Cu, Pb, Hg, Ni, Zn, Fe, Mn, Al, Li, Sn (including tributyltin, TBT), Ba, Sb, B, Ca, Mo, Co, Se, K, Mg, Be, V, Ti, Na, Ag, Tl and Sr.
1.2. Generating a new database on sediment elemental concentrations for Southern England
The resulting EA and MERMAN datasets were merged into a unique EA-MERMAN database, after harmonization of the names of shared variables (e.g. latitude variable was labelled ‘X‘ in the EA dataset, ‘Sample.Latitude‘ in the MERMAN dataset). The EA dataset contained 21 variables, the MERMAN dataset 23 variables, the merged database 29 variables, subsequently in this were included three new variables created for data analysis. In particular, a new code was assigned to each site with an identifier for EA or MERMAN origin [‘SITEnb_db’ variable with a unique number/letter (‘EA‘ or ‘ME‘)]. Elemental concentration units were standardized. Some concentrations were in ppm, others in ppb or in %, with differences of units between datasets.
Some coastal sites data were also duplicated between the two EA and MERMAN datasets; these were removed, giving priority to the EA data (the time series dataset).
Once merged, the resulting EA-MERMAN database consisted of 45,962 data-points, from 334 sites, for twenty-nine chemicals over 31 years (1983-2013) of environmental monitoring. The twenty-nine chemical full database is saved in a ready-to-use .csv format for further analysis (http://dx.doi.org/10.17632/m68k63nnk3.1). For the co-submitted Environment International paper [1] we selected the nine most monitored TEs, namely Cu, Zn, As, Cd, Cr, Fe, Hg, Ni and Pb together representing 87% of data (320 sites). Subsequent data analysis for this subset is fully detailed in [1].
2. Background detail on sample processing and trace element analysis
All competent UK authorities undertaking monitoring (should) use the same programme monitoring manual, the ‘Clean Seas Environment Monitoring Programme (CSEMP) - Green Book’ [5]. Whilst, detailed information on procedural guidelines for sediment TE analysis is available in the Appendices 6 and 7 of the Green Book, we have provided relevant summary information here for context during the EA and MERMAN database usage. The shared analytical considerations of
the secondary, compiled EA-MERMAN database are the concentration unit (mg kgdw-1) and, for
the nine TEs the median detection limit values (DL, in mg kgdw-1): 0.1 for Cd, Cr (sad) and Hg, 1 for
Cu, 2 for As, 3 for Fe (sad), 5 for Ni and Zn and 8 for Pb. For TE concentrations below the analytical procedure DL, we used half the DL values [2].
2.1. MERMAN samples
Sediment TE concentration data stored in the MERMAN database are acquired following the Green Book guidelines. Briefly, sediment samples are wet or freeze-dry sieved through a nylon 63 µm mesh, and the <63 µm silt and clay fraction [4], i.e. the grain size fraction that accumulates contaminants is retained for analysis (a small minority of MERMAN sediment samples were ‘untreated’, thus removed from the analysis). A total digestion procedure, most often hydrofluoric acid (HF) digestion, is required to allow data to be normalized (e.g. to Al or Li) to facilitate inter-site comparison of anthropogenic contamination levels. A partial extraction
method is acceptable for determination of long-term trends at sites where this method has traditionally been used (see the case of the EA database below). The analytical technique chosen is not mandatory, but most laboratories now use Inductively Coupled Plasma Mass Spectrometry (ICP-MS) for TE determination. Hg can be determined by cold vapour atomic absorption spectrometry or atomic fluorescence.
2.2. EA samples
For EA samples, the protocol has evolved since the acquisition of the oldest (1980s) data. EA sediment samples were formerly wet sieved and the <90 µm fraction retained, but this was changed to the <63 µm fraction in the 1990s; a small minority of samples were sieved through a 2000 µm mesh size, thus were removed from the analysis. Sediment requiring analysis for TE contaminants would have been analysed following digestion with hot nitric acid (HNO3) or aqua
regia (sad technique). The intention would have been to maximise the extractable TE components that could be considered as bioavailable [8] in the environment. A partial extraction method is - according to the Green Book - acceptable for determination of long term trends at sites where this method has traditionally been used (see above), which was the aim of the present analysis and co-submitted [1] paper that studies TE concentration trends over time. For more recent sediment samples acquired in the framework of the CSEMP programme (see above), stored in a duplicate way between the EA and BODC databases, the digestion technique, using HF acid, is total. These data are distinguishable in the EA database by using unique ‘Determinand’ codes with reference to HF (e.g. ‘Lead: HF Digest: Dry Wt’). HF, unlike hot HNO3/aqua regia,
solubilizes TEs bound to silicate structures. We have considered hot HNO3/aqua regia and HF
digestions equivalent for Cu, Zn, As, Cd, Hg, Ni and Pb since those TEs are a small part of the sediment matrix; confirmed by comparing extraction efficiencies [9;10]. For Fe and Cr, differences in sediment extraction efficiencies were >10%, therefore, data from each extraction procedure were analysed separately. Finally, quality assurance processes also ensured there was no step-change effect for changeover of analytical technique, e.g. flame atomic absorption to ICP-MS (most laboratories); Hg would be analyzed with cold vapour technique (EA, C. Ashcroft pers. comm.).
CRediT authorship contribution statement
Richir Jonathan: Conceptualization, Data curation, Formal analysis, Investigation, Methodology, Supervision, Validation, Visualization, Writing - original draft, Writing - review & editing. Bray Simon: Methodology, Validation, Writing - review & editing. McAleese Tom: Investigation. Watson Gordon J.: Conceptualization, Funding acquisition, Investigation, Methodology, Project administration, Resources, Supervision, Validation, Visualization, Writing - original draft, Writing - review & editing.
Ethics Statement
Out of scope
Acknowledgments
The TE data were provided by the EA (C. Ashcroft) and the BODC (A. Bargery and J. Ayliffe). BODC supplied data on behalf of the Clean Safe Seas Evidence Group, collected by: a) Agri-Food and Biosciences Institute, b) Centre for Environment, Fisheries and Aquaculture Science, c) Department of Agriculture, Environment and Rural Affairs, d) Environment Agency, e) Food Standards Scotland, f) Marine Scotland Science, g) Natural Resource Wales and h) Scottish Environment Protection Agency. BODC data were funded by a), c), and the Scottish Govt. Data contain public sector information licensed under the Open Government Licence
v3.0. http://www.nationalarchives.gov.uk/doc/open-government-licence/version/3/. This
European Regional Development funded work was performed within the framework of the Channel Catchments Cluster (3C) programme.
The authors declare that they have no known competing financial interests or personal relationships which have or could be perceived to have influenced the work reported in this article.
References
[1] Richir J., Bray, S., McAleese T., Watson, G.J., 2021. Three decades of trace element sediment contamination: the mining of governmental databases and the need to address hidden
sources for clean and healthy seas. Env. Intern. 149, 106362.
https://doi.org/10.1016/j.envint.2020.106362.
[2] US EPA, Regional guidance on handling chemical concentration data near the detection limit in risk assessments. https://www.epa.gov/risk/regional-guidance-handling-chemical-concentration-data-near-detection-limit-risk-assessments, 1991
[3] US EPA, Priority pollutant list, published at 40 CFR Part 423, Appendix A. https://www.epa.gov/sites/production/files/2015-09/documents/priority-pollutant-list-epa.pdf, 2015
[4] Wentworth, C.K.A., Scale of Grade and Class Terms for Clastic Sediments. J. of Geology. 5 (1922) 377-392.
[5] Cefas, CSEMP Green Book. http://cefas.defra.gov.uk/media/510362/greenbookv15.pdf, 2012.
[6] R Core Team, R: A language and environment for statistical computing. R Foundation for Statistical Computing, Vienna, Austria. https://www.R-project.org/, 2020.
[7] RStudio Team, RStudio: Integrated Development for R. RStudio, Inc., Boston, MA. http://www.rstudio.com/, 2019.
[8] Zimmerman, A.J., Weindorf, D.C., 2010. Heavy metal and trace metal analysis in soil by sequential extraction: A review of procedures. Int. J. Anal. Chem. Article ID 387803, https://doi.org/10.1155/2010/387803.
[9] Cook, J.M., Gardner, M.J., Griffiths, A.H., Jessep, M.A., Ravenscroft, J.E., Yates, R., The comparability of sample digestion techniques for the determination of metals in sediments. Mar. Pollut. Bull. 34 (1997) 637-644. https://doi.org/10.1016/S0025-326X(96)00186-5. [10] Hall, G.E., Determination of trace elements in sediments, in: A. Mudroch, J.M. Azcue, P.
Mudroch (Eds), Manual of physico-chemical analysis of aquatic sediments, Routledge, UK, 2017, pp. 85-145.
Figure caption
Figure 1. Sites monitored between 1981 and 2013 for elemental concentrations in sediments, with zoom of four large estuary systems of the southern coast of England (UK): A) Falmouth Bay, B) Plymouth Sound, C) Poole Harbour and D) the Solent. Data were requested from the Environment Agency (EA sites, blue circles) and the MERMAN database managed by the British Oceanographic Data Centre (MERMAN sites, green circles). Map created with ArcGIS 10.3.1 (Esri, Redlands, CA), WGS84 projection system.
Table 1. A, B) Number of years of monitoring effort of trace element contamination in very fine sediments of surveyed sites and C) number of sites monitored for each trace element for six years or more.
A. number of monitoring years in coastal sites, ordered according to the median, then the mean, then the maximum of monitored years. Statistics are calculated considering strong acid digestion (sad) and total digestion (td) techniques together for Cr and Fe.
Area Latitude Longitude YEAR.first YEAR.last As Cd Cr (sad) Cr (td) Cu Fe (sad) Fe (td) Hg Ni Pb Zn min.YEAR max.YEAR mean.YEAR median.YEAR
Channel 50.8454 -0.2869 1990 2007 17 17 17 0 17 0 0 17 17 17 17 0 17 15 17 North Sea 51.3859 1.0569 1996 2013 10 17 16 0 16 16 0 17 16 16 16 10 17 16 16 Plymouth 50.4245 -4.1961 1993 2011 15 15 10 5 15 9 5 15 15 15 15 14 15 15 15 Solent 50.7784 -1.1788 1995 2011 8 17 15 0 15 15 0 17 15 15 15 8 17 15 15 Medway Estuary 51.3081 0.4611 1996 2010 10 15 15 0 15 14 0 15 15 15 15 10 15 14 15 Solent 50.8559 -1.3738 1995 2011 10 17 14 0 14 14 0 17 14 14 14 10 17 14 14 Solent 50.8338 -1.3392 1995 2011 9 17 14 0 14 14 0 17 14 14 14 9 17 14 14 Solent 50.8427 -1.3530 1995 2011 9 17 14 0 14 14 0 17 14 14 14 9 17 14 14 Solent 50.8451 -1.3593 1995 2011 9 17 14 0 14 14 0 17 14 14 14 9 17 14 14 Medway Estuary 51.4294 0.6235 1995 2011 10 17 14 0 14 13 0 17 14 14 14 10 17 14 14 Solent 50.8197 -1.3217 1995 2011 8 17 14 0 14 14 0 17 14 14 14 8 17 14 14 Solent 50.9041 -1.4499 1995 2011 7 17 14 0 14 14 0 17 14 14 14 7 17 14 14 Solent 50.8412 -0.9999 1995 2011 8 17 14 0 14 13 0 17 14 14 14 8 17 14 14 Solent 50.7181 -1.2852 1995 2011 7 17 14 0 14 14 0 17 14 14 14 7 17 14 14 Solent 50.8554 -1.3727 1995 2011 9 17 14 0 14 14 0 14 14 14 14 9 17 14 14 Solent 50.8272 -0.8102 1995 2011 9 17 14 0 14 14 0 14 14 14 14 9 17 14 14 Solent 50.7343 -1.0538 1995 2011 8 16 14 0 14 14 0 16 14 14 14 8 16 14 14 Solent 50.9266 -1.3791 1995 2011 8 17 14 0 14 14 0 14 14 14 14 8 17 14 14 Channel 50.7821 -0.0353 1995 2011 7 17 14 0 14 14 0 14 14 14 14 7 17 14 14 Channel 50.7733 -0.5089 1995 2008 7 14 14 0 14 14 0 14 14 14 14 7 14 13 14 Medway Estuary 51.3649 0.7639 1995 2008 8 14 14 0 14 13 0 14 14 14 14 8 14 13 14 Medway Estuary 51.3482 0.7430 1996 2011 9 16 13 0 13 13 0 16 13 13 13 9 16 13 13 Medway Estuary 51.3952 0.7458 1996 2011 9 16 13 0 13 13 0 16 13 13 13 9 16 13 13 Medway Estuary 51.3683 0.7632 1995 2011 7 17 13 0 13 12 0 17 13 13 13 7 17 13 13 Medway Estuary 51.3295 0.4584 1996 2011 8 16 13 0 13 12 0 16 13 13 13 8 16 13 13 Channel 50.8223 0.5320 1996 2011 7 16 13 0 13 13 0 16 13 13 13 7 16 13 13 Poole Harbour 50.6845 -1.9915 1999 2011 13 13 8 5 13 8 5 13 13 13 13 13 13 13 13 Plymouth 50.3493 -4.1308 1999 2011 13 13 8 5 13 8 5 13 13 13 13 13 13 13 13 Celtic Sea 51.7018 -4.9192 1999 2011 13 12 0 13 13 0 13 13 13 13 13 12 13 13 13 Medway Estuary 51.3104 0.4597 1996 2010 8 15 13 0 13 12 0 15 13 13 13 8 15 13 13 Medway Estuary 51.4464 0.7250 1997 2011 9 15 12 0 12 12 0 15 12 12 12 9 15 12 12 Medway Estuary 51.3884 0.5209 1999 2012 12 12 9 3 12 9 3 12 12 12 12 12 12 12 12 Plymouth 50.3840 -4.1971 1993 2008 12 12 10 2 12 9 2 12 12 12 12 11 12 12 12 Solent 50.9186 -1.4774 1995 2005 5 11 11 0 11 11 0 11 11 11 11 5 11 10 11 Poole Harbour 50.6854 -2.0297 1999 2008 10 10 8 2 10 8 2 10 10 10 10 10 10 10 10 Medway Estuary 51.3345 0.4559 1999 2008 10 10 9 1 10 9 1 10 10 10 10 10 10 10 10 Bristol Channel 51.4708 -3.0245 1999 2008 10 9 0 10 10 0 10 10 10 10 10 9 10 10 10 Bristol Channel 51.5608 -2.7713 1999 2008 10 9 0 10 10 0 10 10 10 10 10 9 10 10 10 Solent 50.7726 -1.2797 1996 2005 4 10 10 0 10 10 0 10 10 10 10 4 10 9 10 Channel 50.7546 -0.7078 1995 2004 3 10 10 0 10 10 0 10 10 10 10 3 10 9 10 Solent 50.6434 -1.0900 2001 2011 9 11 9 0 9 9 0 11 9 9 9 9 11 9 9 Thames Estuary 51.4972 0.0638 1999 2012 9 10 0 9 9 0 9 10 9 9 9 9 10 9 9 Solent 50.8764 -1.3803 1999 2008 9 9 8 1 9 8 1 9 9 9 9 9 9 9 9 Medway Estuary 51.3916 0.6287 2001 2011 8 11 8 0 8 8 0 11 8 8 8 8 11 9 8 Channel 50.9446 0.7502 2004 2011 8 8 8 0 8 8 0 8 8 8 8 8 8 8 8 Bristol Channel 51.7279 -2.4748 1999 2007 8 7 0 8 8 0 8 8 8 8 8 7 8 8 8 Channel 50.7588 0.3515 1996 2009 1 8 8 0 8 8 0 9 8 8 8 1 9 7 8 Celtic Sea 50.2275 -5.3930 1983 2011 9 8 7 0 9 5 0 7 7 6 9 5 9 7 7 Thames Estuary 51.4948 0.4735 1999 2008 7 8 0 7 7 0 7 8 7 7 7 7 8 7 7 Solent 50.7864 -1.1306 1997 2003 3 7 7 0 7 7 0 7 7 7 7 3 7 7 7 Hythe 51.0416 1.0906 1991 2008 5 7 7 0 7 5 0 5 7 7 7 5 7 6 7 Channel 50.9716 1.0431 2005 2010 6 6 0 6 6 0 6 6 6 6 6 6 6 6 6
Dart-Exe-Axe River Estuaries 50.6080 -3.3764 1988 2011 5 6 6 0 6 5 0 5 6 6 6 5 6 6 6
Solent 50.7871 -1.2296 1992 1999 6 6 6 0 6 1 0 6 6 6 6 1 6 5 6
Channel 51.0820 1.2068 1996 2001 0 6 6 0 6 6 0 6 6 6 6 0 6 5 6 Plymouth 50.4118 -4.2040 1987 2012 5 6 6 0 6 3 0 4 6 6 6 3 6 5 6 Bristol Channel 51.2347 -3.0032 1992 2009 4 12 5 0 5 2 0 14 5 5 5 2 14 6 5 Channel 50.7566 0.0679 2004 2011 5 8 5 0 5 5 0 8 5 5 5 5 8 6 5 Solent 50.7255 -1.5317 2004 2010 5 5 5 0 5 5 0 7 5 5 5 5 7 5 5 Bristol Channel 51.1445 -2.9977 1992 2004 4 7 5 0 5 2 0 5 5 5 5 2 7 5 5 Plymouth 50.3656 -4.1709 1983 2008 4 5 5 0 5 2 0 5 5 5 5 2 5 5 5
Bideford Bay Estuary 51.0507 -4.1842 1989 1997 4 5 5 0 5 3 0 4 5 5 5 3 5 5 5
Channel 50.2944 -4.7728 1998 2011 5 5 5 0 5 3 0 4 4 5 5 3 5 5 5
Solent 50.8201 -1.3085 1992 1996 5 5 5 0 5 0 0 5 5 5 5 0 5 4 5
Solent 50.8823 -1.3940 1992 1996 5 5 5 0 5 0 0 5 5 5 5 0 5 4 5
Channel 50.6633 -0.8270 1992 1996 5 5 5 0 5 0 0 5 5 5 5 0 5 4 5
Dart-Exe-Axe River Estuaries 50.5463 -3.4932 1983 2001 5 5 5 0 5 2 0 3 5 5 5 2 5 4 5
Bristol Channel 51.3230 -2.9978 1993 2011 4 11 4 0 4 1 0 9 4 4 4 1 11 5 4
Celtic Sea 50.4131 -5.1261 1995 2010 4 4 5 0 4 2 0 4 5 5 5 2 5 4 4
Poole Harbour 50.7321 -2.0439 1992 2003 3 4 4 0 4 3 0 4 4 4 4 3 4 4 4
Channel 50.3636 -4.4098 1983 2009 4 4 4 0 4 1 0 4 3 4 4 1 4 4 4
Fal Estuary 50.1499 -5.0445 1990 1994 2 4 4 0 4 3 0 2 4 4 4 2 4 3 4
Dart-Exe-Axe River Estuaries 50.7102 -3.0575 1989 1994 1 4 4 0 4 1 0 1 4 4 4 1 4 3 4
Dart-Exe-Axe River Estuaries 50.6904 -3.4873 1990 2011 2 13 2 0 3 1 0 13 3 3 3 1 13 5 3
Bideford Bay Estuary 51.0891 -4.1025 1992 2010 3 8 2 0 3 2 0 14 3 3 3 2 14 5 3
Fal Estuary 50.1917 -5.0275 1995 2011 4 4 2 0 3 4 0 3 4 3 3 2 4 3 3 Channel 50.9833 1.0167 2001 2004 3 3 0 3 3 0 3 3 3 3 4 3 4 3 3 Bristol Channel 51.2052 -3.0205 1994 2008 3 3 3 0 3 0 0 6 3 3 3 0 6 3 3 Channel 50.3190 -4.6815 1994 2013 3 3 3 0 3 3 0 3 3 3 3 3 3 3 3 Channel 50.0719 -5.2981 1984 2006 3 5 3 0 3 1 0 2 3 3 3 1 5 3 3 Bristol Channel 51.1430 -2.9921 1994 2010 3 4 3 0 3 0 0 4 3 3 3 0 4 3 3 Celtic Sea 50.8075 -4.5575 1997 2010 3 3 3 0 3 2 0 2 3 3 3 2 3 3 3 Plymouth 50.4678 -4.2376 1993 1996 3 3 3 0 3 1 0 3 3 3 3 1 3 3 3 Bristol Channel 51.4152 -2.8877 1994 1996 3 3 3 0 3 0 0 3 3 3 3 0 3 3 3 Plymouth 50.3592 -4.1312 2008 2012 3 3 3 0 3 0 0 3 3 3 3 0 3 3 3
Bideford Bay Estuary 51.0385 -4.2564 1990 2010 2 3 3 0 3 1 0 2 3 3 3 1 3 3 3
Dart-Exe-Axe River Estuaries 50.5385 -3.5727 1990 1992 0 3 2 0 3 1 0 1 3 3 3 0 3 2 3
Plymouth 50.3860 -4.0858 1991 2011 1 11 2 0 2 1 0 1 2 2 2 1 11 3 2 Bristol Channel 51.5365 -2.6830 1995 1998 2 2 2 0 2 1 0 3 2 2 2 1 3 2 2 Medway Estuary 51.3984 0.5560 2004 2005 2 2 2 0 2 2 0 2 2 2 2 2 2 2 2 Solent 50.8743 -1.3682 2011 2013 2 2 0 2 2 0 2 2 2 2 2 2 2 2 2 Plymouth 50.2925 -4.1610 2010 2012 2 2 0 2 2 0 2 2 2 2 2 2 2 2 2 Bristol Channel 51.2421 -3.2907 2011 2013 2 2 0 2 2 0 2 2 2 2 2 2 2 2 2 Celtic Sea 50.5987 -4.7963 2005 2008 2 2 2 0 2 2 0 2 2 2 2 2 2 2 2 Channel 50.3411 -4.6954 1997 2006 2 2 2 0 2 2 0 2 2 2 2 2 2 2 2 Channel 50.0993 -5.5433 1993 1994 2 2 2 0 2 1 0 2 2 2 2 1 2 2 2 Bristol Channel 51.4995 -2.7419 1993 1994 2 2 2 0 2 1 0 2 2 2 2 1 2 2 2 Bristol Channel 51.4157 -2.8915 1993 1994 2 2 2 0 2 1 0 2 2 2 2 1 2 2 2 Poole Harbour 50.6719 -2.0325 2004 2005 2 2 2 0 2 0 0 2 2 2 2 0 2 2 2 Poole Harbour 50.7132 -1.9575 2004 2005 2 2 2 0 2 0 0 2 2 2 2 0 2 2 2 Poole Harbour 50.6979 -1.9334 2004 2005 2 2 2 0 2 0 0 2 2 2 2 0 2 2 2 Medway Estuary 51.3595 0.4482 1997 1998 0 2 2 0 2 2 0 2 2 2 2 0 2 2 2 Solent 50.8260 -1.3405 1996 1997 0 2 2 0 2 2 0 2 2 2 2 0 2 2 2 Medway Estuary 51.3390 0.4550 1997 1998 0 2 2 0 2 2 0 2 2 2 2 0 2 2 2 Medway Estuary 51.4468 0.6712 1997 1998 0 2 2 0 2 2 0 2 2 2 2 0 2 2 2 Plymouth 50.3588 -4.1523 1992 1994 1 2 2 0 2 2 0 1 2 2 2 1 2 2 2 Poole Harbour 50.7276 -1.9991 1991 1997 2 1 2 0 2 2 0 1 2 1 2 1 2 2 2
Dart-Exe-Axe River Estuaries 50.3387 -3.5485 1987 1997 1 2 2 0 2 1 0 1 2 2 2 1 2 2 2
Fal Estuary 50.1781 -5.0589 1992 1995 2 1 0 0 2 2 0 0 2 2 2 0 2 1 2
Fal Estuary 50.1846 -5.0502 1992 1995 2 1 0 0 2 2 0 0 2 2 2 0 2 1 2
Fal Estuary 50.2010 -5.0683 1992 1995 2 1 0 0 2 2 0 0 2 2 2 0 2 1 2
Fal Estuary 50.2085 -5.0908 1992 1995 2 1 0 0 2 2 0 0 2 2 2 0 2 1 2
Fal Estuary 50.1977 -5.0524 1992 1995 2 1 0 0 2 2 0 0 2 2 2 0 2 1 2 Fal Estuary 50.1930 -5.0402 1992 1995 2 1 0 0 2 2 0 0 2 2 2 0 2 1 2 Hythe 51.0402 1.0461 1991 1993 0 2 2 0 2 0 0 0 2 2 2 0 2 1 2 Hythe 51.0434 1.0588 1991 1993 0 2 2 0 2 0 0 0 2 2 2 0 2 1 2 Hythe 51.0463 1.0718 1991 1993 0 2 2 0 2 0 0 0 2 2 2 0 2 1 2 Hythe 51.0529 1.0988 1991 1993 0 2 2 0 2 0 0 0 2 2 2 0 2 1 2 Hythe 51.0559 1.1120 1991 1993 0 2 2 0 2 0 0 0 2 2 2 0 2 1 2 Hythe 51.0593 1.1253 1991 1993 0 2 2 0 2 0 0 0 2 2 2 0 2 1 2 Hythe 51.0316 1.0505 1991 1993 0 2 2 0 2 0 0 0 2 2 2 0 2 1 2 Hythe 51.0356 1.0633 1991 1993 0 2 2 0 2 0 0 0 2 2 2 0 2 1 2 Hythe 51.0382 1.0768 1991 1993 0 2 2 0 2 0 0 0 2 2 2 0 2 1 2 Hythe 51.0446 1.1036 1991 1993 0 2 2 0 2 0 0 0 2 2 2 0 2 1 2 Hythe 51.0476 1.1170 1991 1993 0 2 2 0 2 0 0 0 2 2 2 0 2 1 2 Hythe 51.0507 1.1303 1991 1993 0 2 2 0 2 0 0 0 2 2 2 0 2 1 2 Hythe 51.0236 1.0561 1991 1993 0 2 2 0 2 0 0 0 2 2 2 0 2 1 2 Hythe 51.0266 1.0690 1991 1993 0 2 2 0 2 0 0 0 2 2 2 0 2 1 2 Hythe 51.0296 1.0840 1991 1993 0 2 2 0 2 0 0 0 2 2 2 0 2 1 2 Hythe 51.0326 1.0953 1991 1993 0 2 2 0 2 0 0 0 2 2 2 0 2 1 2 Hythe 51.0359 1.1088 1991 1993 0 2 2 0 2 0 0 0 2 2 2 0 2 1 2 Hythe 51.0393 1.1216 1991 1993 0 2 2 0 2 0 0 0 2 2 2 0 2 1 2 Hythe 51.0424 1.1347 1991 1993 0 2 2 0 2 0 0 0 2 2 2 0 2 1 2
Dart-Exe-Axe River Estuaries 50.5389 -3.5790 1988 1989 0 1 2 0 2 0 0 0 2 2 2 0 2 1 2
Dart-Exe-Axe River Estuaries 50.5409 -3.5636 1988 1989 0 1 2 0 2 0 0 0 2 2 2 0 2 1 2
Bristol Channel 51.5160 -2.7040 1991 2011 2 11 1 0 1 1 0 14 1 1 1 1 14 4 1 Bristol Channel 51.5233 -2.6948 1993 2009 1 8 1 0 1 1 0 12 1 1 1 1 12 3 1 Poole Harbour 50.7128 -1.9925 1993 2004 1 6 1 0 1 1 0 8 1 1 1 1 8 2 1 Channel 50.3769 -4.4640 1999 2010 1 2 1 0 2 2 0 1 1 1 2 1 2 1 1 Bristol Channel 51.5537 -2.6923 1991 1997 2 1 1 0 1 1 0 2 1 1 1 1 2 1 1 Bristol Channel 51.5249 -2.7026 1991 1993 2 1 1 0 1 1 0 1 1 1 1 1 2 1 1 Bristol Channel 51.5190 -2.7076 1991 1993 2 1 1 0 1 1 0 1 1 1 1 1 2 1 1 Fal Estuary 50.1543 -5.0607 2006 2006 1 1 1 0 1 1 0 1 1 1 1 1 1 1 1 Poole Harbour 50.7043 -2.0452 2011 2011 1 1 0 1 1 0 1 1 1 1 1 1 1 1 1 Fal Estuary 50.1520 -5.0625 2006 2006 1 1 1 0 1 1 0 1 1 1 1 1 1 1 1 Fal Estuary 50.1561 -5.0672 2006 2006 1 1 1 0 1 1 0 1 1 1 1 1 1 1 1 Fal Estuary 50.1609 -5.0732 2006 2006 1 1 1 0 1 1 0 1 1 1 1 1 1 1 1 Solent 50.8232 -1.1212 2011 2011 1 1 0 1 1 0 1 1 1 1 1 1 1 1 1 Solent 50.7653 -1.2002 2011 2011 1 1 0 1 1 0 1 1 1 1 1 1 1 1 1 Channel 50.7661 -0.7677 2011 2011 1 1 0 1 1 0 1 1 1 1 1 1 1 1 1 Bristol Channel 51.2239 -3.2499 2012 2012 1 1 0 1 1 0 1 1 1 1 1 1 1 1 1 Fal Estuary 50.1650 -5.0852 2006 2006 1 1 1 0 1 1 0 1 1 1 1 1 1 1 1 Channel 50.8373 -0.2865 2013 2013 1 1 0 1 1 0 1 1 1 1 1 1 1 1 1 Fal Estuary 50.1691 -5.1003 2006 2006 1 1 1 0 1 1 0 1 1 1 1 1 1 1 1 Bristol Channel 51.2133 -3.4402 1993 1993 1 1 1 0 1 1 0 1 1 1 1 1 1 1 1 Fal Estuary 50.1682 -5.0909 2006 2006 1 1 1 0 1 1 0 1 1 1 1 1 1 1 1 Channel 50.3290 -3.4960 2009 2009 1 1 0 1 1 0 1 1 1 1 1 1 1 1 1 Fal Estuary 50.1670 -5.0806 2006 2006 1 1 1 0 1 1 0 1 1 1 1 1 1 1 1 Medway Estuary 51.4215 0.6513 2012 2012 1 1 0 1 1 0 1 1 1 1 1 1 1 1 1 Fal Estuary 50.1580 -5.0632 2006 2006 1 1 1 0 1 1 0 1 1 1 1 1 1 1 1 Fal Estuary 50.1665 -5.0379 2006 2006 1 1 1 0 1 1 0 1 1 1 1 1 1 1 1 Fal Estuary 50.1722 -5.0354 2006 2006 1 1 1 0 1 1 0 1 1 1 1 1 1 1 1 Fal Estuary 50.1771 -5.0481 2013 2013 1 1 0 1 1 0 1 1 1 1 1 1 1 1 1 Fal Estuary 50.1781 -5.0562 2006 2006 1 1 1 0 1 1 0 1 1 1 1 1 1 1 1
Bideford Bay Estuary 51.0031 -4.1997 2013 2013 1 1 0 1 1 0 1 1 1 1 1 1 1 1 1
Fal Estuary 50.1967 -5.0637 2006 2006 1 1 1 0 1 1 0 1 1 1 1 1 1 1 1
Celtic Sea 50.5260 -4.9332 2012 2012 1 1 0 1 1 0 1 1 1 1 1 1 1 1 1
Fal Estuary 50.2051 -5.0676 2006 2006 1 1 1 0 1 1 0 1 1 1 1 1 1 1 1
Helford River Estuary 50.0845 -5.1088 2005 2005 1 1 1 0 1 1 0 1 1 1 1 1 1 1 1
Fal Estuary 50.2160 -5.0281 2006 2006 1 1 1 0 1 1 0 1 1 1 1 1 1 1 1
Fal Estuary 50.2451 -5.0249 2005 2005 1 1 1 0 1 1 0 1 1 1 1 1 1 1 1 Fal Estuary 50.2569 -5.0120 2005 2005 1 1 1 0 1 1 0 1 1 1 1 1 1 1 1 Fal Estuary 50.2292 -5.0153 2006 2006 1 1 1 0 1 1 0 1 1 1 1 1 1 1 1 Fal Estuary 50.2270 -4.9849 2005 2005 1 1 1 0 1 1 0 1 1 1 1 1 1 1 1 Fal Estuary 50.1954 -5.0417 2006 2006 1 1 1 0 1 1 0 1 1 1 1 1 1 1 1 North Sea 51.3866 0.9808 2012 2012 1 1 0 1 1 0 1 1 1 1 1 1 1 1 1
Helford River Estuary 50.0936 -5.1332 2005 2005 1 1 1 0 1 1 0 1 1 1 1 1 1 1 1
Fal Estuary 50.1830 -5.0157 2006 2006 1 1 1 0 1 1 0 1 1 1 1 1 1 1 1 Channel 50.7551 0.0404 2011 2011 1 1 0 1 1 0 1 1 1 1 1 1 1 1 1 Fal Estuary 50.1578 -5.0130 2006 2006 1 1 1 0 1 1 0 1 1 1 1 1 1 1 1 Fal Estuary 50.1613 -5.0053 2006 2006 1 1 1 0 1 1 0 1 1 1 1 1 1 1 1 Fal Estuary 50.1735 -4.9953 2006 2006 1 1 1 0 1 1 0 1 1 1 1 1 1 1 1 Fal Estuary 50.1675 -5.0010 2006 2006 1 1 1 0 1 1 0 1 1 1 1 1 1 1 1 Fal Estuary 50.1665 -4.9951 2006 2006 1 1 1 0 1 1 0 1 1 1 1 1 1 1 1 Fal Estuary 50.1616 -4.9920 2006 2006 1 1 1 0 1 1 0 1 1 1 1 1 1 1 1 Fal Estuary 50.1519 -5.0040 2006 2006 1 1 1 0 1 1 0 1 1 1 1 1 1 1 1
Helford River Estuary 50.0864 -5.1877 2005 2005 1 1 1 0 1 1 0 1 1 1 1 1 1 1 1
Channel 50.3613 -4.3479 2010 2010 1 1 1 0 1 1 0 1 1 1 1 1 1 1 1
Plymouth 50.3390 -4.1514 2011 2011 1 1 0 1 1 0 1 1 1 1 1 1 1 1 1
Helford River Estuary 50.0934 -5.2062 2005 2005 1 1 1 0 1 1 0 1 1 1 1 1 1 1 1
Helford River Estuary 50.1017 -5.1645 2005 2005 1 1 1 0 1 1 0 1 1 1 1 1 1 1 1
Dart-Exe-Axe River Estuaries 50.3930 -3.5911 2011 2011 1 1 0 1 1 0 1 1 1 1 1 1 1 1 1
Helford River Estuary 50.1057 -5.1413 2005 2005 1 1 1 0 1 1 0 1 1 1 1 1 1 1 1
Dart-Exe-Axe River Estuaries 50.6664 -3.4642 2013 2013 1 1 0 1 1 0 1 1 1 1 1 1 1 1 1
Channel 50.7313 -2.9011 1997 1997 1 0 1 0 1 1 0 1 1 1 1 0 1 1 1 Channel 50.6185 -2.5385 2004 2004 1 1 1 0 1 0 0 1 1 1 1 0 1 1 1 Channel 50.5739 -2.4533 1997 1997 1 0 1 0 1 1 0 1 1 1 1 0 1 1 1 Channel 50.6152 -1.9547 1997 1997 1 0 1 0 1 1 0 1 1 1 1 0 1 1 1 Poole Harbour 50.6656 -1.9702 2005 2005 1 1 1 0 1 0 0 1 1 1 1 0 1 1 1 Poole Harbour 50.6728 -1.9943 2004 2004 1 1 1 0 1 0 0 1 1 1 1 0 1 1 1 Poole Harbour 50.6782 -2.0028 2004 2004 1 1 1 0 1 0 0 1 1 1 1 0 1 1 1 Poole Harbour 50.6907 -2.0651 2004 2004 1 1 1 0 1 0 0 1 1 1 1 0 1 1 1 Poole Harbour 50.6871 -2.0806 2004 2004 1 1 1 0 1 0 0 1 1 1 1 0 1 1 1 Poole Harbour 50.7006 -2.0651 2004 2004 1 1 1 0 1 0 0 1 1 1 1 0 1 1 1 Poole Harbour 50.7141 -2.0580 2004 2004 1 1 1 0 1 0 0 1 1 1 1 0 1 1 1 Poole Harbour 50.7276 -2.0439 2005 2005 1 1 1 0 1 0 0 1 1 1 1 0 1 1 1 Poole Harbour 50.7231 -2.0368 2004 2004 1 1 1 0 1 0 0 1 1 1 1 0 1 1 1 Poole Harbour 50.7006 -2.0014 1997 1997 1 0 1 0 1 1 0 1 1 1 1 0 1 1 1 Poole Harbour 50.7195 -2.0014 2004 2004 1 1 1 0 1 0 0 1 1 1 1 0 1 1 1 Poole Harbour 50.7276 -2.0042 2004 2004 1 1 1 0 1 0 0 1 1 1 1 0 1 1 1 Poole Harbour 50.7348 -1.9971 2004 2004 1 1 1 0 1 0 0 1 1 1 1 0 1 1 1 Poole Harbour 50.7195 -1.9858 2005 2005 1 1 1 0 1 0 0 1 1 1 1 0 1 1 1 Solent 50.8909 -1.3853 1996 1996 0 1 1 0 1 1 0 1 1 1 1 0 1 1 1 Solent 50.7095 -1.5122 1996 1996 0 1 1 0 1 1 0 1 1 1 1 0 1 1 1 Solent 50.7644 -1.3279 1996 1996 0 1 1 0 1 1 0 1 1 1 1 0 1 1 1 Solent 50.7327 -1.1625 1996 1996 0 1 1 0 1 1 0 1 1 1 1 0 1 1 1 Solent 50.6888 -1.0699 1996 1996 0 1 1 0 1 1 0 1 1 1 1 0 1 1 1 Solent 50.6606 -1.1355 1996 1996 0 1 1 0 1 1 0 1 1 1 1 0 1 1 1 Channel 50.7742 -0.3349 1996 1996 0 1 1 0 1 1 0 1 1 1 1 0 1 1 1 Channel 50.9496 0.7292 2006 2006 1 1 1 0 1 0 0 1 1 1 1 0 1 1 1 North Sea 51.3877 1.4961 1996 1996 0 1 1 0 1 1 0 1 1 1 1 0 1 1 1 North Sea 51.3938 1.4255 1996 1996 0 1 1 0 1 1 0 1 1 1 1 0 1 1 1 Channel 50.0641 -5.2878 1998 1998 1 1 1 0 1 1 0 0 1 1 1 0 1 1 1 Fal Estuary 50.1872 -5.0412 2006 2006 1 1 1 0 1 0 0 1 1 1 1 0 1 1 1 Plymouth 50.2956 -4.1633 1994 1994 1 1 1 0 1 0 0 1 1 1 1 0 1 1 1 Solent 50.9085 -1.3813 1995 1995 1 1 1 0 1 0 0 0 1 1 1 0 1 1 1 Fal Estuary 50.1629 -5.0397 1995 1995 1 1 0 0 1 1 0 0 1 1 1 0 1 1 1 Plymouth 50.4649 -4.1501 1989 1989 0 1 1 0 1 1 0 0 1 1 1 0 1 1 1
Solent 50.8482 -1.3650 1994 1994 0 1 1 0 1 0 0 0 1 1 1 0 1 1 1
Bideford Bay Estuary 51.0933 -4.1674 1989 1989 0 1 1 0 1 0 0 0 1 1 1 0 1 1 1
Bideford Bay Estuary 51.1001 -4.1647 1989 1989 0 1 1 0 1 0 0 0 1 1 1 0 1 1 1
Bideford Bay Estuary 51.0924 -4.1205 1989 1989 0 1 1 0 1 0 0 0 1 1 1 0 1 1 1
Bideford Bay Estuary 51.0822 -4.0858 1989 1989 0 1 1 0 1 0 0 0 1 1 1 0 1 1 1
Bideford Bay Estuary 51.0816 -4.0686 1994 1994 0 1 0 0 1 0 0 1 1 1 1 0 1 1 1
Bideford Bay Estuary 51.0180 -4.2027 1989 1989 0 1 1 0 1 0 0 0 1 1 1 0 1 1 1
Bideford Bay Estuary 51.0243 -4.2015 1989 1989 0 1 1 0 1 0 0 0 1 1 1 0 1 1 1
Fal Estuary 50.2067 -5.0355 1992 1992 1 0 0 0 1 1 0 0 1 1 1 0 1 1 1
Fal Estuary 50.1888 -5.0378 1992 1992 1 0 0 0 1 1 0 0 1 1 1 0 1 1 1
Channel 50.3272 -4.6384 2002 2002 1 1 0 0 1 1 0 0 1 0 1 0 1 1 1
Channel 50.4637 -3.4793 1991 1991 0 1 1 0 1 0 0 0 1 1 1 0 1 1 1
Dart-Exe-Axe River Estuaries 50.6899 -3.4785 1989 1989 0 1 1 0 1 0 0 0 1 1 1 0 1 1 1
Medway Estuary 51.3144 0.4583 1997 2010 0 14 0 0 0 0 0 14 0 0 0 0 14 3 0 Celtic Sea 50.4261 -5.0955 2010 2011 0 2 0 0 0 0 0 2 0 0 0 0 2 0 0 Plymouth 50.3129 -4.0519 2001 2011 0 3 0 0 0 0 0 0 0 0 0 0 3 0 0 Channel 50.2237 -3.7804 2009 2011 0 0 0 0 0 0 0 3 0 0 0 0 3 0 0 Plymouth 50.3111 -4.0532 2010 2011 0 2 0 0 0 0 0 0 0 0 0 0 2 0 0 Bristol Channel 51.4810 -2.6782 2003 2003 0 1 0 0 0 0 0 0 0 0 0 0 1 0 0 Plymouth 50.3118 -4.0531 1998 1998 0 0 0 0 1 0 0 0 0 0 0 0 1 0 0
B. number of monitoring years in open sea sites, ordered according to the median, then the mean, then the maximum of monitored years. Only the total digestion technique (td) was applied for open sea sites.
Area Latitude Longitude YEAR.first YEAR.last As Cd Cr (sad) Cr (td) Cu Fe (sad) Fe (td) Hg Ni Pb Zn min.YEAR max.YEAR mean.YEAR median.YEAR
Channel 50.4300 -3.1217 1999 2012 13 12 0 12 13 0 12 12 13 13 14 12 14 13 13 Celtic Sea 51.2499 -5.9995 1999 2012 11 11 0 11 11 0 10 11 11 11 12 10 12 11 11 Celtic Sea 48.7990 -8.2450 2009 2009 1 1 0 1 1 0 1 1 1 1 1 1 1 1 1 Celtic Sea 49.9400 -7.1680 2009 2009 1 1 0 1 1 0 1 1 1 1 1 1 1 1 1 Channel 49.9470 -5.5580 2009 2009 1 1 0 1 1 0 1 1 1 1 1 1 1 1 1 Celtic Sea 50.0000 -8.0000 2012 2012 1 1 0 1 1 0 1 1 1 1 1 1 1 1 1 Celtic Sea 50.0000 -6.0000 2012 2012 1 1 0 1 1 0 1 1 1 1 1 1 1 1 1 Celtic Sea 50.0270 -7.8780 2009 2009 1 1 0 1 1 0 1 1 1 1 1 1 1 1 1 Channel 50.2290 -4.5460 2009 2009 1 1 0 1 1 0 1 1 1 1 1 1 1 1 1 Channel 50.3070 -3.2860 2009 2009 1 1 0 1 1 0 1 1 1 1 1 1 1 1 1 Channel 50.3180 -3.0750 2009 2009 1 1 0 1 1 0 1 1 1 1 1 1 1 1 1 Celtic Sea 48.8220 -7.8580 2009 2009 1 1 0 1 1 0 1 1 1 1 1 1 1 1 1 Celtic Sea 50.3630 -6.4860 2008 2008 1 1 0 1 1 0 1 1 1 1 1 1 1 1 1 Channel 50.3710 -3.3980 2009 2009 1 1 0 1 1 0 1 1 1 1 1 1 1 1 1 Celtic Sea 50.3920 -6.9870 2008 2008 1 1 0 1 1 0 1 1 1 1 1 1 1 1 1 Channel 50.3990 -3.2780 2009 2009 1 1 0 1 1 0 1 1 1 1 1 1 1 1 1 Celtic Sea 50.4070 -5.9030 2008 2008 1 1 0 1 1 0 1 1 1 1 1 1 1 1 1 Celtic Sea 50.4490 -7.1720 2008 2008 1 1 0 1 1 0 1 1 1 1 1 1 1 1 1 Celtic Sea 49.2530 -6.2300 2009 2009 1 1 0 1 1 0 1 1 1 1 1 1 1 1 1 Celtic Sea 50.4630 -7.0590 2008 2008 1 1 0 1 1 0 1 1 1 1 1 1 1 1 1 Celtic Sea 50.4750 -7.2970 2008 2008 1 1 0 1 1 0 1 1 1 1 1 1 1 1 1 Celtic Sea 50.5000 -6.0000 2012 2012 1 1 0 1 1 0 1 1 1 1 1 1 1 1 1 Channel 50.5270 -3.2200 2011 2011 1 1 0 1 1 0 1 1 1 1 1 1 1 1 1 Channel 50.5510 -0.1330 2009 2009 1 1 0 1 1 0 1 1 1 1 1 1 1 1 1 Channel 50.5530 -3.0900 2009 2009 1 1 0 1 1 0 1 1 1 1 1 1 1 1 1 Celtic Sea 50.5550 -7.1700 2008 2008 1 1 0 1 1 0 1 1 1 1 1 1 1 1 1 Celtic Sea 50.5600 -7.3070 2008 2008 1 1 0 1 1 0 1 1 1 1 1 1 1 1 1 Channel 50.5640 -2.3150 2009 2009 1 1 0 1 1 0 1 1 1 1 1 1 1 1 1 Celtic Sea 49.2600 -5.3650 2009 2009 1 1 0 1 1 0 1 1 1 1 1 1 1 1 1 Celtic Sea 50.5860 -6.9840 2008 2008 1 1 0 1 1 0 1 1 1 1 1 1 1 1 1 Celtic Sea 50.5870 -6.3950 2008 2008 1 1 0 1 1 0 1 1 1 1 1 1 1 1 1 Celtic Sea 50.6010 -6.9030 2008 2008 1 1 0 1 1 0 1 1 1 1 1 1 1 1 1 Celtic Sea 50.6040 -7.3280 2008 2008 1 1 0 1 1 0 1 1 1 1 1 1 1 1 1 Celtic Sea 50.6200 -7.3230 2008 2008 1 1 0 1 1 0 1 1 1 1 1 1 1 1 1 Channel 50.6500 -0.6160 2009 2009 1 1 0 1 1 0 1 1 1 1 1 1 1 1 1 Celtic Sea 50.6770 -4.8630 2008 2008 1 1 0 1 1 0 1 1 1 1 1 1 1 1 1
Celtic Sea 49.2950 -7.0930 2009 2009 1 1 0 1 1 0 1 1 1 1 1 1 1 1 1 Celtic Sea 50.7500 -5.5000 2012 2012 1 1 0 1 1 0 1 1 1 1 1 1 1 1 1 Celtic Sea 50.9080 -5.9410 2008 2008 1 1 0 1 1 0 1 1 1 1 1 1 1 1 1 Celtic Sea 49.7680 -8.5220 2009 2009 1 1 0 1 1 0 1 1 1 1 1 1 1 1 1 Celtic Sea 50.9830 -6.2500 2008 2008 1 1 0 1 1 0 1 1 1 1 1 1 1 1 1 Celtic Sea 50.9830 -6.1350 2008 2008 1 1 0 1 1 0 1 1 1 1 1 1 1 1 1 Celtic Sea 51.0000 -6.0000 2012 2012 1 1 0 1 1 0 1 1 1 1 1 1 1 1 1 Celtic Sea 51.0000 -5.0000 2012 2012 1 1 0 1 1 0 1 1 1 1 1 1 1 1 1 Celtic Sea 51.0180 -6.3270 2008 2008 1 1 0 1 1 0 1 1 1 1 1 1 1 1 1 Bristol Channel 51.1090 -4.3560 2008 2008 1 1 0 1 1 0 1 1 1 1 1 1 1 1 1 Celtic Sea 51.1160 -6.1430 2008 2008 1 1 0 1 1 0 1 1 1 1 1 1 1 1 1 Channel 49.8080 -4.1960 2009 2009 1 1 0 1 1 0 1 1 1 1 1 1 1 1 1 Celtic Sea 51.1440 -6.7470 2008 2008 1 1 0 1 1 0 1 1 1 1 1 1 1 1 1 Celtic Sea 51.1870 -6.1490 2008 2008 1 1 0 1 1 0 1 1 1 1 1 1 1 1 1 Celtic Sea 51.2080 -6.2530 2008 2008 1 1 0 1 1 0 1 1 1 1 1 1 1 1 1 Celtic Sea 51.2110 -6.1920 2008 2008 1 1 0 1 1 0 1 1 1 1 1 1 1 1 1 Celtic Sea 51.2500 -6.5000 2012 2012 1 1 0 1 1 0 1 1 1 1 1 1 1 1 1 Celtic Sea 51.2500 -5.5000 2012 2012 1 1 0 1 1 0 1 1 1 1 1 1 1 1 1 Celtic Sea 51.3290 -6.2980 2008 2008 1 1 0 1 1 0 1 1 1 1 1 1 1 1 1 Channel 49.8440 -3.8330 2009 2009 1 1 0 1 1 0 1 1 1 1 1 1 1 1 1 Celtic Sea 51.4250 -5.9400 2008 2008 1 1 0 1 1 0 1 1 1 1 1 1 1 1 1 Celtic Sea 51.4550 -5.8380 2008 2008 1 1 0 1 1 0 1 1 1 1 1 1 1 1 1 Celtic Sea 51.4810 -6.1950 2008 2008 1 1 0 1 1 0 1 1 1 1 1 1 1 1 1 Celtic Sea 51.4890 -6.0340 2008 2008 1 1 0 1 1 0 1 1 1 1 1 1 1 1 1 Celtic Sea 51.5000 -6.0000 2012 2012 1 1 0 1 1 0 1 1 1 1 1 1 1 1 1 Bristol Channel 51.5070 -4.6690 2008 2008 1 1 0 1 1 0 1 1 1 1 1 1 1 1 1 Celtic Sea 49.8530 -6.0250 2009 2009 1 1 0 1 1 0 1 1 1 1 1 1 1 1 1 Celtic Sea 51.5540 -5.9500 2008 2008 1 1 0 1 1 0 1 1 1 1 1 1 1 1 1 North Sea 51.5732 1.9716 2011 2011 1 1 0 1 1 0 1 1 1 1 1 1 1 1 1 Celtic Sea 51.5760 -6.1420 2008 2008 1 1 0 1 1 0 1 1 1 1 1 1 1 1 1 Channel 50.6660 -1.6780 2009 2009 1 1 0 1 1 0 0 1 1 1 1 0 1 1 1 Channel 50.8860 1.0800 2009 2009 1 1 0 1 1 0 0 1 1 1 1 0 1 1 1
C. Number of sites monitored for six years or more.
nb of years As Cd Cr (sad) Cr (td) Cu Fe (sad) Fe (td) Hg Ni Pb Zn
>= 6 49 70 50 9 59 44 9 67 59 59 59
>= 7 47 63 45 8 53 42 8 62 53 52 53
>= 8 40 59 42 7 50 41 7 59 49 49 50
>= 9 29 52 35 6 46 34 6 54 45 45 46
A. Coastal sites, from 1983 to 2013 (no data for years 1985 and 1986).
YEAR As Cd Cr (sad) Cr (td) Cu Fe (sad) Fe (td) Hg Ni Pb Zn
1983 4 4 4 0 4 0 0 4 4 4 4 1984 2 2 2 0 2 0 0 2 2 2 2 1987 0 2 2 0 2 1 0 0 2 2 2 1988 0 0 2 0 2 0 0 1 2 2 2 1989 1 15 14 0 14 2 0 0 14 14 14 1990 2 7 5 0 7 1 0 2 7 7 7 1991 6 27 27 0 27 2 0 4 27 26 26 1992 16 14 13 0 23 18 0 10 23 23 23 1993 29 50 50 0 49 23 0 29 50 50 50 1994 23 25 24 0 25 2 0 25 25 25 25 1995 24 44 36 0 45 27 0 37 44 44 44 1996 21 60 59 0 60 42 0 61 60 60 60 1997 10 42 46 0 46 44 0 50 46 46 46 1998 5 43 40 0 41 39 0 45 40 40 40 1999 27 51 43 6 50 43 6 52 49 49 49 2000 16 55 41 6 47 40 6 53 47 47 47 2001 39 59 45 6 51 44 6 55 51 51 51 2002 50 56 43 7 51 43 7 54 51 50 50 2003 48 56 43 6 49 41 7 54 49 49 49 2004 68 77 62 7 69 45 6 75 68 69 69 2005 72 74 66 7 72 57 7 76 73 73 73 2006 76 80 71 5 77 69 5 80 76 76 76 2007 49 52 38 10 49 37 10 56 48 48 48 2008 49 61 38 12 50 35 12 61 50 50 50 2009 13 43 7 6 13 6 6 42 12 13 13 2010 18 53 12 6 18 7 6 47 18 18 18 2011 21 52 5 15 20 6 15 45 21 19 19 2012 9 9 2 7 9 0 7 9 9 9 9 2013 8 8 2 6 8 2 6 8 8 8 8
B. Open sea sites, from 1999 to 2012.
YEAR As Cd Cr (sad) Cr (td) Cu Fe (sad) Fe (td) Hg Ni Pb Zn
1999 2 2 0 2 2 0 0 2 2 2 2 2000 1 0 0 0 1 0 1 0 1 1 1 2001 2 2 0 2 2 0 2 2 2 2 2 2002 2 2 0 2 2 0 2 2 2 2 2 2003 0 0 0 0 0 0 2 0 0 0 0 2004 2 2 0 2 2 0 0 2 2 2 2 2005 2 2 0 2 2 0 2 2 2 2 2 2006 2 2 0 2 2 0 2 2 2 2 2 2007 2 2 0 2 2 0 2 2 2 2 2 2008 34 34 0 34 34 0 34 34 34 34 34 2009 25 25 0 25 25 0 23 25 25 25 25 2010 2 2 0 2 2 0 2 2 2 2 2 2011 3 3 0 3 3 0 3 3 3 3 3 2012 11 11 0 11 11 0 11 11 11 11 11
Table 2. Number of sites monitored yearly for trace element contamination in very fine sediments. Digestion techniques: strong acid digestion (sad) or total digestion (td) are specified and considered separately for Cr and Fe.