Semiautomated 3D Liver Segmentation Using
Computed Tomography and Magnetic Resonance
Imaging
par
Akshat Gotra, MD
Département de radiologie Faculté de médecine
Mémoire présenté à la Faculté de médecine en vue de l’obtention du grade de maîtrise
en sciences biomédicales option recherche clinique biomédicale
Août 2015
Le foie est un organe vital ayant une capacité de régénération exceptionnelle et un rôle crucial dans le fonctionnement de l’organisme. L’évaluation du volume du foie est un outil important pouvant être utilisé comme marqueur biologique de sévérité de maladies hépatiques. La volumétrie du foie est indiquée avant les hépatectomies majeures, l’embolisation de la veine porte et la transplantation.
La méthode la plus répandue sur la base d'examens de tomodensitométrie (TDM) et d'imagerie par résonance magnétique (IRM) consiste à délimiter le contour du foie sur plusieurs coupes consécutives, un processus appelé la «segmentation».
Nous présentons la conception et la stratégie de validation pour une méthode de segmentation semi-automatisée développée à notre institution. Notre méthode représente une approche basée sur un modèle utilisant l’interpolation variationnelle de forme ainsi que l’optimisation de maillages de Laplace. La méthode a été conçue afin d’être compatible avec la TDM ainsi que l' IRM.
Nous avons évalué la répétabilité, la fiabilité ainsi que l’efficacité de notre méthode semi-automatisée de segmentation avec deux études transversales conçues rétrospectivement. Les résultats de nos études de validation suggèrent que la méthode de segmentation confère une fiabilité et répétabilité comparables à la segmentation manuelle. De plus, cette méthode diminue de façon significative le temps d’interaction, la rendant ainsi adaptée à la pratique clinique courante.
D’autres études pourraient incorporer la volumétrie afin de déterminer des marqueurs biologiques de maladie hépatique basés sur le volume tels que la présence de stéatose, de fer, ou encore la mesure de fibrose par unité de volume.
Mots-clés : Foie, segmentation hépatique, volumétrie, imagerie 3D, validation, planification préopératoire, tomodensitométrie, imagerie par résonance magnétique, humains.
The liver is a vital abdominal organ known for its remarkable regenerative capacity and fundamental role in organism viability. Assessment of liver volume is an important tool which physicians use as a biomarker of disease severity. Liver volumetry is clinically indicated prior to major hepatectomy, portal vein embolization and transplantation.
The most popular method to determine liver volume from computed tomography (CT) and magnetic resonance imaging (MRI) examinations involves contouring the liver on consecutive imaging slices, a process called “segmentation”. Segmentation can be performed either manually or in an automated fashion.
We present the design concept and validation strategy for an innovative semiautomated liver segmentation method developed at our institution. Our method represents a model-based approach using variational shape interpolation and Laplacian mesh optimization techniques. It is independent of training data, requires limited user interactions and is robust to a variety of pathological cases. Further, it was designed for compatibility with both CT and MRI examinations.
We evaluated the repeatability, agreement and efficiency of our semiautomated method in two retrospective cross-sectional studies. The results of our validation studies suggest that semiautomated liver segmentation can provide strong agreement and repeatability when compared to manual segmentation. Further, segmentation automation significantly shortens interaction time, thus making it suitable for daily clinical practice.
Future studies may incorporate liver volumetry to determine volume-averaged biomarkers of liver disease, such as such as fat, iron or fibrosis measurements per unit volume. Segmental volumetry could also be assessed based on subsegmentation of vascular anatomy.
Keywords : Liver, Segmentation, Volumetry, 3D Imaging, Validation, Preoperative planning, Computed Tomography, Magnetic Resonance Imaging, Humans.
Résumé ... i
Abstract ... iii
Table of Contents ... v
List of Tables ... ix
List of Figures ... x
List of Appendices ... xii
List of Abbreviations and Symbols ... xiii
Dedication ... xv Acknowledgements ... xvi 1 Introduction 1 1.1 The Liver ... 2 1.2 Liver Volumetry ... 6 1.3 Liver Segmentation ... 9 1.4 Thesis Structure ... 11 2 Liver Volumetry 13 2.1 Liver Diseases ... 13 2.1.1 Viral Hepatitis ... 13
2.1.2 Alcoholic Liver Disease ... 14
2.1.3 Non-Alcoholic Fatty Liver Disease ... 15
2.1.4 Cirrhosis ... 16
2.1.5 Liver Cancer ... 17
2.2 Liver Volume as a Biomarker ... 19
2.3 Clinical Indications for Liver Volumetry ... 23
2.3.1 Future Liver Remnant (FLR) Prior to Major Hepatectomy ... 23
2.3.2 Portal Vein Embolization ... 28
2.4 Reference Methods for Liver Volumetry ... 33
2.4.1 Formula-based ... 33
2.4.2 Surgical Specimen ... 33
2.4.3 Manual Segmentation ... 35
2.5 Automated Liver Segmentation ... 36
2.5.1 Contour Optimization Techniques ... 37
2.5.2 Interactive Segmentation Techniques ... 39
2.5.3 Automated Segmentation Techniques ... 41
2.5.4 Advanced Segmentation Methods ... 44
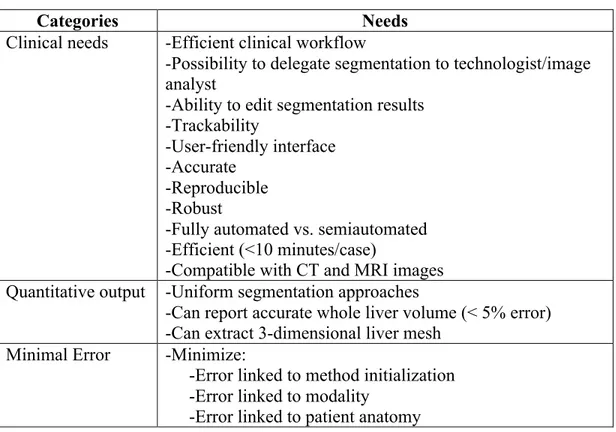
3 Segmentation Software 48 3.1 Software Concept ... 48 3.1.1 Clinical Needs ... 48 3.1.2 Quantitative Output ... 52 3.1.3 Sources of Error ... 53 3.2 Segmentation Method ... 59 3.2.1 Initialization Phase ... 60
3.2.2 Shape Deformation phase ... 63
3.2.3 Interactive Corrections Phase ... 66
3.3 Software Validation Strategy ... 67
3.4 Semiautomated Liver Segmentation on CT and MRI ... 68
3.4.1 Introduction ... 68
3.4.2 Materials and Methods ... 70
3.4.3 Results ... 71
3.4.4 Discussion ... 75
3.4.5 Limitations ... 76
3.4.6 Conclusion ... 77
4 Validation of a Semiautomated Liver Segmentation Method Using CT for Accurate Volumetry 78 4.1 Abstract ... 78
4.2 Introduction ... 79
4.3 Materials and Methods ... 81 4.3.1 Study Design ... 81 4.3.2 Study Subjects ... 81 4.3.3 CT Imaging Technique ... 82 4.3.4 Study Workflow ... 83 4.3.5 Manual Segmentation ... 84
4.3.6 Semiautomated Segmentation and Subsegmentation ... 84
4.3.7 Statistical Analysis ... 88 4.4 Results ... 89 4.4.1 Volumes ... 89 4.4.2 Variability ... 89 4.4.3 Repeatability ... 92 4.4.4 Agreement ... 92 4.4.5 Patients with HCC ... 95 4.4.6 Error Measures ... 95 4.4.7 Time ... 97 4.5 Discussion ... 97 4.5.1 Summary of Work ... 97 4.5.2 Main Findings ... 98 4.5.3 Liver Subsegmentation ... 102 4.5.4 Surgical Planning ... 102 4.5.5 Segmentation Error ... 103 4.5.6 Limitations ... 103 4.5.7 Conclusion ... 104
5 Comparison of MRI and CT-‐based Semiautomated Liver Segmentation: a Validation Study 105 5.1 Abstract ... 105
5.2 Introduction ... 106
5.2.1 Aims ... 107
5.3 Materials and Methods ... 108
5.3.2 Study Subjects ... 108 5.3.3 MRI Technique ... 109 5.3.4 CT Imaging Technique ... 110 5.3.5 Study Workflow ... 110 5.3.6 Manual Segmentation ... 111 5.3.7 Semiautomated Segmentation ... 111 5.3.8 Statistical Analysis ... 114 5.4 Results ... 115 5.4.1 Liver Volumes ... 115 5.4.2 Intra-reader Repeatability ... 116 5.4.3 Inter-Reader Agreement ... 117 5.4.4 Inter-Method Agreement ... 117 5.4.5 Clinical Examples ... 119
5.4.6 Error Measures with MRI ... 121
5.4.7 Error Measures with CT ... 123
5.4.8 Time ... 125 5.5 Discussion ... 125 5.5.1 Summary of Work ... 125 5.5.2 Main Findings ... 125 5.5.3 Segmentation Error ... 127 5.5.4 Limitations ... 127 5.5.5 Conclusion ... 128 6 Conclusion 130 6.1 Future Work ... 130 6.2 Closing Words ... 132 Bibliography cxxxiv Appendix cl
List of Tables
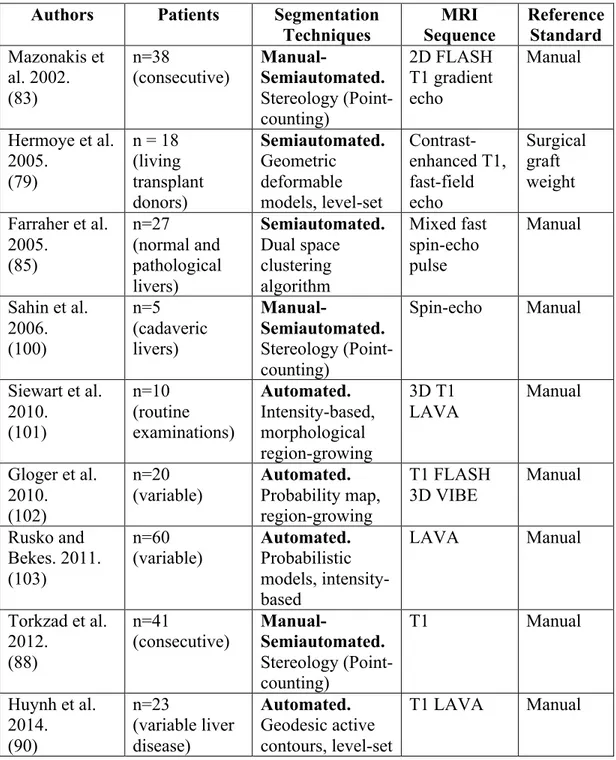
Table II.I: Types of biomarkers ... 20 Table II.II: Summary of advantages and limitations of various segmentation methods. ... 44 Table II.III: Summary of MRI-based liver segmentation techniques ... 46 Table III.I: Features expected from an automated liver segmentation solution ... 48 Table III.II: Comparison of segmentation performance measures ... 72 Table IV.I: Subject demographics ... 82 Table IV.II: Whole and segmental liver volumes by reader. ... 88 Table IV.III: Intra-reader repeatability, inter-reader and inter-method agreement
... 91 Table IV.IV: Segmentation performance measures ... 96 Table V.I: Subject Demographics ... 109 Table V.II: Intra-reader repeatability, inter-reader and inter-method agreement 116 Table V.III: Segmentation performance measures for MRI ... 122 Table V.IV: Segmentation performance measures for CT ... 124
List of Figures
Figure 1.1: 3D rendering of the liver and associated vascular structures ... 4
Figure 1.2: Couinaud classification of liver segments. ... 6
Figure 1.3: Variability in liver shape and size ... 8
Figure 1.4: Manual segmentation. ... 9
Figure 1.5: Dissertation roadmap. ... 11
Figure 2.1: Pathophysiology, risk factors and potential complications of NAFLD ... 16
Figure 2.2: Frequent CT imaging features in cirrhosis ... 17
Figure 2.3: Classical imaging finding in HCC ... 18
Figure 2.4: Types of major hepatectomy. ... 24
Figure 2.5: FLR/TLV ratio prior to hepatectomy. ... 25
Figure 2.6: Future liver remnant volume calculation in normal liver. ... 26
Figure 2.7: Future liver remnant volume calculation in fatty liver. ... 27
Figure 2.8: Future liver remnant volume calculation in cirrhotic liver. ... 28
Figure 2.9: FLR/TLV ratio prior to portal vein embolization. ... 29
Figure 2.10: Portal vein embolization prior to right hepatectomy ... 30
Figure 2.11: Size incompatibility in living donor liver transplantation. ... 32
Figure 2.12: Manual segmentation. ... 36
Figure 2.13: Automated liver segmentation outline. ... 37
Figure 2.14: Active contours technique. ... 38
Figure 2.15: Livewire technique ... 39
Figure 2.16: Seeded region-growing technique ... 40
Figure 2.17: Statistical shape models ... 42
Figure 3.1: Graphical interface for semiautomated liver segmentation. ... 50
Figure 3.2: Initialization errors ... 54
Figure 3.3:. Imaging pitfalls which may degrade liver segmentation on MRI. .... 57
Figure 3.4: Imaging pitfalls which may limit liver segmentation on CT. ... 58
Figure 3.7: Variational shape interpolation. ... 63
Figure 3.8: Feature matching strategy ... 65
Figure 3.9: Interactive correction tools ... 67
Figure 3.10: Common liver segmentation pitfalls on CT and MRI. ... 70
Figure 3.11: Examples of segmentation results. ... 74
Figure 4.1: Overview of steps in CT-based semiautomated liver segmentation. .. 85
Figure 4.2: Liver Subsegmentation. ... 87
Figure 4.3: Inter-method agreement. ... 93
Figure 4.4: Concordant liver segmentation. ... 94
Figure 4.5: Discordant liver segmentation. ... 94
Figure 4.6: 3D surface distance error. ... 97
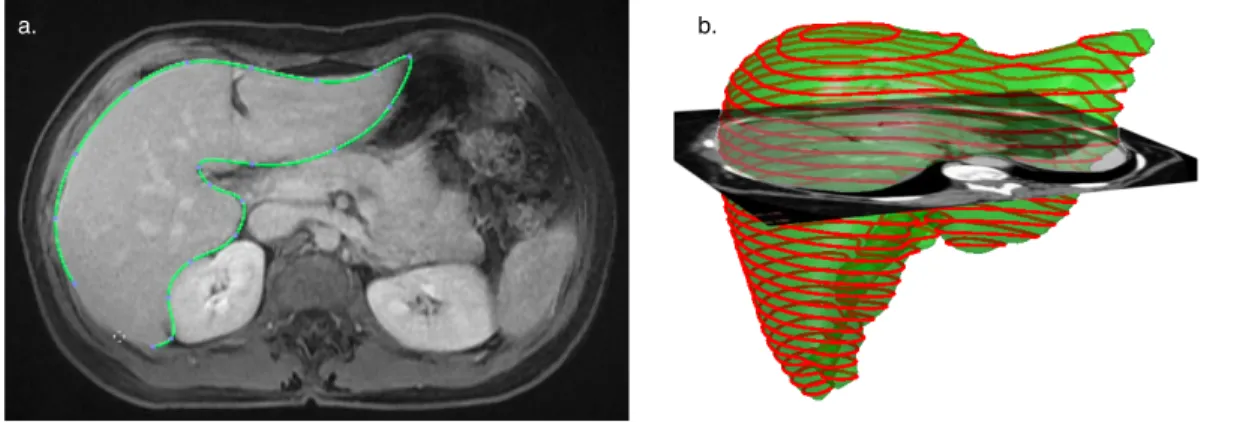
Figure 5.1: Semiautomated liver segmentation of CT and MRI images. ... 114
Figure 5.3: Inter-method agreement (Semiautomated CT vs. manual CT). ... 119
Figure 5.4: Concordant liver segmentation. ... 120
Figure 5.5: Discordant liver segmentation. ... 120
Figure 6.1: Liver subsegmentation according to vascular anatomy. ... 130
List of Appendices
Appendix 1. Segmentation Performance measures. ... cl Appendix 2. Manuscript: Validation of a Semiautomated Liver Segmentation Method Using CT for Accurate Volumetry. ... clii
3D = Three-dimensional
ASD = Average symmetric surface distance
BSA = Body surface area
CI = Confidence interval
CT = Computed tomography
DICOM = Digital Imaging and Communications in Medicine FLASH = Fast low-angle shot sequence
FLR = Future liver remnant
GRE = Gradient-recalled echo
HCC = Hepatocellular carcinoma
ICC = Intraclass correlation coefficient
IRM = Imagerie par résonance magnétique
IVC = Inferior vena cava
LAVA = Liver acquisition with volume acceleration
LIO = Laboratoire de recherche en imagerie et orthopédie LI-RADS = Liver Imaging Reporting and Data System
MDCT = Multi-detector computed tomography
MPR = Multi-planar reconstruction
MRI = Magnetic resonance imaging
MRS = Magnetic resonance spectroscopy
MSD = Maximum symmetric surface distance
NAFLD = Nonalcoholic fatty liver disease NASH = Nonalcoholic steatohepatitis PDFF = Proton density fat fraction
PVE = Portal vein embolization
RBF = Radial basis function
RMSD = Root mean square symmetric surface distance
RVD = Relative volume difference
SD = Standard deviation
SSM = Statistical shape models
TDM = Tomodensitométrie
TLFI = Total liver fat index
TLV = Total liver volume
VOE = Volumetric overlap error
VIBE = Volumetric interpolated breath-hold examination
For my mother and father who have selflessly sacrificed to allow us to achieve.
Acknowledgments
I am immensely grateful to my research supervisor and mentor, Dr. An Tang. At a time of uncertainty you provided solid ground in the form of a carefully considered and meticulously organized research program. I thank you for the hours spent vigilantly reviewing my manuscripts and presentations despite a burgeoning research career and numerous other commitments. You were an exceptional teacher during these formative years.
I feel tremendously privileged to have worked with Gabriel Chartrand who was largely responsible for developing the liver segmentation software described in this dissertation. Many of the renderings seen on these pages are a result of his visual artistry. Without your help, these studies would not have been possible. I am glad I was able to work with you during the early stages of what will surely be a brilliant career.
I am thankful to have met and worked with members of the Laboratoire de recherche en imagerie et orthopédie (LIO) in Montreal, Quebec. In particular, thanks to Dr. Jacques A. de Guise and Ramnada Chav for providing resources and guidance while making me feel welcome in the laboratory.
I am grateful to Dr. Jeffrey Chankowsky and Dr. Benoît Gallix from McGill University for being supportive of my Masters degree requirements during formal residency training. Your continued clinical guidance and mentorship is greatly appreciated.
I am indebted to Dr. Gilles Soulez, Dr. Samuel Kadoury and Dr. Gallix for serving as jury members for my Masters thesis.
Finally I would like to thank my parents, Amar Gotra and Kusum Nehru, and my brother Anuj for their continued love and support. This dissertation is dedicated to you.
1
Introduction
This dissertation introduces an original software approach to 3-dimensional liver segmentation from multi-planar imaging. The sophistication of modern imaging techniques allow the physician to visualize human anatomy in an unparalleled fashion. Images generated from modalities such as computed tomography (CT) and magnetic resonance imaging (MRI) are of higher quality, acquired faster and provide wider coverage than in prior years. This has led to a surge in the amount of data that must be scrutinized during each imaging examination.
The scientific community has countered with computer-aided tools, which assist the physician in efficiently extracting relevant information from each imaging exam. One such image processing tool consists of delineation of a region of interest on CT and MRI images for volumetric analysis. This process is called
segmentation and its optimization has been a research focus over decades within
the biomedical field.
Organ segmentation has a variety of medical applications ranging from surgical simulation to radiotherapy planning. The medical literature describes numerous segmentation methods and algorithms adapted for different target organs. The liver remains one of the most challenging organs to efficiently segment due to, among other reasons, its highly variable shape and close proximity to other organs and tissues.
Segmentation has traditionally been performed by manually outlining the liver contour on each individual CT or MRI image. Given the hundreds of images acquired on each examination, the manual method is too time-consuming and cumbersome for daily clinical use. Segmentation automation is essential to improve time-efficiency without sacrificing volumetric accuracy and repeatability. The primary aim of this thesis is to describe the development and validation of an innovative semiautomated liver segmentation method developed at our
SECTION 1.INTRODUCTION
institution. We wish to assess the method's accuracy, repeatability and efficiency in segmenting both CT and MRI examinations.
1.1
The Liver
"He bound devious Prometheus with inescapable harsh bonds, fastened through the middle of a column, and he inflicted on him a long-winged eagle, which ate his immortal liver, but it grew as much in all at night as the long-winged bird would eat all day."
- Hesiod's Theogony (1)
Prometheus is a Titan from Greek mythology known for gifting mankind with fire stolen from Mount Olympus. As punishment, he was chained and condemned to having an eagle eternally feast on his liver. The legend specifies that his "immortal liver" would grow each night, suggesting that the ancient Greeks were aware of the liver's regenerative capacity (2). The metaphorical significance of the liver has been highlighted in other texts where it is equated with the eternal soul and with intelligence (3).
Evolutionary events have indeed imparted the liver with a remarkable capacity to regenerate following loss of mass in vertebrates (4). This is likely a result of the essential bodily functions the liver performs and its fundamental role in organism viability. This regenerative capacity had been mythologized since ancient times.
While liver divination may not be as popular today, the liver's role as a vital organ is definitely recognized. The liver is the largest human organ and is located in the right upper quadrant of the abdomen, below the diaphragm, adjacent to the stomach and overlying the gallbladder. The hepatocyte is the basic metabolic cell of the liver. Millions of hepatocytes constitute the lobule, which is the basic functional unit. The liver is known to have a role in roughly 500 vital bodily functions (5). Though out of the scope of this dissertation, some of these
roles include: digestion (bile production), metabolism (i.e. proteins, carbohydrates, lipids), synthesis (i.e. albumin, hormones), storage (i.e. glycogen, vitamins), detoxification (i.e. alcohol, drugs) and immunity (5).
The liver is closely associated with three major blood vessels: the hepatic artery, the portal vein and the inferior vena cava (IVC). The hepatic artery supplies the liver with oxygenated blood stemming from the abdominal aorta. The portal vein supplies the liver with nutrient-rich blood derived from gastro-intestinal organs (i.e. stomach, small bowel and colon). These two vessels along with the common bile duct enter the liver through a deep fissure at its inferior surface known as the porta hepatis, or simply, the liver hilum.
Every liver lobule is supplied by a tributary of the hepatic artery, portal vein and common bile duct. Each lobule is drained by a branch of the hepatic veins, and subsequently, the IVC. The IVC is a retroperitoneal structure that runs along the right side of the vertebral column, lateral to the aorta (Figure 1.1). The right, middle and left hepatic veins drain into the IVC at the level of thoracic vertebrae eight.
SECTION 1.INTRODUCTION
Figure 1.1: 3D rendering of the liver and associated vascular structures
Basic anatomical structure of the liver and spatial relationship with major vascular structures; the aorta and branches (red) and the IVC and hepatic veins (blue/yellow). The three hepatic veins are pictured draining into the IVC, a retroperitoneal structure. This usually occurs at the level of thoracic vertebrae eight. Image courtesy of Gabriel Chartrand.
Couinaud classification
Claude Couinaud introduced the Couinaud classification system in 1957 (6). The system describes functional liver anatomy by dividing the liver into eight independent segments. Each segment has its own respective vascular inflow, outflow, biliary and lymphatic drainage. This segmental classification is of particular importance during surgical planning as independent segments may be resected without affecting the remaining ones. Further, using a common classification system allows for simple communication between physicians from different specialties when describing focal liver lesions (7). The eight functional segments are separated based on vascular anatomy as follows:
1. The horizontal plane of the portal vein bifurcation divides the liver into upper and lower sections.
2. The vertical plane of the middle hepatic vein divides the liver into two halves, establishing the right liver and the left liver.
3. The right hepatic vein divides the right liver into anterior and posterior segments.
4. The left hepatic vein divides the left liver into medial and lateral segments.
Though Couinaud initially described segments based on portal vein branching, the working system is actually based on the three hepatic veins (7). Segment I (caudate lobe) is formed by the liver tissue located between the portal bifurcation and the IVC. The remainder of the segments (II to VIII) are numbered in a clockwise fashion (Figure 1.2).
SECTION 1.INTRODUCTION
Figure 1.2: Couinaud classification of liver segments.
The portal vein bifurcation establishes a horizontal plane dividing the liver into upper and lower sections. The middle hepatic vein divides the liver into the right (white) and left liver (orange). Segments II-VIII are numbered clockwise beginning at segment II (8).
1.2
Liver Volumetry
The liver is subject to variety of diverse pathology which is often debilitating to the individual patient. Medical and surgical treatments offered for these pathologies range from pharmaceutical management to surgical excision or transplant. Assessment of liver volume represents a basic tool which physicians often use for diagnosis of diffuse or metastatic liver disease that may present as hepatomegaly.
The need for accurate liver volumetry has been expressed in both medical and surgical contexts. Medically, the liver volume is known to be an important prognostic indicator in compensated cirrhosis (9) and fulminant liver failure (10).
VII!
VIII!
IV!
II!
III!
V!
VI!
I!
VII!
VIII!
IV!
II!
III!
V!
VI!
I!
VII!
VIII!
IV!
II!
III!
V!
VI!
I!
VII!
VIII!
IV!
II!
III!
V!
VI!
I!
a.!
b.!
c.!
d.!
Linguraru et al. also recently described the clinical significance of volumetry in assessing hepatomegaly (11).
In the surgical context, liver volumetry is essential during hepatectomy planning to ensure residual liver regeneration and prevent post-operative hepatic failure (12). The importance of volumetry in surgical planning for orthotopic liver transplantation (13) and living-donor liver transplantation (14-17) has been emphasized. Other local liver interventions including radiotherapy, radio-frequency ablation and cryo-ablation may also require liver volume assessment prior to treatment (18), especially if the patient has previously undergone hepatectomy.
The role of liver volume as a potential biomarker for liver disease and the established clinical indications for volumetry are described in Sections 2.2 and 2.3, respectively.
Traditionally, liver size has been estimated crudely. Medical students are taught early in training how to inspect, palpate, percuss and auscultate the abdomen in order to elicit pathological involvement. The standard physical exam includes a measurement of liver size using manual palpation and percussion to identify the liver margins (19).
Liver size varies greatly and is dependent on a variety of factors including: age, body size, shape, underlying pathology and more importantly, the examination technique used (i.e. palpation, percussion or radiographic). In 1977, the mean liver size was thought to be 7 cm for women and 10.5 cm for men, a liver span of two to three centimeters smaller or larger by physical exam being considered abnormal (20). Techniques measuring one-dimensional length are often criticized as they are rudimentary and subject to significant variability depending on underlying liver shape, pathology and degree of lung inflation. Further, livers of different shape and volume may have the same cranial-caudal length (Figure 1.3).
SECTION 1.INTRODUCTION
Figure 1.3: Variability in liver shape and size
Livers of different shape and volume may have the same cranial-caudal length, as demonstrated with these three examples. This observation highlights the limitation of reporting a one-dimensional measures of length, a well-entrenched practice, as a surrogate measure of liver volume. Image courtesy of Dr. An Tang.
The advent of modern cross-sectional imaging techniques provided additional tools to estimate liver volume. Assessment of whole liver volume using CT was initially demonstrated in 1979 as a means to compare the effect of portosystemic shunts on hepatic structure and function (21). Heymsfield et al. measured the volume of a cadaveric liver using CT images and showed a discrepancy of less than 5% with volume obtained from the water displacement method (21).
Today, CT and MRI are commonly used to meet the clinical need of accurate estimation of liver volume. Use of CT is often preferred due to its easier accessibility, high spatial resolution, robustness and short acquisition time (14, 22, 23). MRI offers multiple contrast mechanisms and ability to simultaneously assess vascular anatomy, biliary anatomy and liver parenchymal pathology (24). Further, MR imaging minimizes the risk of radiation exposure and nephrotoxicity which are concerns for CT imaging (24, 25).
The most popular method to determine liver volume from CT and MRI images involves contouring the liver outline on consecutive imaging slices, a process called “segmentation”. Segmentation refers to delineation of a region of interest from the background.
1.3
Liver Segmentation
In vivo assessment of liver volume is problematic as it is impossible to
directly obtain an exact measurement. As explanting an organ from a living being would be unrealistic, indirect measurements via imaging post-processing tools are sought. Segmentation software indirectly measures volume by identifying the number of voxels, or the smallest distinguishable box-shaped parts of a 3D space, belonging to an organ of interest. The volumetric error is thus directly proportional to the error associated with identification of voxels.
A common approach used in image segmentation consists of demarcating the contours of a structure of interest to identify the number of enclosed voxels. Despite significant technical advances in the field of image processing, this segmentation is often performed manually in the clinical setting (Figure 1.4). The manual segmentation of a liver from CT or MRI images must be performed on each axial slice and can take an image analyst anywhere from 30 to 90 minutes (26). It is time-consuming, cumbersome and expensive and thus not ideal for busy clinical practice.
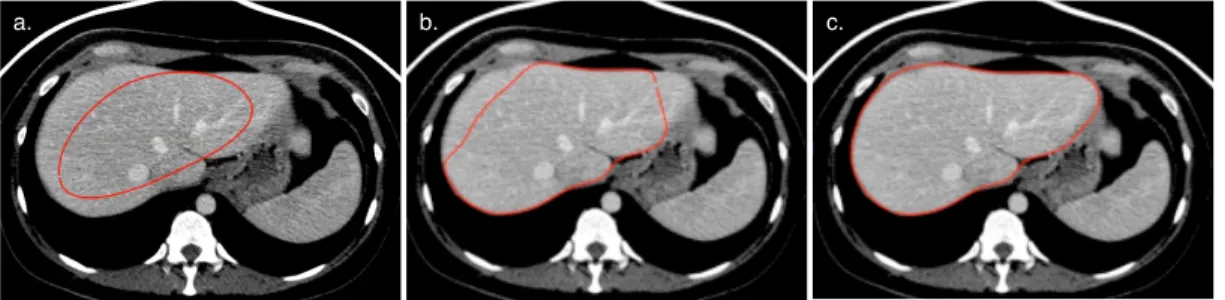
Figure 1.4: Manual segmentation.
Three selected axial images from a contrast enhanced CT examination demonstrating segmentation of liver contours. Segmentation is performed to enclose the voxels belonging to a structure of interest and indirectly measure volume.
SECTION 1.INTRODUCTION
Alternatively, liver segmentation methods requiring minimal to no user input have been a research focus in the field of biomedical engineering for decades. Though numerous studies have proposed semi- or fully-automated segmentation methods, these have not necessarily translated to routine clinical use (27). Limited clinical validation studies for these methods, rather than lack of technical ingenuity, are cited as the cause of this slow adaptation by the medical community (28).
In their study, Udupa et al. classified the weaknesses of image segmentation algorithm evaluation frameworks into two categories: related to available resources or related to the employed methodology (28). Reasons thought to limit the performance of segmentation algorithms include: small sample sizes, data sets not reflective of clinical problems, inappropriate ground truth for comparison and poorly defined performance metrics (27, 28).
In order to overcome these methodological weaknesses, a validation framework for a novel automated segmentation method should include, at minimum, the following elements (28):
1. Use of a valid reference standard.
2. Datasets for validation which are reflective of actual clinical practice; real cases rather than ideal cases.
3. Clear metrics for measurement of segmentation precision, accuracy, efficiency and error.
4. Comparison of metrics for each method using effective statistical tools.
We attempted to incorporate these defined elements in the validation of our novel segmentation method.
1.4
Thesis Structure
This dissertation has been written in such a manner that it is relevant to a broad range of readers including medical students, radiologists, hepatologists, hepatobiliary surgeons and biomedical engineers.
Figure 1.5 provides a roadmap to the material covered in various sections. Medical students should read this document sequentially. Radiologists will be most interested in the figures and tables accompanying the text and may peruse these in sequential order to find areas of interest. Physicians with intimate knowledge about liver disease and clinical indications for liver volumetry may proceed directly to Section 3. Those specifically interested in the clinical validation steps should focus on Sections 4 and 5. Figure 1.5: Dissertation roadmap. Section 2 Liver Volumetry Section 3 Segmentation Software Section 4 CT validation Section 5 CT and MRI validation Section 6 Conclusion Future Work
SECTION 1.INTRODUCTION
Section Descriptions
• Section 2 summarizes the most common liver diseases currently affecting those living in the Western world. Liver volume is defined as a biomarker which can be used in the management and treatment of these diseases. The most common clinical indications for performing liver volumetry are reviewed. Finally, manual and automated liver volumetry methods are introduced.
• Section 3 introduces the design concept and workflow of the semiautomated liver segmentation software developed at our institution. The three main steps required to perform segmentation: initialization, optimization and correction are described in detail. The final section describes a proof of concept study where the multi-modality versatility of the segmentation method was tested using CT and MRI datasets.
• Section 4 describes a retrospective, cross-sectional study which evaluated our segmentation method on patients who underwent contrast-enhanced CT prior to major hepatectomy between October 2006 and April 2009. This study was an initial validation step of our method for CT-based imaging.
• Section 5 describes a retrospective, cross-sectional study which evaluated our segmentation method on subjects who required preoperative evaluation with both CT and MRI within two weeks between January 2010 and March 2013. This study compared the results obtained from semiautomated segmentation of CT and MRI images.
• Section 6 summarizes the lessons learned during this research process, the challenges ahead and points to future research directions.
2
Liver Volumetry
2.1
Liver Diseases
The liver is intimately involved in most vital processes taking place within the human body. Consequently, a variety of chronic infections and diseases can pathologically affect it. In March 2013 the Canadian Liver Foundation commissioned a report entitled "Liver Disease in Canada, a Crisis in the Making", which assessed the extent of liver disease affecting the Canadian population (29). The report estimates that one in ten Canadians have some form of liver disease and the related death rate has risen nearly 30% over eight years (29).
More than 95% of all deaths from liver disease are attributable to either viral hepatitis, alcoholic liver disease, non-alcoholic fatty liver disease (NAFLD), cirrhosis or hepatocellular carcinoma (HCC). These disease processes ultimately result in the need for medical treatment, liver transplantation or hepatectomy and represent important global health concerns.
2.1.1 Viral Hepatitis
Viral hepatitis refers to liver inflammation and injury secondary to viral infection. Of the offending viruses, hepatitis B and C most commonly infect the liver causing extensive mortality and morbidity (29). Both are blood-borne infections which spread through close contact with infected body fluids.
Hepatitis B is a double-stranded DNA virus of the Hepadnaviridae family. By definition, an acute hepatitis B infection lasts six months or less without any permanent damage to hepatocytes and with development of future immunity. A chronic hepatitis B infection lasts longer than 6 months and is usually life-long. Untreated chronic infection may eventually lead to cirrhosis in 15-20% of cases (29). Primary liver cancer develops with an incidence of 0.2-0.6% in the non-cirrhotic/hepatitis B population and 5-8% in the non-cirrhotic/hepatitis B population
SECTION 2.LIVER VOLUMETRY
(29). Chronic hepatitis B is highly prevalent (5-12%) amongst Canadian immigrant populations (30, 31). Treatment of chronic infection with anti-viral medications can improve liver function, reduce progression of fibrosis and cirrhosis and reduce the risk of HCC development. All Canadian provinces have instituted either neonatal or adolescent universal vaccination programs against hepatitis B (29).
Hepatitis C is single-stranded RNA virus of the Flaviviridae family. Acute infection with hepatitis C is rarely symptomatic. Failure to spontaneously clear the infection leads to chronic infection, with possible progression to cirrhosis and liver failure. Liver failure secondary to chronic hepatitis C infection represents the most common indication for liver transplantation in Canada (29). At time of reporting, hepatitis C has a peak prevalence in middle-aged individuals aged 30-59 years. Hepatitis C is considered a curable disease with anti-viral treatment regimens including interferon alpha, ribonucleic acid analogs (Ribavirin) and protease inhibitors. Cure rates range from 60-75% depending on the genotype and treatment length (29). No vaccination strategies currently exist against Hepatitis C, although several are in development (32).
2.1.2 Alcoholic Liver Disease
Alcoholic liver disease results from excessive alcohol consumption and represents an important cause of worldwide morbidity and mortality. Alcohol causes damage to hepatocytes directly as a toxic substance and indirectly by promoting hepatitis C infection and insulin resistance with subsequent fatty liver disease (29).
Alcoholic liver disease exists in two main forms: acute alcoholic hepatitis and alcoholic cirrhosis. Alcoholic hepatitis is usually characterized by acute clinical and biochemical evidence of liver failure. In the context of pre-existing cirrhosis, this condition can be fatal. Lesser but prolonged drinking can lead directly to
alcoholic cirrhosis, which has a very poor prognosis as 47% of those afflicted die within 5 years (28).
2.1.3 Non-Alcoholic Fatty Liver Disease
Non-Alcoholic Fatty Liver Disease (NAFLD) is an infiltrative disease of the liver associated with obesity and type 2 diabetes. NAFLD is linked to a group of conditions collectively termed the "metabolic syndrome". This syndrome is characterized by a resistance to insulin that favors the intracellular accumulation of fatty acids and triglycerides (33). Fatty acids are known to cause oxidative stress by stimulating stellate cells responsible for hepatic injury and fibrosis, eventually leading to cirrhosis (34). NAFLD is currently the most common liver disease affecting the Canadian population (29).
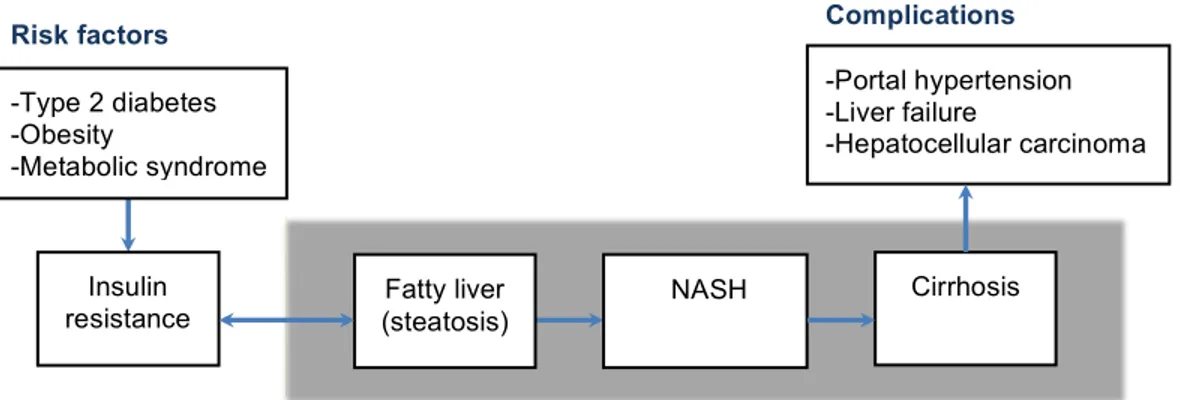
This disease evolves through a spectrum of three main stages. The initial stage is steatosis, a broad term denoting fat accumulation within the liver without significant inflammation or fibrosis. The second stage is non-alcoholic steatohepatitis (NASH), where fat accumulation is associated with inflammatory changes and scarring. Of the patients who evolve to NASH, half will develop liver fibrosis, whereas nearly 20% will experience either cirrhosis or liver failure (35, 36). Cirrhosis represents the third stage of the disease. The stages and complications of NAFLD are outlined in Figure 2.1.
SECTION 2.LIVER VOLUMETRY
Figure 2.1: Pathophysiology, risk factors and potential complications of NAFLD The main stages of NAFLD (i.e. steatosis, NASH and cirrhosis) are outlined in yellow. The major risk factors for NAFLD (i.e. type 2 diabetes, obesity and metabolic syndrome) are associated with insulin resistance. Insulin resistance promotes the intracellular accumulation of fatty acids which can eventually lead to hepatic injury, fibrosis and cirrhosis. Cirrhosis and associated complications are discussed in Section 2.1.4. Image courtesy of Dr. An Tang.
2.1.4 Cirrhosis
Cirrhosis represents the end-stage of many chronic liver diseases which cause necrosis of hepatocytes through a variety of insults (i.e. viruses, alcohol, fat). Pathologically, the characteristics findings in cirrhosis are: fibrosis, nodular regeneration and distortion of hepatic architecture (37). Eventually, functional liver tissue is replaced by non-functional scar tissue leading to liver failure.
Other complications of cirrhosis include: increased pressure in the venous system draining to the liver (portal hypertension) leading to bleeding from distended veins into the GI system (variceal bleeding), fluid accumulation in the abdominal cavity (ascites) and behavioral changes due to accumulation of toxic metabolites (hepatic encephalopathy) (29). Cirrhotic patients have a per-year risk of 1-8% for developing HCC (29). The clinical severity of cirrhosis is assessed by the Child-Pugh scoring system to advise clinical decisions regarding transplantation or hepatectomy.
Exposé du projet de recherche Tang, An TANAN0951
24/08/15 Page 2/24
Metformin is recommended as the initial treatment for type 2 diabetes15, 16. This medication has also been
proposed as an effective agent for the treatment of NAFLD. Cases series including healthy volunteers showed improvement in alanine aminotransferase (ALT) values, liver histology or qualitative measurements of fatty infiltration17-20. However, in a randomized controlled trial that studied patients with type 2 diabetes, metformin had a neutral effect on liver fat infiltration (13 % fat fraction before treatment, 14 % after
treatment, NS) 21.
Whenever glycemic target are not reached with oral hypoglycemic agents, insulin can be
introduced15. However, insulin causes weight gain, is considered lipogenic and shown to promote steatosis
when administered as an IV infusion22. Unexpectedly, a recent pilot study of the combined treatment with
metformin and subcutaneous insulin has shown conflicting results. Indeed, a 45% reduction in steatosis was observed after 3 months of insulin14. To date, because of a lack of published information on steatosis
response to insulin therapy, it has been difficult to predict the impact of insulin on fatty liver.
In the light of the obvious limitation carried by metformin and insulin, pioglitazone appears to be an appealing alternative for patients who have both type 2 diabetes and fatty liver disease. Pioglitazone decreases insulin resistance, improves glucose and lipid metabolism. Agents from the thiazolidinedione
(TZD) class (troglitazone, rosiglitazone, and pioglitazone) have been associated with steatosis reduction
between 39% and 51% after 3-6 months of therapy21, 23, 24. In a placebo-controlled trial in subjects with type
2 diabetes with NASH, the administration of pioglitazone led to metabolic and histologic improvements13. Update as of May 10, 2011
On April 26, 2011, Lewis et al. published the preliminary results of a longitudinal cohort study of an increased risk of bladder cancer among pioglitazone users of >24 months of therapy (RR 1.4 [1.03-2.0])25.
Although the FDA have not yet completed their safety review of pioglitazone (Actos; Takeda Pharmaceuticals), we prefer to change medication class before patient enrollment.
-Type 2 diabetes -Obesity
-Metabolic syndrome
Insulin
resistance (steatosis) Fatty liver
NASH Risk factors Cirrhosis -Portal hypertension -Liver failure -Hepatocellular carcinoma Complications
Radiographic findings in advanced cirrhosis include hypertrophy of liver segments I, II and III with concurrent atrophy of segments VI and VII, likely related to alteration in hepatic blood flow (37). Frequent imaging features of cirrhosis seen on CT are outlined in Figure 2.2.
Figure 2.2: Frequent CT imaging features in cirrhosis
Imaging features in cirrhosis include: surface nodularity, widening of fissures and spaces (i.e. periportal, pericholecystic), atrophy of right anterior and left medial segments, hypertrophy of lateral segment, blunting of liver edges, posterior notching and anterolateral flattening. Other features include presence of regenerative nodules, siderotic nodules and secondary signs of portal hypertension. Image courtesy of Dr. An Tang.
2.1.5 Liver Cancer
Hepatocellular Carcinoma
Hepatocellular carcinoma represents the most common primary liver malignancy, constituting roughly 85% of all primary liver cancers (29). HCC typically develops in the context of cirrhosis. Major risk factors include: hepatitis B and C infection, alcoholism, biliary cirrhosis, food toxins, congenital biliary atresia, hemochromatosis, alpha-1 antitrypsin deficiency, type 1 glycogen storage disease and Wilson's disease (38). Both the incidence and associated mortality of
Nodular contour!
Segmental! atrophy!
Widened fissure! Expanded gallbladder fossa!
Right posterior hepatic notch!
Blunt edges! Anterior flattening!
Morphology!
Nodular contour! Segmental! atrophy! Widened fissure! Expanded gallbladder fossa!Right posterior hepatic notch!
Blunt edges! Anterior flattening!
SECTION 2.LIVER VOLUMETRY
HCC have been increasing in Canada (29). This is partly attributed to more widespread hepatitis infections (39).
The Liver Imaging Reporting and Data System (LI-RADS) is an imaging classification system developed specifically for liver lesions (40). The LI-RADS score indicates the relative risk of a lesion being HCC in the context of predisposing risk factors, such as cirrhosis. Major imaging criteria for diagnosis of HCC include: arterial phase hyper-enhancement, portal venous or delayed venous phase washout, presence of capsule appearance and a specific pattern of threshold growth (40). An example of HCC with classic imaging findings is shown in Figure 2.3.
Figure 2.3: Classical imaging finding in HCC
A lesion highly suspicious for HCC is noted within the left lobe of the liver. The lesion displays characteristics imaging features of HCC: arterial phase hyperenhancement, contrast washout in portal venous and delayed phases, peripheral rim of smooth hyperenhancement in portal venous and delayed phases (capsule) and threshold growth (new lesion larger than 10mm represents threshold growth) (40). Image courtesy of Dr. An Tang.
Experts recommend screening for patients at high risk for developing HCC as cure rates associated with early diagnosis (prior to symptoms) approach 90% (29).
Pre!
Arterial!
Portal Venous!
Delayed!
T2w!
T1w!
#1!
3.3 cm!
In North America, screening every six months with ultrasound examination is recommended for patients at sufficient risk (41). Common treatment options for HCC include partial hepatectomy, transplantation, ablation techniques, trans-arterial chemoembolization (TACE), chemotherapy, radiotherapy and palliative therapy.
Metastases
Metastases to the liver are very common, with studies suggesting that they occur 18-40 times more often than primary liver tumours (42). The most common sites that metastasize to the liver are: gastro-intestinal organs draining via the portal vein (i.e. colorectal, pancreatic, esophageal, gastric, neuroendocrine, gastrointestinal stromal), genitourinary (i.e. ovarian, renal, endometrial), breast, lung, melanomas and sarcomas (43).
Experience from colorectal carcinoma (CRC) can be used to demonstrate the burden of hepatic metastases. CRC represents the third most common cancer in the Western world (44). The liver represents the most common site of metastases with roughly 50% of patients with CRC developing hepatic metastases (44, 45). Hepatic metastases will be the main cause of mortality in two-third of patients with CRC (44).
2.2
Liver Volume as a Biomarker
Biomarkers
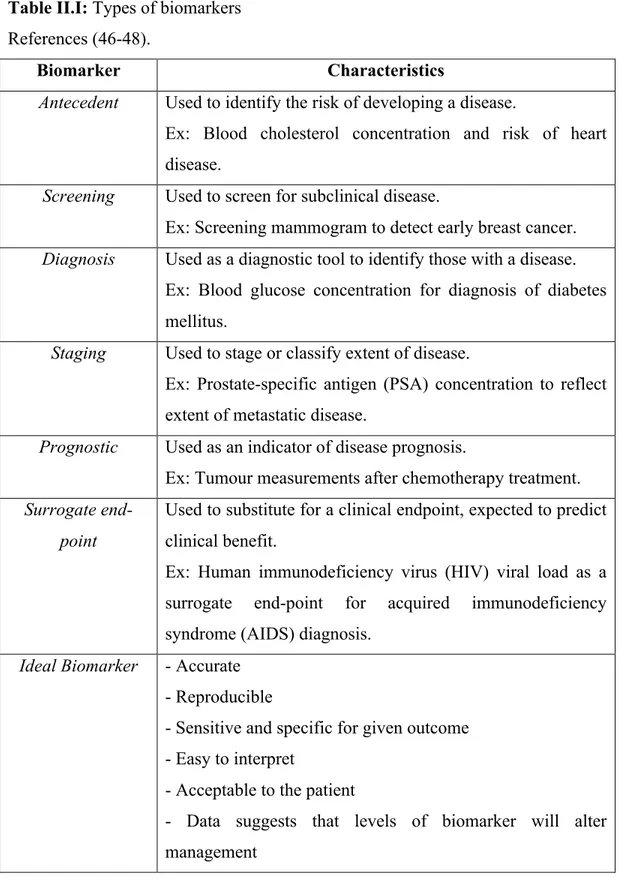
A biomarker is defined by the National Institutes of Health (NIH) as: "a characteristic that is objectively measured and evaluated as an indicator of normal biological processes, pathogenic processes, or pharmacologic responses to a therapeutic intervention" (46). Various types of biomarkers and their characteristics are summarized in Table II.I. The characteristics of an ideal biomarker, regardless of intended purpose, are also described.
SECTION 2.LIVER VOLUMETRY
Table II.I: Types of biomarkers References (46-48).
Biomarker Characteristics
Antecedent Used to identify the risk of developing a disease.
Ex: Blood cholesterol concentration and risk of heart disease.
Screening Used to screen for subclinical disease.
Ex: Screening mammogram to detect early breast cancer.
Diagnosis Used as a diagnostic tool to identify those with a disease. Ex: Blood glucose concentration for diagnosis of diabetes mellitus.
Staging Used to stage or classify extent of disease.
Ex: Prostate-specific antigen (PSA) concentration to reflect extent of metastatic disease.
Prognostic Used as an indicator of disease prognosis.
Ex: Tumour measurements after chemotherapy treatment.
Surrogate end-point
Used to substitute for a clinical endpoint, expected to predict clinical benefit.
Ex: Human immunodeficiency virus (HIV) viral load as a surrogate end-point for acquired immunodeficiency syndrome (AIDS) diagnosis.
Ideal Biomarker - Accurate - Reproducible
- Sensitive and specific for given outcome - Easy to interpret
- Acceptable to the patient
- Data suggests that levels of biomarker will alter management
Liver Volume as a biomarker
The development of biomarkers for liver disease represents a growing research field within hepatology. The significant worldwide burden of liver disease, the late manifestations of symptoms with advanced disease, an intrusive reference test (liver biopsy) and the lack of validated tools to assess therapeutic efficacy are promoters of such research (49).
Liver volume determined from imaging examinations represents a non-invasive tool which has been explored in studies as a potential biomarker. For example, it is standard clinical practice to consider the future liver remnant (FLR) as a surrogate for hepatic reserve prior to hepatectomy (see Section 2.3.1).
Okazaki et al. assessed whether liver segment volume indexes calculated from MRI examinations varied in different forms of cirrhosis (50). They found that enlargement of the caudate lobe was more frequent in alcoholic cirrhosis than in virus-induced cirrhosis.
Zhou et al. explored the correlation between hepatic lobe volume variations in patients with virus-induced cirrhosis and severity of disease on 16-slice MDCT (51). They found that volume enlargement of the left lateral segment was absolute in Child-Pugh class A and B patients while enlargement of the caudate lobe was absolute in Child-Pugh class A patients.
Bora et al. elicited a positive correlation between hepatosteatosis and liver volume in patients with non-alcoholic fatty liver disease (52).
Crippin et al. investigated whether liver volume for ideal body weight could serve as a prognostic indicator in patients with cirrhosis (53). They found that liver volume could indeed predict survival in patients with cirrhosis caused by hepatocellular disease. Patients with smaller volumes had a statistically significant increase in transplant or death while those with larger volumes had a statistically significant survival advantage.
SECTION 2.LIVER VOLUMETRY
Imaging-based biomarkers
Imaging based techniques have recently been investigated as biomarkers of diffuse liver disease. For example, studies have attempted to quantify hepatic fat using MRI-based methods. These methods are non-invasive and may be as accurate and reproducible as liver biopsy, the current gold standard. Given the prevalence of NAFLD, early steatosis detection and measurement are crucial to institute appropriate management.
Liver biopsy is considered the gold standard for diagnosis of hepatic steatosis but has several limitations: it is invasive, has poor patient acceptance, has a risk of hospitalization of 1-5% and mortality rates between 0.01-0.1% (54-56). Further, it is prone to inter-observer variability and sampling errors (57). For these reasons, it is not considered acceptable for routine use in the fatty liver disease population. A reliable, reproducible and accurate method for fat quantification is thus needed.
Imaging-based techniques have emerged to assess liver fat content using magnetic resonance spectroscopy (MRS) (58, 59) and MRI (60-62). These techniques exploit the fact that fat resonates at a lower frequency than water when subjected to a homogeneous magnetic field (63). Such techniques can estimate the liver proton-density fat fraction (PDFF) which represents the fraction of proton density attributable to hepatic fat (60). PDFF maps can be translated pixel-by-pixel onto source images to generate parametric maps which illustrate the amount and distribution of fat throughout the liver (64).
Tang et al. recently introduced a novel volume-average biomarker: the total liver fat index (TLFI) in patients with NASH (65). It is defined as the product of the segmented liver volume by the average PDFF within the segmented volume. The study showed that a biomarker such as TLFI could be used to accurately monitor liver fat burden and its longitudinal change over time in the setting of a clinical trial.
Future studies may also incorporate liver volumetry to calculate other volume-averaged biomarkers of liver disease, such as,iron per unit volume (66). This
demonstrates the importance of liver volume as both a stand-alone and combined biomarker.
2.3
Clinical Indications for Liver Volumetry
As was demonstrated in the previous section, there are many reasons to perform either partial or complete liver volumetry. The established clinical indications for liver volumetry are: major hepatectomy, portal vein embolization and transplantation.
2.3.1 Future Liver Remnant (FLR) Prior to Major
Hepatectomy
Liver resection, or hepatectomy, is performed for a variety of reasons including benign pathology (i.e. giant hemangiomas, hepatic adenomas, large cysts), malignant pathology (i.e. HCC, cholangiocarcinoma, metastases), infectious pathology (i.e. pyogenic or amebic abscess) and biliary or hepatic trauma. Hepatectomy is the treatment of choice for primary or metastatic liver tumours, providing the best chance for long-term patient survival (67, 68).
Major hepatectomy implies resection of four or more liver segments. The common types of major hepatectomy are demonstrated in Figure 2.4.
SECTION 2.LIVER VOLUMETRY
Figure 2.4: Types of major hepatectomy.
White segments are planned for surgical resection. (a) Complete right hepatectomy, (b) extended right hepatectomy, (c) complete left hepatectomy and (d) extended left hepatectomy. Extended right hepatectomy represents the most common type of major hepatectomy. Figure adapted from Terminology of liver anatomy and resections (8) (69).
The volume of the liver which remains post-hepatectomy is of particular clinical value. During surgical planning it is termed the "future liver remnant" (FLR) volume. The FLR volume post-hepatectomy is a direct indicator of residual liver function and post-operative outcome (70). It is also one of the only independent predictive factors of post-operative liver dysfunction (70).
There have been recent increases in extended hepatectomies as definitions of resectability have expanded, thus leaving less remnant liver (70, 71). Liver volumetry is currently indicated in patients undergoing major hepatectomy or having underlying liver disease (44, 70) to ensure adequate functional remaining liver. VII! VIII! IV! II! III! V! VI! I! VII! VIII! IV! II! III! V! VI! I! VII! VIII! IV! II! III! V! VI! I! VII! VIII! IV! II! III! V! VI! I! a.! b.! c.! d.!
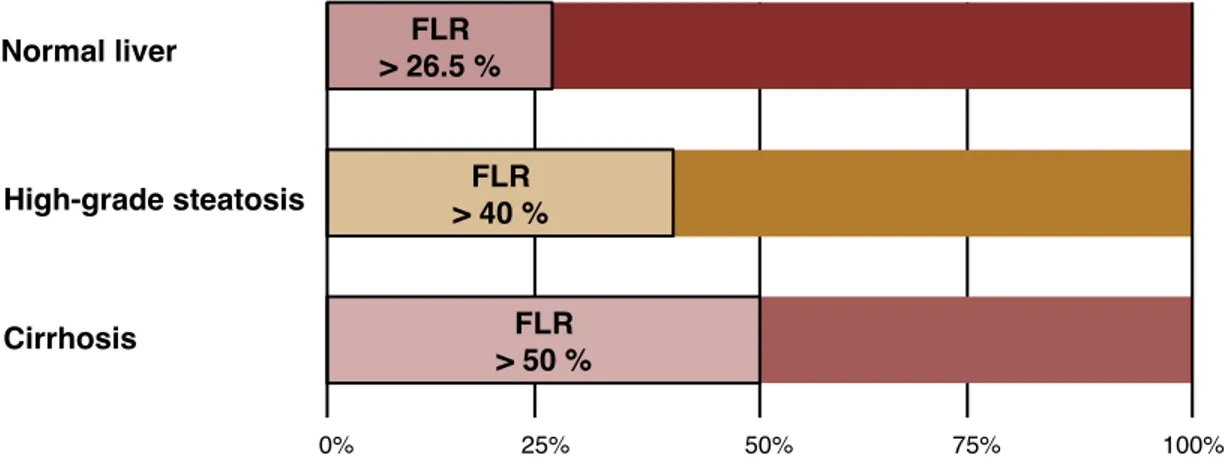
It is vital to accurately establish both anticipated FLR volume and total liver volume (TLV) prior to hepatectomy. To be considered safely resectable, the FLR/TLV ratio must be > 26.5% for normal livers, > 40% in high-grade steatosis, and > 50% in cirrhosis, reflective of the underlying hepatic parenchymal quality (44, 72). This is visually demonstrated in Figure 2.5.
Figure 2.5: FLR/TLV ratio prior to hepatectomy.
To be considered safely resectable prior to hepatectomy, the FLR/TLV ratio must be > 26.5% in underlying normal livers, > 40% in high-grade steatotic livers and > 50% in cirrhotic livers (8).
Examples of FLR/TLV ratio calculations prior to hepatectomy and how they impact clinical judgment are demonstrated in Figures 2.6 (normal), 2.7 (steatosis) and 2.8 (cirrhosis).
Future Liver Remnant Requirements!
0%! 25%! 50%! 75%! 100%!
Percentage of total liver volume (TLV)! FLR ! > 26.5 %! FLR ! > 40 %! FLR ! > 50 %! Normal liver! High-grade steatosis! Cirrhosis!
SECTION 2.LIVER VOLUMETRY
Normal liver
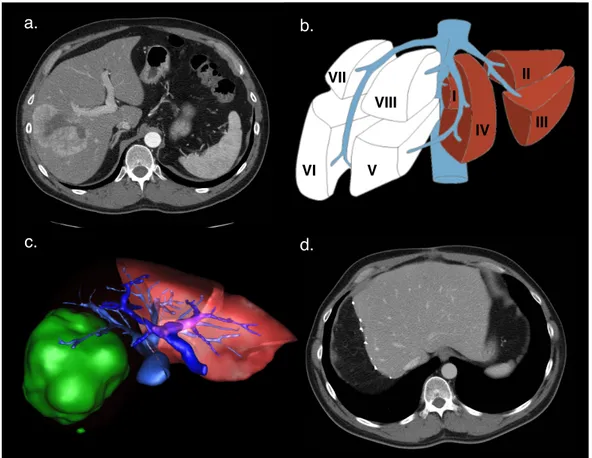
Figure 2.6: Future liver remnant volume calculation in normal liver.
(a) Axial enhanced CT image shows colorectal liver metastasis involving right posterior segments (VI and VII). (b) Resection diagram shows the intended complete right hepatectomy surgery planned. (c) 3D-rendering image shows surgical planning for complete right hepatectomy. FLR/TLV ratio was estimated to be 33%. (d) Axial unenhanced CT image of the same patient shortly after complete right hepatectomy. Actual FLR/TLV ratio was calculated to be 36% (8). Figure (c) courtesy of Dr. Franck Vandenbroucke-Menu.
VII! VIII! IV! II! III! V! VI! I!
Future Liver Remnant in Normal Liver!
d.!
a.! b.!
Steatosis
Figure 2.7: Future liver remnant volume calculation in fatty liver.
(a) Axial enhanced CT image shows colorectal liver metastasis involving segments V, VI, VII, and VIII. (b) Diagram showing the intended complete right hepatectomy surgery planned. (c) 3D-rendering image shows surgical planning for complete right hepatectomy. FLR/TLV ratio was estimated to be 46%. (d) Axial enhanced CT image of the same patient after complete right hepatectomy. Actual FLR/TLV ratio was calculated to be 60%. Figure (c) courtesy of Dr. Franck Vandenbroucke-Menu (8). VII! VIII! IV! II! III! V! VI! I!
Future Liver Remnant in Steatosis!
d.!
a.! b.!
SECTION 2.LIVER VOLUMETRY
Cirrhosis
Figure 2.8: Future liver remnant volume calculation in cirrhotic liver.
(a) Axial enhanced CT image shows colorectal liver metastasis involving segments II, III, and IV. (b) Diagram showing the intended extended left hepatectomy surgery planned. (c) 3D-rendering image shows surgical planning for extended left hepatectomy. FLR/TLV ratio was estimated to be 45%. (d) Axial enhanced CT image of the same patient after extended left hepatectomy. Actual FLR/TLV ratio was calculated to be 49%. Figure (c) courtesy of Dr. Franck Vandenbroucke-Menu (8).
2.3.2 Portal Vein Embolization
Portal vein embolization (PVE) is a minimally invasive pre-operative procedure performed by an interventional radiologist. It entails the selective occlusion of the portal blood supply to certain liver segments, redistributing blood
VII! VIII! IV! II! III! V! VI! I! a.! d.! b.!
Future Liver Remnant in Cirrhotic Liver!
flow towards segments which will remain post-hepatectomy. The ultimate goal is to reduce the risk of post-operative complications by intentionally causing hypertrophy if the residual liver (i.e. increase mass of the anticipated FLR). Studies have shown improvement in liver function post extended hepatectomy in patients undergoing PVE compared to without (44) (73).
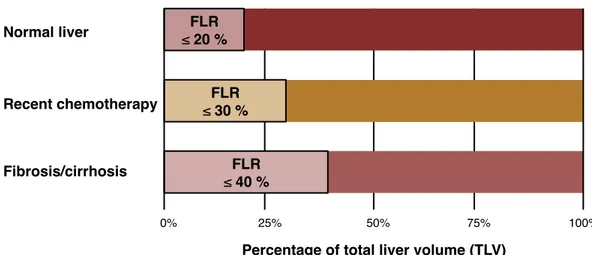
Indications for PVE rely on factors which may impact the FLR volume required for adequate post-hepatectomy liver function (44). Underlying liver disease, recent chemotherapy and the extent of the planned resection are all important factors. PVE is indicated when the FLR/TLV ratio is ≤ 20% in a normal liver, ≤ 30% in the setting of recent chemotherapy, or ≤ 40% in a fibrotic or cirrhotic liver. This is visually demonstrated in Figure 2.9.
Figure 2.9: FLR/TLV ratio prior to portal vein embolization.
Portal vein embolization is indicated when the FLR/TLV ratio is ≤ 20% in an underlying normal liver, ≤ 30% in the setting of recent chemotherapy, or ≤ 40% in a fibrotic or cirrhotic liver (8).
Liver volumetry is clinically indicated to initially calculate the FLR/TLV ratio and 3-4 weeks after PVE to assess volume and extent of hypertrophy (44). An example of a case requiring PVE prior to right hepatectomy is shown in Figure 2.10.
Portal Vein Embolization!
0%! 25%! 50%! 75%! 100%!
Percentage of total liver volume (TLV)! FLR ! ≤ 20 %! FLR ! ≤ 30 %! FLR ! ≤ 40 %! Normal liver! Recent chemotherapy! Fibrosis/cirrhosis!
SECTION 2.LIVER VOLUMETRY
Figure 2.10: Portal vein embolization prior to right hepatectomy
(a) Axial enhanced CT image shows colorectal liver metastasis involving segments V, VI, VII (only VII shown). (b) Embolization of the portal vein branches to segments V through VIII was performed using a Lipiodol-glue mixture. Final portogram is shown. (c) Axial enhanced CT image obtained 1 month after right PVE shows hypertrophy of future liver remnant. (d) Axial enhanced CT image of the same patient after right hepatectomy (8).
2.3.3 Living Donor Liver Transplantation
Due to increasing demand and scarcity of cadaveric livers, alternatives have been sought to basic orthotopic liver transplantation. Transplantation of the left lateral segment from a living donor is performed for the pediatric population, but this does not provide adequate hepatic volume for adult recipients (74). Similarly,
d.! c.!
b.! a.!
cadaveric split-liver transplantation may not provide adequate hepatic volumes for two adult recipients (75).
Living donor liver transplantation is being increasingly performed, exploiting the regenerative capacity of the liver. Pre-operative imaging of the donor is performed to exclude hepatic lesions, assess for diffuse liver disease and assess vascular and biliary anatomy (24). Moreover, pre-transplant liver volumetry is indicated as appropriate graft size is a major indicator of successful clinical outcome for both donor and recipient.
In living donor transplantation, a FLR-TLV ratio of 30-40% is required by the donor for survival (76, 77). In the recipient, the graft size to recipient body weight ratio ideally must be higher than 0.8-1.0% (78). Alternatively, the graft size to standard liver volume (calculated from body surface area) ratio must be higher than 50% for the recipient (79).
Insufficient graft size may lead to "small-for-size syndrome" in the recipient. In this syndrome the graft is too small to meet functional demands resulting in liver failure and possibly death in the absence of re-transplantation (80). An example of size incompatibility during living donor liver transplantation is provided in Figure 2.11.
SECTION 2.LIVER VOLUMETRY
Figure 2.11: Size incompatibility in living donor liver transplantation.
In this live liver donation, both the donor and recipient had transient hepatic insufficiency due to small-for-size liver: (a) Axial enhanced CT image of a 26-year-old living liver donor. The total liver volume (TLV) was 1754 mL. The donated liver volume was 980 mL and the residual liver volume was 774 mL (44.2% of the TLV). (b) Diagram showing the intended right split liver surgery planned for living donor liver transplantation. (c) Post-liver transplantation axial enhanced-CT image showing hypertrophied left liver of the donor. (d) Post-liver transplantation axial enhanced-CT image of a 53-year-old man who was the recipient of the right liver transplant (8).
VII! VIII! IV! II! III! V! VI! I!
Transplant Donor Compatibility!
a.! b.!
c.! d.!