Abstract— Cardiac output is an important variable when monitoring hemodynamic status. In particular, changes in cardiac output represent the goal of several circulatory management therapies. Unfortunately, cardiac output is very difficult to estimate, either in experimental or clinical settings. The goal of this work is to compare four techniques to measure cardiac output: pressure-volume catheter, aortic flow probe, thermodilution, and the PiCCO monitor. These four techniques were simultaneously used during experiments of fluid and endotoxin administration on 7 pigs. Findings show that, first, each individual technique is precise, with a relative coefficient of repeatability lower than 7 %. Second, 1 cardiac output estimate provided by any technique relates poorly to the estimates from the other 3, even if there is only small bias between the techniques. Third, changes in cardiac output detected by one technique are only detected by the others in 62 to 100 % of cases. This study confirms the difficulty of obtaining a reliable clinical cardiac output measurement. Therefore, several measurements using different techniques should be performed, if possible, and all such should be treated with caution.
I. INTRODUCTION
Cardiac output (CO) is defined as the mean flow ejected by the heart. It is an important variable when monitoring hemodynamic status [1]. However, it is very difficult to estimate in an experimental setting, and thus, even more in a clinical setting.
In an experimental setting, CO can be assessed using sensors positioned very close to the heart, therefore measuring estimates of CO at its exact anatomical location. In clinical settings, however, less invasive sensors are preferred. Consequently, CO is either assessed using echocardiography, thermodilution, or cardiovascular monitoring devices [1]. Echography is non invasive, but requires the intervention of trained staff. Thermodilution is more invasive, but is easier to perform. Finally, cardiovascular monitoring devices such as FloTrac, LiDCO Plus, and PiCCO provide beat-to-beat estimates of CO based on a range of data processing or models without being additionally invasive [1].
*Research supported by the Belgian National Funds for Scientific Research, F.R.S.-FNRS. Partial support by the EU-Project - “eTime” - ID: “FP7-PEOPLE-2012-IRSES” is gratefully acknowledged.
A. Pironet, P. C. Dauby, P. Morimont and T. Desaive are with the GIGA – In Silico Medicine, University of Liège, Liège, Belgium (phone: +32 4 366 33 56, e-mail: [email protected]).
J. G. Chase and S. Davidson are with the Department of Mechanical Engineering, University of Canterbury, Christchurch, New Zealand.
N. Janssen and B. Lambermont are with the GIGA – Cardiovascular Sciences, University of Liège, Liège, Belgium.
The aim of this study is to compare four techniques to measure CO, during septic shock: two techniques typically used in experimental hemodynamics laboratories, and two techniques used in clinical care. While many comparison studies exist between CO measurement techniques [1–4], most of them do not use a reference technique, because it is uncertain whether such a technique exists [1–3, 5]. This work being set in an experimental setting, it allowed the use of an ultrasound aortic flow probe, which represents the best available reference [2].
First, the precision, or repeatability, of each individual technique is assessed. Then, the CO estimates provided by the four techniques are compared with one another. Finally, the changes in CO detected by the four techniques are also compared, as they are potentially more useful from a clinical point of view.
II. METHODS
A. Experimental Data
Measurements were performed on 7 pigs, weighing 18.5 to 29 kg. These experiments were performed with the approval of the Ethics Commission for the Use of Animals at the University of Liège (Belgium).
The pigs were first given a muscle relaxant, sedated and anaesthetized. The use of a muscle relaxant implied the need for mechanical ventilation, which was performed at a positive end-expiratory pressure of 5 cmH2O. The hearts of the animals were then accessed through a median sternotomy. First, a pressure-volume (PV) catheter (Transonic, NY) was inserted in the left ventricle through the apex and provided continuous recording of left ventricular pressure and volume. Second, an ultrasound flow probe (Transonic, NY) was positioned around the proximal aorta. Third, a PiCCO monitor (Pulsion AG, Germany) was set up, and the corresponding arterial and venous catheters positioned in the femoral artery and superior vena cava. The PiCCO requires calibration using three rapid injections of 15 ml cold saline, further referred to as “thermodilutions”. Therefore, three thermodilutions were performed at the beginning of the experiment.
The experiments engaged in the following procedure. At start, a first infusion of 500 ml saline solution was performed over 30 minutes (step 1). Second, an endotoxin (lipopolysaccharide from E. Coli, 0.5 mg/kg) was injected over 30 minutes to induce septic conditions (step 2). After induction of septic conditions, a second infusion of 500 ml saline solution was performed over 30 minutes (step 3). Twenty minutes later, a third infusion of 500 ml saline
A Comparison between four Techniques to Measure Cardiac
Output
A. Pironet, P. C. Dauby, J. G. Chase, P. Morimont,
N. Janssen, B. Lambermont, S. Davidson, and T. Desaive
solution was performed, again over 30 minutes (step 4). This experimental procedure aimed at obtaining a large range of CO values, while remaining close to clinical conditions: induction of septic condition tends to decrease CO, while infusion of saline solution aims at increasing CO. The PiCCO was recalibrated with three thermodilutions after each step, as the CO value provided by this device is sensitive to changes in hemodynamics. B. Four Estimates of Cardiac Output
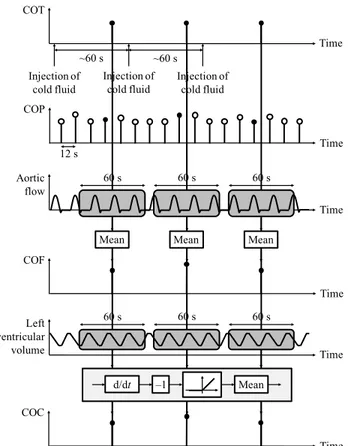
The computation of the four estimates of CO is illustrated in Fig. 1. The PiCCO monitor provides a beat-to-beat estimate of CO, computed from analysis of the arterial pressure wave [1] and denoted COP. The data exporting features of the PiCCO provide COP every 12 seconds, as depicted in Fig. 1. As previously mentioned, to provide COP, the PiCCO requires calibration using three thermodilutions. Each thermodilution provides another, intermittent, measure of CO [1], denoted COT.
The third estimate of CO was obtained from the recorded aortic flow signal, and is denoted COF. It was computed as the mean value of this flow during one-minute periods, corresponding to the moments during which the thermodilutions were performed, to allow for a consistent comparison.
To estimate CO from the recorded left ventricular volume, the derivative of left ventricular volume was first obtained using a Savitzky-Golay differential filter [6]. Then, the negative part of this derivative was selected, as it represents the flow out of the left ventricle. The fourth estimate of CO, denoted COC, was computed as the mean of this flow, similarly to what was done for COF.
COP Time Injection of cold fluid ~60 s 12 s Time Time 60 s 60 s 60 s Injection of cold fluid Injection of cold fluid COT Time Aortic flow COF Time Time 60 s 60 s 60 s Left ventricular volume COC Mean Mean Mean Mean –1 d/dt ~60 s
Figure 1. Computation of the 4 estimates of CO between the 4 steps of the experiment. The black dots represent the data used for analysis.
To summarize, 3 thermodilutions were performed at steady state: at baseline and after each of the four steps of the experiment, providing 15 measurements of COT, when the experiment did not end prematurely. The other 3 CO estimates, COP, COF and COC were computed at the same moments in time. Consequently, the four estimates of CO were available in triplicate between each of the four steps of the experiment. Since the COP estimate relies on COT, the COP estimates considered were taken just before the end of each thermodilution, so that they were not influenced by the result of this thermodilution. Finally, since the PiCCO does not provide CO before the first thermodilution, fewer data points were available for COP. C. Statistical Analysis
The first analysis realised in this work assessed the repeatability of each individual CO measurement technique. Repeatability was evaluated using the measurements performed in triplicate. For these measurements, differences between two successive CO values obtained using the same technique were compared with their mean using a Bland-Altman plot [7]. Because they share information from the thermodilutions, the triplicate COP estimates considered in this study are not independent, and thus, the repeatability methodology cannot be applied to this technique [7]. In an extended study, a repeatability analysis for COP could be performed using the successive CO measurements provided by the PiCCO between thermodilutions, represented as white dots in Fig. 1.
The second analysis compared the different CO measurement techniques with one another. As previously mentioned, there is no gold standard technique for measurement of CO. Consequently, the different techniques must also be compared using a Bland-Altman plot [7]. When using a Bland-Altman plot to compare two different techniques, the differences between the CO values provided by the two techniques are plotted against their means.
In the clinics, there is no ideal value of CO. However, if CO is judged inadequate because of other clinical signs, doctors seek to increase CO using various therapies [8]. It is thus more important from a clinical point of view to be able to track changes in CO than assessing its absolute value. As a third study, the techniques were thus compared on their ability to detect an increase or a decrease in CO after fluid or endotoxin administration. To do so, the mean CO was computed for each animal between each of the four steps of the experiments, as the mean of the triplicate measurements. Then, the changes in CO between phases were computed and compared for each technique. For this analysis, only changes in CO larger than 5 % in absolute value were considered.
For consistency, the thermodilution and PiCCO-derived CO estimates were also compared using the last two analyses presented in this section. However, since COP depends on COT, the agreement between these two measures is a priori expected to be good.
III. RESULTS AND DISCUSSION
A. Measured Values
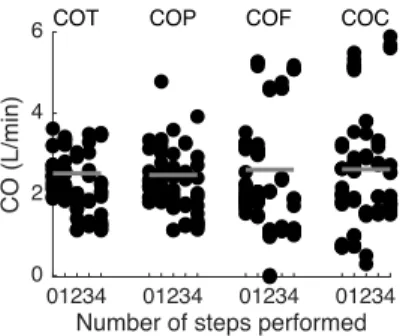
Fig. 2 presents all CO values obtained using the four CO measurement techniques between the four steps of the seven experiments. The mean COs are not significantly different (p = 0.76, computed by a one-way analysis of variance), whereas the spreads of the measurements are very different across techniques. Fig. 2 also confirms that a large range of COs was obtained during the experiments.
According to the initial protocol, the experiments should have yielded 7 x 15 = 105 data points for each technique. However, four experiments ended prematurely after endotoxin infusion. Consequently, only 86 data points were available. Only the flow probe was able to provide a CO value for all 86 data points. The thermodilution failed to provide two CO values because CO was very low (below 0.5 L/min, according to COF and COC). The PV catheter failed to provide three CO values, because its calibration was difficult at the beginning of one experiment. Finally, the PiCCO failed to provide 16 CO values (19 %), either because the thermodilutions were unsuccessful, not performed yet, or because arterial pressure was too low.
B. Repeatability
As previously mentioned, the repeatability analysis was performed on the triplicate CO measurements provided by the thermodilution, the flow probe and the PV catheter. These triplicate measurements are denoted COT1, COT2 and COT3 for COT. Similar notations are introduced for COF and COC. Differences between repeated CO measurements were computed, and their mean and standard deviation (SD) for all data points are provided in Table I. As expected [7], the mean difference between replicate measurements is very close to zero.
A CO measurement technique is said to be precise when the variability in repeated measurements is low [4]. The SDs of Table I, denoted v, thus provide an estimate of the precision of the three techniques. The coefficient of repeatability [7], equal to 2v, amounts to maximum 0.34 L/min. Consequently, it can be assumed with 95 % certainty that a measurement provided by one of these three techniques suffers a maximum measurement error of 0.34 L/min. The relative error can be obtained by dividing 2v by the mean CO for each technique, provided in Fig. 2. This computation yields relative errors ranging from 4 to 7 %.
01234 01234 01234 01234
Number of steps performed
0 2 4 6
CO (L/min)
COT COP COF COC
Figure 2. CO measurements obtained using the four techniques between the four steps of all seven experiments. The grey line represents
the mean CO for each technique.
TABLE I. MEAN AND SD OF THE DIFFERENCES BETWEEN REPEATED MEASUREMENTS USING THREE COMEASUREMENT
TECHNIQUES
CO Estimate Mean (L/min) SD, v (L/min)
COTi+1 – COTi –0.00 0.17
COFi+1 – COFi –0.01 0.11
COCi+1 – COCi 0.00 0.17
C. Comparison between Techniques
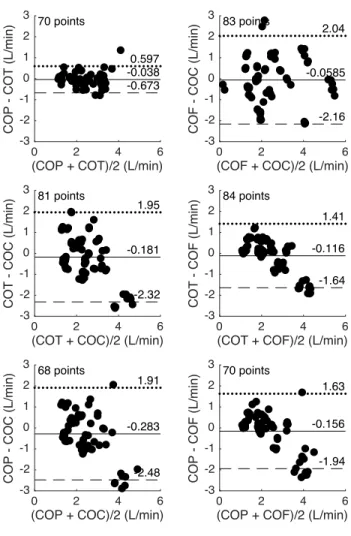
To compare the four CO measurement techniques with each other, Fig. 3 presents six Bland-Altman plots, one for each pair of techniques. For each pair of measurements provided by two different techniques, a Bland-Altman plot represents the differences between these measurements as a function of their means [7].
The bias, d, between two measurement techniques is the mean of the differences represented on the y-axes of Fig. 3 [7]. As shown in Fig. 3, the bias between each pair of CO measurement techniques ranges from –0.28 to –0.04 L/min and is thus lower than the measurement error.
The upper and lower limits of agreement between two measurement techniques are equal to d ± 2s, where s is the SD of the differences represented on the y-axes of Fig. 3 [7]. The limits of agreement are supposed to contain 95 % of the differences between two types of measurements [7]. Conversely to the biases, the limits of agreement, as shown in Fig. 3, are very large, as they compare with the mean CO value. This observation reconfirms the difficulty of obtaining reliable measurements in critical care [9], in particular for CO [1].
The best agreement is present between the PiCCO and thermodilution techniques, which is not surprising, since the PiCCO uses the thermodilution for calibration of its CO estimate. To account for this effect, in this study, the CO value provided by the PiCCO was taken just before the corresponding thermodilution measurement. However, since thermodilutions were performed in triplicate, the COP values before the second (respectively third) thermodilution was influenced by the CO value(s) provided by the (two) previous thermodilution(s).
The worst agreements are observed between the PV catheter and any of the other three techniques. A possible explanation is that thermodilutions may influence the COC value, as blood temperature and hematocrit, and thus, blood conductance, locally change during cold fluid injections. The other three techniques are much more insensitive to blood temperature and hematocrit.
Several criteria were previously published to determine whether two techniques for CO measurement could be used equivalently [1, 3, 5]. The criteria state that the limits of agreement should not exceed a fixed acceptable difference [5]. This difference has been estimated to 22 % [5], 30 % [3], 20 % or 1 L/min [3]. To compare with these percentage criteria, the size of the limits of agreement (2s) was divided by the mean measured CO, equal to 2.56 L/min. Only the thermodilution and PiCCO estimates can be used equivalently, according to the loosest two of these criteria, which is not surprising since they share information from the thermodilutions.
0 2 4 6
(COP + COT)/2 (L/min)
-3 -2 -1 0 1 2 3
COP - COT (L/min)
70 points
0.597 -0.673 -0.038
0 2 4 6
(COT + COF)/2 (L/min)
-3 -2 -1 0 1 2 3
COT - COF (L/min)
84 points
1.41
-1.64 -0.116
0 2 4 6
(COT + COC)/2 (L/min)
-3 -2 -1 0 1 2 3
COT - COC (L/min)
81 points
1.95
-2.32 -0.181
0 2 4 6
(COF + COC)/2 (L/min)
-3 -2 -1 0 1 2 3
COF - COC (L/min)
83 points
2.04
-2.16 -0.0585
0 2 4 6
(COP + COC)/2 (L/min)
-3 -2 -1 0 1 2 3
COP - COC (L/min)
68 points
1.91
-2.48 -0.283
0 2 4 6
(COP + COF)/2 (L/min)
-3 -2 -1 0 1 2 3
COP - COF (L/min)
70 points
1.63
-1.94 -0.156
Figure 3. Bland-Altman plot for pairwise comparison of the CO measurements provided by the four techniques. Full line: bias; dotted
line: upper limit of agreement; dashed line: lower limit of agreement. The four bottom plots Fig. 3 present a negative slope, meaning that the difference between the two measured CO values decreases when CO increases. From this observation, it can be assumed that the CO measurement techniques can be separated in two groups. Group 1 contains COP and COT, which where previously shown to present good agreement, and group 2 contains COC and COF. Comparison between any pair of measurements coming from these two groups yields a negative slope in the Bland-Altman plot. It can thus be concluded that measurement techniques from groups 1 and 2 provide different CO values: CO from group 1 overestimates the one from group 2 at low CO values, while the opposite happens at large CO values. On a linear regression plot, the slope between these measurement techniques would be different from unity.
D. Ability of the Techniques to Track Changes in CO Table II shows the percentage of agreement between techniques when the goal is to detect an increase or a decrease in CO during each phase of the experiment. The agreement between techniques ranges from 62 to 100 %, meaning that up to 38 % of the changes detected by one technique were detected in the opposite direction by the other. The flow probe and the thermodilution agreed 90 % of the time, which is encouraging since these two techniques are independent and are considered to be the
most reliable ones [1, 2]. The PiCCO and thermodilution always detect the same changes, which is logical since they share information.
IV. CONCLUSION
This work compared four techniques to measure CO: thermodilution, PiCCO, PV catheter and flow probe. CO values provided by these four techniques during animal experiments of septic shock were obtained and statistically analyzed.
The CO measurement techniques were found to be highly repeatable, as less than 7 % of the measured value can be attributed to measurement error. However, when compared to one another, the different techniques showed poor agreement. All these results underline the complexity of obtaining reliable CO measurements. When compared on their ability to detect changes in CO, the measurement techniques agreed from 62 to 100 % of times. In clinics, a change in CO detected by one technique should thus be confirmed by another technique for improved evaluation of the success or failure of a given therapy.
REFERENCES
[1] J. Pugsley, and A. B. Lerner, “Cardiac Output Monitoring: Is There a Gold Standard and How Do the Newer Technologies Compare?”,
Seminars in Cardiothoracic and Vascular Anesthesia, vol. 14,
pp. 274–282, 2010.
[2] M. Botero, D. Kirby, E. B. Lobato, E. D. Staples, and N. Gravenstein, “Measurement of Cardiac Output Before and After Cardiopulmonary Bypass: Comparison Among Aortic Transit-Time Ultrasound, Thermodilution, and Noninvasive Partial CO2
Rebreathing”, Journal of Cardiothoracic and Vascular Anesthesia, vol. 18(5), pp. 563–572, 2004.
[3] L. A. H. Critchley, and J. A. J. H. Critchley, “A meta-analysis of studies using bias and precision statistics to compare cardiac output measurement techniques”, J Clin Monit, vol. 14, pp. 85–91, 1999. [4] P. Squara, M. Cecconi, A. Rhodes, M. Singer, and J.-D. Chiche,
“Tracking changes in cardiac output: methodological considerations for the validation of monitoring devices”, Intensive
Care Med, vol. 35, pp. 1801–1808, 2009.
[5] K. R. LaMantia, T. O’Connor, and P. G. Barash, “Comparing Methods of Measurement: An Alternative Approach”,
Anesthesiology, vol. 72(5), pp. 781–783, 1990.
[6] A. Savitzky, and M. J. E. Golay, “Smoothing and Differentiation of Data by Simplified Least Squares Procedures”, Anal Chem, vol. 36(8), pp. 1627–1639, 1964.
[7] J. M. Bland, and D. Altman, “Statistical methods for assessing agreement between two methods of clinical measurement”, The
Lancet, vol. 327, pp. 307–310, 1986.
[8] M. Cecconi, D. De Backer, M. Antonelli, R. Beale, J. Bakker, C. Hofer, R. Jaeschke, A. Mebazaa, M. R. Pinsky, J.-L. Teboul, J.-L. Vincent, and A. Rhodes, “Consensus on circulatory shock and hemodynamic monitoring. Task force of the European Society of Intensive Care Medicine”, Intensive Care Med, vol. 40, pp. 1795– 1815, 2014.
[9] J. G. Chase, K. Moeller, G. M. Shaw, C. Schranz, Y. S. Chiew, and T. Desaive, “When the value of gold is zero”, BMC Research
Notes, vol. 7(404), 2014.
TABLE II. PERCENTAGE AGREEMENT BETWEEN TECHNIQUES TO DETECT AN INCREASE OR DECREASE IN CO.
PiCCO Flow probe PV catheter Thermodilution 9/9 = 100 % 9/10 = 90 % 8/10 = 80 %
PiCCO 10/12 = 83 % 10/13 = 77 %
Flow probe 8/13 = 62 %