HAL Id: hal-01346408
https://hal.archives-ouvertes.fr/hal-01346408
Submitted on 21 Jul 2016
HAL is a multi-disciplinary open access
archive for the deposit and dissemination of
sci-entific research documents, whether they are
pub-lished or not. The documents may come from
teaching and research institutions in France or
abroad, or from public or private research centers.
L’archive ouverte pluridisciplinaire HAL, est
destinée au dépôt et à la diffusion de documents
scientifiques de niveau recherche, publiés ou non,
émanant des établissements d’enseignement et de
recherche français ou étrangers, des laboratoires
publics ou privés.
Comparing simple video quality measures for
loss-impaired video sequences on a large-scale database
Ahmed Aldahdooh, Enrico Masala, Olivier Janssens, Glenn van Wallendael,
Marcus Barkowsky
To cite this version:
Ahmed Aldahdooh, Enrico Masala, Olivier Janssens, Glenn van Wallendael, Marcus Barkowsky.
Com-paring simple video quality measures for loss-impaired video sequences on a large-scale database. 8th
Eighth International Conference on Quality of Multimedia Experience (QoMEX 2016), Jun 2016,
Lisbonne, Portugal. pp.1-6, �10.1109/QoMEX.2016.7498941�. �hal-01346408�
Comparing Simple Video Quality Measures for Loss-Impaired
Video Sequences on a Large-Scale Database
Ahmed Aldahdooh∗, Enrico Masala†, Olivier Janssens‡, Glenn Van Wallendael‡and Marcus Barkowsky∗
∗
LUNAM Universit´e, Universit´e de Nantes, IRCCyN UMR CNRS 6597, Nantes, France Email: [email protected]
†
Ghent University - iMinds - Data Science Lab, Ghent, Belgium Email: [email protected]
‡Control and Computer Engineering Department, Politecnico di Torino, Torino, Italy
Email: [email protected]
Abstract—The performance of objective video quality measures is usually identified by comparing their predictions to subjective assessment results which are regarded as the ground truth. In this work we propose a complementary approach for this performance evaluation by means of a large-scale database of test sequences evaluated with several objective measurement algorithms. Such an approach is expected to detect performance anomalies that could highlight shortcomings in current objective measurement algorithms. Using realistic coding and network transmission conditions, we investigate the consistency of the prediction of different measures as well as how much their behavior can be predicted by content, coding and transmission features, discussing unexpected and peculiar behaviors, and highlighting how a large-scale database can help in identifying anomalies not easily found by means of subjective testing. We expect that this analysis will shed light on directions to pursue in order to overcome some of the limitations of existing reliability assessment methods for objective video quality measures.
I. INTRODUCTION
Subjective assessment is usually considered as ground truth for the training, verification, and validation of objective video quality measures. The number of test cases that may be obtained in subjective assessment is however limited. Less than 200 video sequences of about 10 seconds in one session may be evaluated when using one of the most efficient methods, Absolute Category Rating [1]. In addition, with a reasonable number of observers, only about 75% of the test cases are pairwise distinguishable with confidence intervals around 0.3 on a five point scale [2]. Even with recent collections of available databases, notably the Qualinet Database [3], the choice of available annotated databases for a particular usage scenario stays limited.
The purpose of this contribution is to propose a complementary approach for measuring performance of objective measurements: The usage of a large-scale database of test sequences evaluated with several objective measurement algorithms. It is complementary, as it may be expected that performance anomalies, such as outliers, may be detected that may be missing in the limited selection per-formed for subjective assessment. It should be noted though that the trustworthiness of subjective assessment can not be targeted. In [4], Ciaramello and Reibman explained a similar approach for image quality predictors by creating a large amount of test images with specific degradations.
The focus of this paper is on the characterization of three well-known objective video quality predictors with realistic coding and lossy network transmission conditions. To this aim, we present an extension to our previous database [5] which adds a large number of objective quality evaluations when compressed video streams are subject to data loss. It shall be noted that none of the three measures was specifically designed for measuring degradations due to packet loss, notably concealment artefacts and time varying quality. However, they have been used repeatedly in the literature in order to mea-sure such scenarios regardless of such considerations. Transmission
degradations have therefore been considered as being at least in the extended scope of application: prediction with a limited accuracy was expected using these measurement algorithms.
In this paper, three goals are targeted. First, a new large-scale database with a total of 496,000 video sequences with packet loss degradations is introduced. Second, the performance of the three quality predictors PSNR, SSIM, and VIFP is evaluated on in terms of ranking agreement and distance. Third, a link will be established between Full Reference and future Hybrid No-Reference measures by showing how to predict the results of one of the measures, in this case PSNR, to information extracted from the transmitted video sequences, notably content features, coding parameters, and network characteristics.
This paper is organized as follows. First, the large database on which our analysis is performed will be described. Then, the objective features and measures introduced in Section III will be used to analyze the large database in Section IV. Finally, discussion and conclusion sections are provided.
II. DATABASEOVERVIEW
This work relies on our publicly available database1, which
comprises 59,520 video sequences encoded according to the HEVC standard using the test model software HM 12.1 [6]. The database covers three resolutions (ranging from 960×544 to 1920×1080), and ten original test signals, each 10 seconds long. The database can be fully and exactly reproduced since the sequences, the encoding con-figuration and the test model software are freely available. Moreover, several objective video quality metrics have been computed for each encoded video sequence. These publicly accessible results include both the final value for each sequence and the intermediate values used for the computation, e.g., per-frame quality values.
In addition, to investigate the effect of network impairments on HEVC-compressed video sequences, the database in [5] has been recently extended to include quality evaluation when compressed video streams are subject to data loss. A set of 25 loss patterns has been generated by means of a 2-state Markov model [7] using loss rate values up to 1% and average burst length up to 2 slices. Applying each loss pattern to each sequence, 25 degraded bitstreams have been generated, decoded, and objective measurements have been calculated. Note that for each degraded bitstream we used the effective loss rate and average burst length, as measurable at the receiver, which may be different from the settings of the model since only part of the loss pattern has been used. Currently, due to the huge computational effort, this activity has been performed in full
only for the lower-resolution set of encoded sequences (i.e., 19,840). Therefore, 496,000 combinations of encoded sequence and loss traces have been evaluated with several objective quality metrics. Depending on the position of the lost packets, determined by the 25 loss patterns, and the encoding configuration, error propagation of different duration occurs. Using a robust decoder simulation [8], all video sequences can be decoded, there is no temporal offset, and the number of affected frames can be exactly calculated.
This large-scale approach currently appears to be unique in video quality research. In other words, we are not aware of other publicly available datasets of similar size. In our opinion, such a large dataset of values, coupled with the possibility to recompute, as needed, any of the values and distorted sequences, allows to perform in-depth investigation of issues encountered by objective quality measures, in particular analyzing their coherence of and dependency on many parameters such as content characteristics, coding settings and loss parameters.
III. QUANTITATIVEDATABASECHARACTERIZATION Each processed video sequence in the database is characterized using various content features, coding parameters, loss parameters, and several quality measures as described next.
A. Content Features
Table I shows 209 content features that have been extracted from the ten original video sequences. This is an approximation of the extraction of the features from the degraded videos which has been postponed due to lack of computational power. The features cover spatial and temporal characteristics that are extracted from the luminance frame (Y), and the chrominance frames (Cb and Cr), in the spatial domain or in the frequency domain. The features are extracted on both block or frame levels. For the features that are extracted at the block level, the Minkowski sum with different power is applied to obtain a scalar value of each frame, then several statistical measures (e.g., mean, maximum, standard deviation, etc.) are applied to get a scalar value that represents the video sequence. Three spatial information features [1] are employed to measure the edge information. Twelve chrominance information features [9] are used to measure the color information. Five contrast information features [9] are considered to measure the distribution of contrast in the frame. Twelve features that belong to spatial perceptual features [9] measure the perceptual spatial information and extract the changes in the orientation of the spatial activity. One feature measures the colorfulness of the video sequences [10]. Contrast, energy, correlation, homogeneity, and entropy of the joint probability distributions of pairs of pixels, namely Gray-Level Co-occurrence Matrix (GLCM), as in [16] and [11] on the whole frame and on 64x64 blocks are measured using four neighboring directions (0, 45, 90, and 135 degrees). In total, 90 features have been extracted from every video sequence using GLCM. Normalized cross correlation features [12] are represented by 25 values that indicate how much the top-left 16x16 sub-block is correlated in its 64x64 block. Other 8 features are extracted from the 4x4-DCT decomposition of the luminance frame: these are kurtosis, smoothness, sharpness, similarity between different frequencies (3 features), and vertical and horizontal blockiness [13]. Features from Laplacian pyramid subband are also extracted [14]. Energy, entropy, and kurtosis are extracted from each intra-subband and the ratio between different subbands are considered as features, yielding 33 values. Other 13 features represent the
TABLE I: List of extracted features
Features Formula Count Spatial information
[1]
SI = F1{F2[Sobel(Y )]}
• {F1, F2} = {max, std},
{max, mean}, {std, mean}
3 Chrominance Infor-mation [9] CU= F1{F2{U }} CV = F1{WR∗ F2{V }}, WR= 1.5 • {F1, F2} = {mean, mean},
{std, mean}, {mean, kurt}, {std, kurt}, {max, kurt}, {max, max} 12 Contrast information [9] CI = F1{F2[Y ]} • {F1, F2} = {mean, mean}, {mean, std}, {max, std}, {mean, skew}, {mean, kurt}
5 Spatial perceptual information [9] FSI13= F1{F2[SI13(Y )]} SIHV = F3{(mean(HV [Y ])|p) (mean(HV [Y ])|p)}, p(threshold) = 3 • {F1, F2} = {mean, mean},
{mean, std}, {mean, skew}, {mean, kurt}, {mean, max}, {std, mean}, {max, max} • F3= mean, std, skew, kurt,
max 12 Colorfulness [10] CF = mean{CF {Y U V }} 1 Gray-Level Co-occurrence Matrix (GLCM) [11] Contrast = F1{cont(GLCM )} , Correlation = F1{corr(GLCM )}, Energy = F1{enrg(GLCM )}, Homogeneity = F1{homo(GLCM )}, Entropy = F1{entropy(GLCM )} • F1= mean, std, max
• It is calculated per frame (5x3= 15) and per block with different Minkowski power p=(1,2,4,10, 0.1) = (5x3x5 = 75) 90 Normalized cross correlation [12] FN CC= F1{N CC(block64x64)}
• F1 = mean, max, std, skew,
kurt
• It is calculated per block with dif-ferent Minkowski power p=(1,2,4,10, 0.1)(5x5=25)
25
DCT based features
[13] See the reference for more details 8 Laplacian based
features [14] See the reference for more details 46 Temporal informa-tion [1] T I = F1{F2[Y2− Y1]} • {F1, F2} = {max, std}, {std, max} 2 MPEG-7 Motion
Activity [15] See the reference for more details 5 How to read the formula:
• For instance, to read the formula SI = F1{F2[Sobel(Y )]} with
{F1, F2} = {max, std}:
- Apply the Sobel filter to each Y frame and keep the maximum value.
- Calculate the standard deviation of maximum values. • Key to read abbreviations: standard deviation (std), maximum (max),
skewness (skew), and kurtosis(kurt)
inter subbands smoothness, subbands similarity and SSIM similarity. Regarding the temporal domain, 7 features are computed. Two of them directly represent the temporal information [1]. Others are computed according to the definitions the MPEG-7 motion activity descriptor [15]: they represent motion intensity, motion direction, and spatial distribution of objects.
B. Quality Measures
Three widespread objective quality measures have been consid-ered in this work, i.e., PSNR, SSIM, and VIFP [17], [18], which have been computed using the vqmt tool [19]. Each measure has
been computed for each sequence in the database. In all cases, the original uncompressed source sequence is taken as a reference.
During the analysis of the quality values included in the database, we noticed that the PSNR value for content named src09 presented infinite values for some encoded frames. Further investigation showed that the content includes smooth transitions to and from fully-black frames which are encoded perfectly, that is without any difference, by HEVC. Therefore, the frame difference is zero and PSNR, by the classical definition, returns infinity. For this reason we decided to exclude src09 from the remaining part of this work.
Moreover, for some sequences, we noticed that the PSNR value of the sequence affected by losses has a slightly higher PSNR than the one of the encoded-then-decoded sequence not affected by losses. This surprising behavior has been traced back to video content charac-teristics and coding parameter options. Sequences such as src05 have a completely static background with small foreground movements. Therefore, concealment of the background area is almost perfect in case of loss. The HM video encoder [6], instead, has the peculiarity, for some coding configurations, to provide poor encoding quality in proximity of scene cuts therefore in case of loss the quality of the concealed video sequence, composed for a large part of background area, can temporarily be higher than the one provided by the encoder for the uncorrupted sequence. This unusual phenomenon remarks the importance of performing analysis and investigation using a large database of video sequences comprising many different encoding configurations and loss patterns, so that unexpected behaviors can be observed and taken into consideration. However, note that in our experiment, the effect is limited since the PSNR “gain” due to concealment is, at most, 0.1 dB.
IV. IDENTIFICATION OFINTERESTINGPARAMETER COMBINATIONS
This section will explain how to isolate parameter combinations that yield to remarkable behaviors of the considered measures. By means of this analysis we intend to study the stability and predictabil-ity of the behavior of the measures with the ultimate goal of better understanding the intrinsic limits of the measures themselves. A. Measure Disagreement
Having several measures for the same video sequence naturally yields to the question if such measures are consistent in ranking. In other words, given two processed video sequences (PVS), do all the measures agree about which is the one with the highest quality score? The underlying idea is that if one or more of these measures do not agree, this condition should deserve further investigation. In [8], we used a similar approach when dealing with PVSs which do not contain data loss impairments.
Table II reports results for the nine sources considered in this work. The first data column shows the percentage of comparisons with disagreement among all comparisons within the same source (i.e., 1,230,055,200 pairs). The next three columns show how many cases (as a percentage out of all disagreement cases) can be ascribed to each measure (PSNR, SSIM, VIFP).
These results can be directly compared with the ones in [8] showing that, in the considered scenario, the loss impairments tends to increase the amount of disagreement. Moreover, for most sources the share of disagreement attributed to PSNR increases compared to
TABLE II: Reasons of disagreement among quality measurements for each sequence. src09 is not included due to the PSNR issue.
% of % due to % due to % due to Source disagreement PSNR SSIM VIFP src01 12.74 38.81 41.60 19.59 src02 4.29 61.37 23.97 14.66 src03 12.07 45.47 26.42 28.11 src04 10.41 57.51 22.55 19.94 src05 4.11 47.26 32.27 20.47 src06 9.98 71.81 12.43 15.76 src07 5.64 65.27 11.89 22.84 src08 5.46 59.19 19.73 21.07 src10 12.44 46.67 32.12 21.21
Fig. 1: Reason of disagreement (expressed as a ratio over the total pairs) between the various algorithms as a function of the normalized difference for src03.
the case in [8] (i.e., no losses), whereas there is a decrease for the VIFP measure. This behavior may suggest that some measures are more influenced (and perhaps are more sensitive) to loss impairment than others.
However, the previous results should be taken carefully since very limited variations around the equivalence between the pairs could yield disagreement that may be due to potentially tiny modifications of the characteristics of the PVS. Therefore, for each algorithm we in-troduce a normalized difference by linearly rescaling the results in the interval [0..1]. Normalized values are denoted by the hat symbol (e.g.,
d
PSNR). Then, the individual differences of all the measurements for a sequence pair are combined in a single normalized difference ˆd by using the Euclidean distance:
ˆ d = q ∆PSNRd 2 + ∆SSIMd 2 + ∆VIFd 2 (1) so that the results can then be plotted in one dimension using a histogram for each source, as suggested in [8].
Figure 1 presents a sample histogram showing the reason of disagreement as a function of the normalized difference for src03. As expected, the amount of disagreement decreases as the distance increases. Moreover, the figure shows a smooth reduction trend for all the three considered measures, though the share is generally higher than the one in [8]. This result is in part different from [8], in particular for src03, where the share strongly fluctuates as the distance increases. This effect was described as being potentially attributed to the characteristic of the sequence content.
Since the share of agreement increases more slowly compared to [8], we plotted the histograms for a larger distance, as shown in
Fig. 2: Reason of disagreement (expressed as a ratio over the total pairs) between the various algorithms as a function of the normalized difference for src01 and src06. To simplify comparisons, the black vertical line shows the point up to which Fig. 1 and all histograms in [8] have been plotted.
Fig. 2 for src01 and src06. For convenience, a black vertical line shows the point up to which Fig. 1 and all histograms in [8] have been plotted. It can be noticed that the disagreement spans over a larger interval of normalized distances: this is expected since loss impairments typically have stronger influence on the measurements. However, strong differences in the reasons of disagreement can be observed: src01 is dominated by SSIM disagreement, whereas PSNR is the main reason of disagreement for src06. Therefore, content characteristics appear to play a significant role in this regard. B. Prediction of∆PSNR
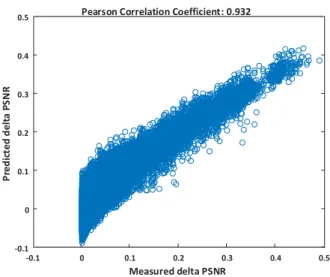
In this section we focus on a method to predict the behavior of one of the measures, namely PSNR, from a set of features by employing a machine learning approach, so that difficult-to-predict situations (i.e., outliers) can be identified. All features that are used in this paper are normalized linearly. In order to increase the confidence of content features’ values, since the dataset contains only 10 sequences, the features are also extracted from other 37 video sequences and then normalized. In total, 220 features are included (209 content features, 8 encoding parameters, and 3 channel parameters). The data is divided into training and test sets. The main goal of this machine learning process is to highlight the content features, besides the encoding and channel parameters, that have an impact on improving the prediction of the difference in quality between sequences with and without packet loss, i.e. ∆PSNR, that is calculated as the difference between the PSNR of each condition with coding-only degradation and the PSNR of the same condition with applied packet loss pattern. The features are selected as described in Algorithm 1, which relies on the LIBSVM tool [20]. Epsilon-SVR with radial basis function is used to train the model with 5-fold cross validation. The SVR parameters are computed before applying the training algorithm. After the end of the training, 7 features are selected: temporal information (std(max)), block based correlation of GLCM (max(p = 1) and mean(p = 0.1)), block based energy of GLCM (std(p = 2)), block based entropy of GLCM (std(p = 2)), DCT based smoothness measure, and MPEG-7 short length of zero of spatial distribution of the objects. The syntax of the feature extraction is described at the bottom of Table I. Table III shows the performance of the prediction model using the test data set. Pearson Correlation Coefficient (PCC), Spearman Rank Order Correlation Coefficient (SROCC), and Root Mean Squared Error (RMSE) are used to compute the prediction model performance. In addition, Figure 3 shows the correlation between the predicted data against the original data. It can be observed that when ∆PSNR decreases (i.e. the encoded and degraded
sequences are approximately of the same quality), the prediction error increases. Measured delta PSNR -0.1 0 0.1 0.2 0.3 0.4 0.5 P red ic ted d elt a P S N R -0.1 0 0.1 0.2 0.3 0.4
0.5 Pearson Correlation Coefficient: 0.932
Fig. 3: Performance of predicting ∆PSNR from content features only. Please note the lack of significant outliers.
TABLE III: Performance of the predicting model
Performance PCC SROCC RMSE Test data (reduced feature set) 0.9320 0.833 0.0305 Train data (reduced feature set) 0.9310 0.832 0.0305 Test data (All features) 0.9144 0.770 0.0368 Train data (All features) 0.9135 0.769 0.0368
C. Analysis based on∆PSNR prediction
By modelling on all the features, as described in the previous section, the importance of every feature can be derived. Such analysis indicated that counting the number of frames that get affected by packet loss (frames affected) is one of the appropriate features that correlate well with simple objective measures. Aided by this observation, questions arise about how the amount of affected frames influences the agreement between different quality measures. In Fig. 4, this analysis has been performed on all the sequences of src5.
Fig. 4: The analyzed objective measures, namely PSNR, SSIM, and VIFP plotted together with the transmission feature frames affected of all src5 sequences. Darker dots indicate high disagreement, lighter dots indicate small disagreement.
Algorithm 1 Training algorithm
Input: (data,target) {data ism × n, wheremis the samples and nis number of features, and target is the response of each data sample (∆PSNR)}
Output: F {set of selected features}
1: F ⇐ data(channel and encoding parameters)
2: Train SVM model with 5-fold cross validation
3: pBest= Save the performance results of the training as best perfor-mance
4: for i = 1 : ndo
5: for i = 1 : ndo
6: F0← F + data(i)
7: Train SVM model with 5-fold cross validation usingF0
8: p(i) = perf ormance {Save the training results}
9: end for 10: [p0 indx] ← max(p) 11: ifp0> pBestthen 12: F ← F +data(indx) 13: pBest ← p0 14: else 15: break 16: end if 17: p ← 0 18: end for
Other sources show a similar behavior. On the Y-axis, the number of affected frames of all src5 sequences has been displayed with respect to the PSNR of these sequences on the X-axis. Every dot represents a sequence of src5, each having a different number of affected frames, caused by the packet loss scenario and the video stream structure, and each having a different PSNR. First of all, when looking at the distribution of the points, it can be observed that the number of affected frames does not behave linearly with respect to the PSNR that the model needs to learn. Using simple reasoning, one would expect that when many frames are affected by a slice loss, a strong PSNR reduction would result from this loss. In contrast, it can be observed that a large part of the range of the objective measure can be obtained from any different amount of frames affected. Obviously, even the smallest impact or change of a frame is considered as an additional affected frame. Because there is not a simple linear relation between the feature and the measure, it could be useful to design other features from which further linear correlation can be derived. Such feature would be able to provide more insight than the ones that are available in this set. So, although the precision of the designed model is high, the features should not yet be regarded as a comprehensive
generic set.
When analyzing the disagreement properties of all these se-quences, the intensities of the plotted sequences needs to be inves-tigated. Light dots indicate sequences which have a low maximum disagreement with other sequences in the set. Dark points, on the other hand, depict regions where the objective measures can reach a high disagreement when compairing all sequences of src5. This high disagreement means, that when one sequence is compared with all the others from the same source, disagreement is measured as the normalized amount of sequences on which PSNR disagrees. When taking the maximum value resulting from all comparisons with other sequences, a high value is colored darker in the plot. Fig. 4 also provides these plots with respect to SSIM and VIFP. It may be observed that agreement mainly occurs in the high and low PSNR range. So, when objective quality measures indicate a very high or a very low quality, it is more likely for the measures to agree. On the other hand, when operating at more average values, PSNR, SSIM, and VIFP tend not to agree. In both the plots of SSIM and VIFP, it can be observed that the frames affected indicator influences the rate of agreement in an insignificant way. For PSNR, the frames affected indicator influences the amount of agreement in the high PSNR quality range. This agreement persists longer at lower PSNR values when frames affected is high.
V. DISCUSSION
The analyses presented in Section IV shows that our approach can help investigating the stability of video quality measures even when a large number of test sequences are involved, which makes subjective assessments impossible. However, we remark that our aim is not substituting subjective assessment. On the contrary, we aim at identifying potential shortcomings in terms of, e.g., stability and agreement, of existing video quality metrics that could not be investigated without resorting to large scale assessment. Interesting conditions and outlier situations can be identified, further studied, and analyzed.
Moreover, the possibility to correlate the values of video quality measures with content and channel features has interesting implica-tions. For the case analyzed here (PSNR) it seems that the video quality metric value can be predicted quite reliably by a subset of content and channel features selected by using the algorithm proposed in this work. This could be the first step towards designing a hybrid No-Reference quality metric that can show good agreement with traditional full reference metrics such as PSNR.
Furthermore, although the number of affected frames provides the highest importance in predicting the PSNR within the developed model, there is no easily interpretable correlation between this feature and PSNR. Therefore, it would be beneficial to look further for features that can provide this easy to understand knowledge. Ad-ditionally, this analysis provides insight in the ranges in which the objective quality measures PSNR, SSIM, and VIFP agree. Especially in the average quality regions, comparing different sequences results in higher disagreement of the measures. This region is certainly of higher interest when performing subjective evaluation in order to further improve the large database approach of quality metric investigation.
Finally, we remark that such results can only be achieved by means of using a large scale database. In particular, we noted how some peculiar observations on the behavior of metrics such as PSNR are due to the use of a large number of combinations of coding parameters. Therefore, we plan to further extend the database, in particular in the direction of new source content and new channel conditions.
VI. CONCLUSION
This work showed how statistical analysis of a large scale database including about half a million video sequences distorted by data loss can provide insights on the behavior and particular limits of widespread simple objective video quality measures that are used partly out of scope. The agreement between the three tested measures PSNR, SSIM, and VIFP showed that the results of their prediction is similar, notably in the high and low quality range, less so in the middle range. It was further noted that the disagreement of the measurements is more pronounced in case of packet loss than for coding-only conditions which may be seen as a first step towards an automatic identification of the scope of application for objective measures. Thanks to the large size of the analyzed dataset, some important effects on the characterization of the performance were highlighted that are not evident when a limited set of sequence and parameters is considered.
It was shown that the results of the Full-Reference measures may be predicted from content features, coding, and packet-loss parameters with a high correlation, even if a reduced set of only seven parameters are used. This indicates that the complete image data may not be required in order to achieve the typical prediction performance of the evaluated measures. This is important for Reduced-Reference and No-Reference measures. Future work will investigate in more details the highlighted issues by means of, e.g., objective measures with higher computational cost and subjective evaluation, so that more effective variants of currently available video quality measures can be designed.
ACKNOWLEDGMENT
Some of the computational resources have been provided by HPC@POLITO (http://www.hpc.polito.it). Some parts of this work are supported by the Marie Skłodowska-Curie under the PROVISION (PeRceptually Optimised VIdeo CompresSION) project bearing Grant Number 608231 and Call Identifier: FP7-PEOPLE-2013-ITN. The research activities described in this paper were partially funded by Ghent University, iMinds, Flanders Innovation & Entrepreneurship (VLAIO), the Fund for Scientific Research Flanders (FWO-Flanders), and the European Union. Some aspects of this work were carried out using the STEVIN Supercomputer Infrastructure at Ghent University.
REFERENCES
[1] ITU-T, “ITU-T P.910 Subjective video quality assessment methods for multimedia applications,” ITU-T P.910, 1997.
[2] M. Pinson, C. Schmidmer, L. Janowski, R. Pepion, Q. Huynh-Thu, P. Corriveau, A. Younkin, P. Le Callet, M. Barkowsky, and W. Ingram, “Subjective and objective evaluation of an audiovisual subjective dataset for research and development,” in Quality of Multimedia Experience (QoMEX), 2013 Fifth International Workshop on, 2013, pp. 30–31. [3] K. Fliegel and C. Timmerer, “WG4 Databases White Paper v1.5:
QUA-LINET Multimedia Database enabling QoE Evaluations and Bench-marking Version 1.5,” Qualinet, 2013.
[4] F. Ciaramello and A. Reibman, “Systematic stress testing of image quality estimators,” in Image Processing (ICIP), 2011 18th IEEE International Conference on, 2011, pp. 3101–3104.
[5] M. Barkowsky, E. Masala, G. Van Wallendael, K. Brunnstrom, N. Staelens, and P. Le Callet, “Objective video quality assessment – towards large scale video database enhanced model development,” IEICE Transactions on Communications, vol. E98-B, no. 1, pp. 2–11, Jan. 2015.
[6] K. McCann, B. Bross, W.-J. Han, I.-K. Kim, K. Sugimoto, and G. J. Sullivan, “High Efficiency Video Coding (HEVC) Test Model 12 (HM 12) Encoder Description v. 12.1 Doc. JCTVC-N1002,” Nov. 2013. [7] E. Elliot, “Estimates on error rates for codes on burst-noise channels,”
Bell Syst. Tech. J., vol. 42, pp. 1977–1997, Sep. 1963.
[8] G. Van Wallendael, N. Staelens, E. Masala, and M. Barkowsky, “Full-HD HEVC-encoded video quality assessment database,” in Ninth Inter-national Workshop on Video Processing and Quality Metrics (VPQM), 2015.
[9] S. Wolf and M. Pinson, “Video quality measurement techniques,” NTIA Report 02-392, 2002.
[10] D. Hasler and S. E. Suesstrunk, “Measuring colorfulness in natural images,” in Electronic Imaging 2003. International Society for Optics and Photonics, 2003, pp. 87–95.
[11] R. M. Haralick, K. Shanmugam, and I. H. Dinstein, “Textural features for image classification,” Systems, Man and Cybernetics, IEEE Trans-actions on, no. 6, pp. 610–621, 1973.
[12] J. Lewis, “Fast normalized cross-correlation,” in Vision interface, vol. 10, 1995, pp. 120–123.
[13] K. Zhu, V. Asari, and D. Saupe, “No-reference quality assessment of H.264/AVC encoded video based on natural scene features,” in SPIE Defense, Security, and Sensing. International Society for Optics and Photonics, 2013, pp. 875 505–875 505.
[14] K. Zhu, K. Hirakawa, V. Asari, and D. Saupe, “A no-reference video quality assessment based on laplacian pyramids.” in ICIP, 2013, pp. 49–53.
[15] S. Jeannin and A. Divakaran, “Mpeg-7 visual motion descriptors,” Circuits and Systems for Video Technology, IEEE Transactions on, vol. 11, no. 6, pp. 720–724, 2001.
[16] G. Srinivasan and G. Shobha, “Statistical texture analysis,” in Proceed-ings of world academy of science, engineering and technology, vol. 36, 2008, pp. 1264–1269.
[17] Z. Wang, A.C. Bovik, H.R. Sheikh, and E.P. Simoncelli, “Image quality assessment: from error visibility to structural similarity,” IEEE Transactions on Image Processing, vol. 13, no. 4, pp. 600–612, Apr. 2004.
[18] H.R. Sheikh and A.C. Bovik, “Image information and visual quality,” IEEE Transactions on Image Processing, vol. 15, no. 2, pp. 430–444, Feb. 2006.
[19] P. Hanhart and R. Hahling, “Video quality measurement tool (VQMT),” Sep. 2013. [Online]. Available: http://mmspg.epfl.ch/vqmt
[20] C.-C. Chang and C.-J. Lin, “LIBSVM: a library for support vector machines,” ACM Transactions on Intelligent Systems and Technology (TIST), vol. 2, no. 3, p. 27, 2011.