HAL Id: pastel-00794165
https://pastel.archives-ouvertes.fr/pastel-00794165
Submitted on 25 Feb 2013HAL is a multi-disciplinary open access
archive for the deposit and dissemination of sci-entific research documents, whether they are pub-lished or not. The documents may come from teaching and research institutions in France or abroad, or from public or private research centers.
L’archive ouverte pluridisciplinaire HAL, est destinée au dépôt et à la diffusion de documents scientifiques de niveau recherche, publiés ou non, émanant des établissements d’enseignement et de recherche français ou étrangers, des laboratoires publics ou privés.
Planning
Jatin Relan
To cite this version:
Jatin Relan. Personalised Electrophysiological Models of Ventricular Tachycardia for Radio Frequency Ablation Therapy Planning. Other. Ecole Nationale Supérieure des Mines de Paris, 2012. English. �NNT : 2012ENMP0042�. �pastel-00794165�
´
Ecole doctorale n
O84:
Sciences et technologies de l’information et de la communication
Doctorat ParisTech
T H `
E S E
pour obtenir le grade de docteur d´elivr´e par
l’´
Ecole nationale sup´
erieure des mines de Paris
Sp´
ecialit´
e
“Informatique temps-r´
eel, robotique et automatique”
pr´esent´ee et soutenue publiquement par
Jatin RELAN
le 15 June 2012
Personalised Electrophysiological Models of Ventricular
Tachycardia for Radio Frequency Ablation Therapy Planning
Mod`
eles ´
electrophysiologiques personnalis´
es de tachycardie
ventriculaire pour la planification de la th´
erapie par ablation
radio-fr´
equence
Directeur de th`ese: Nicholas AYACHE Co-encadrement de la th`ese: Maxime SERMESANT Co-encadrement de la th`ese: Herv´e DELINGETTE
Jury
Reza RAZAVI, St. Thomas’ Hospital, King’s College London Pr´esident
Olaf D ¨OSSEL, Karlsruhe Institute of Technology Rapporteur
Yves COUDI`ERE, University of Bordeaux Rapporteur
Pierre JA¨IS, Haut-L´evˆeque Hospital, University of Bordeaux Examinateur Alexander V. PANFILOV, Department of Physics & Astronomy, Gent University Examinateur Nicholas AYACHE, Asclepios Research Team, INRIA Sophia Antipolis Directeur Herv´e DELINGETTE, Asclepios Research Team, INRIA Sophia Antipolis Examinateur Maxime SERMESANT, Asclepios Research Team, INRIA Sophia Antipolis Examinateur
MINES ParisTech
Centre de Math´ematiques Appliqu´ees
Personalised Electrophysiological Models of Ventricular Tachycardia for Radio Frequency Ablation Therapy Planning
Abstract:
Computer models of cardiac Electrophysiology (EP) can be a very efficient tool to better understand the mechanisms of arrhythmias. Modelling cardiac electrophysiology for arrhythmias in silico has been an important research topic for the last decades. In order to translate this important progress into clinical applications, there is a requirement to make macroscopic models that can be used for the planning and performance of the clinical procedures. The objective of this thesis was to construct such macroscopic EP models specific to each patient for study and prediction, in order to improve the planning and guidance of radio frequency ablation (RFA) therapies on patients suffering from post infarction Ventricular Tachycardia (VT). In this work, we approached this goal in the following way.
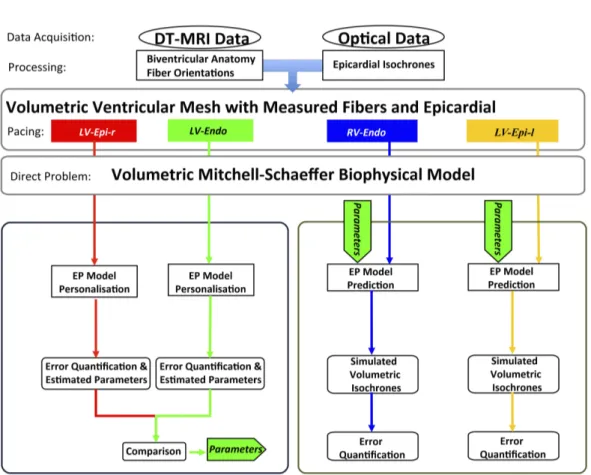
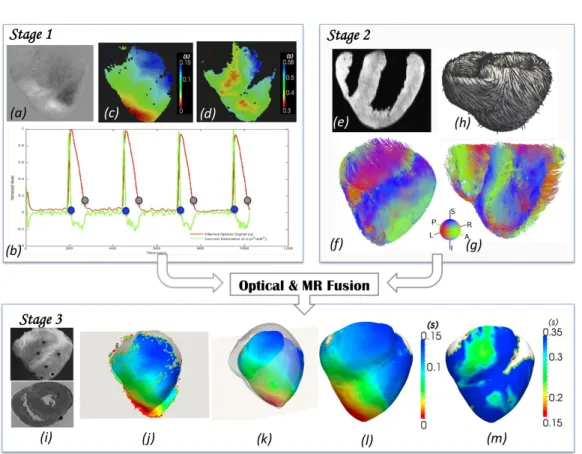
The construction of patient-specific macroscopic 3D EP model required model personalisation i.e. estimation of patient-specific model parameters. Before application to the patient data, a quantitative adjustment of such models to experimental data was needed in order to test their realism and predictive power, this remains a challenging issue at the organ scale. First, we proposed a framework for the per-sonalisation of a 3D cardiac EP model, the Mitchell-Schaeffer (MS) model, and evaluated its volumetric predictive power under various pacing scenarios. This was performed on ex vivo large porcine healthy hearts using Diffusion Tensor MRI (DT-MRI) and dense optical mapping data of the epicardium. The 3D model parameters were optimised using features such as 2D epicardial depolarisation and repo-larisation maps. The sensitivity of our personalisation framework was evaluated to different pacing locations and results on its robustness were shown. Then volumetric model predictions for various epi- and endocardial pacing scenarios were also evaluated. This work demonstrated promising results with a low personalisation and prediction error. Next, in order to apply this personalisation technique to the patient data efficiently with computations compatible with clinical constraints, we proposed a coupled personalisation framework which combines the power of the two kinds of models (simple Eikonal (EK) model & simplified biophysical MS model) while keeping the computational complexity tractable. The EK model was used to estimate the conductivity parameters, which were then used to set the parameters of the MS model. Additional parameters related to the restitution for the tissue were further estimated for the MS model. This framework was applied to a clinical dataset derived from a hybrid XMR imaging and sparse non-contact mapping procedure on a patient with heart failure. This framework was then also applied to more sparse in vivo contact mapping datasets for chronic infarcted hearts. The personalised model was also tested to determine the effects of using only endocardial or epicardial mapping measurements. Such quick personalisation of EP models to sparse clinical data opened up possibilities of using models in clinical settings to understand various diseases.
In order to simulate post-infarct VT with macroscopic 3D models, the structural and functional heterogeneity of the tissue near the scars i.e. peri-infarct zones (PIZ) was included. The structural heterogeneity was estimated through high resolution late gadolinium enhanced MRI, while functional heterogeneity was achieved from the estimated patient-specific tissue heterogeneities using the proposed coupled personalisation framework. The 3D MS model was also adapted to simulate the macroscopic structural behaviour of fibrosis near the scars in PIZ. Next, the simulation of an in silico VT stimulation study using the personalised adapted MS model was then performed, to quantify VT risk, in terms of inducibility maps, re-entry patterns and exit point maps. A rule-based modelling approach for RF ablation lesions based on state of the art studies was proposed. This approach was carried out due to the lack of patient’s imaging data on RF ablation lesions. Furthermore, the acute and chronic effects of the RFA lesions were simulated. The chronic RFA lesions were then used to assist in estimating the post ablation success of RF ablation in silico.
Lastly, the in silico VT stimulation study was applied to in vivo personalised data of patients, who underwent the clinical VT stimulation study. A validation of the in silico post-infarct VT prediction was performed against the clinical induced VT. The role of spatial heterogeneity of the patient’s car-diac tissue properties estimated from the personalisation framework, in the genesis of ischemic VT was learnt, along with their characteristics for entry/exit points, the potential candidates of RF ablation.
Keywords: Cardiac electrophysiology modelling, Arrhythmia modelling, Inverse problems,
Non-linear optimisation, Model personalisation, Radio Frequency Ablation planning, Electroanatomic map-ping, Optical mapmap-ping, Post-infarct ventricular tachycardia
Modèles électrophysiologiques personnalisés de tachycardie ventriculaire pour la planification de la thérapie par ablation radio-fréquence
Résumé : Les modèles informatiques de l’électrophysiologie (EP) cardiaque peuvent être un outil
très efficace pour mieux comprendre les mécanismes des pathologies comme l’arythmie. La modélisation de l’électrophysiologie in silico a été un sujet de recherche important ces dernières décennies. Afin de pouvoir utiliser ces progrès importants dans les applications cliniques, il faut mettre en place des modèles macroscopiques qui peuvent être utilisés pour la planification et l’évaluation des procédures cliniques. L’objectif de cette thèse est de construire de tels modèles macroscopiques spécifiques à chaque patient pour le diagnostic et la prévision, dans le but d’améliorer la planification et le guidage de l’ablation par radio-fréquence (ARF) des patients souffrant de tachycardie ventriculaire (TV) après infarctus. Dans ce travail, nous avons abordé cet objectif en plusieurs étapes :
La construction d’un modèle macroscopique 3D spécifique à un patient requiert la personnalisation de ses paramètres aux données du patient, c’est-à-dire trouver les paramêtres qui permettant de mieux reproduire les données acquises. Avant d’utiliser sur des données cliniques, cet ajustement a été validé sur des données expérimentales afin de tester le réalisme et le pouvoir prédictif, ce qui reste une question difficile à l’échelle de l’organe. Tout d’abord, nous avons proposé un cadre pour la personnalisation d’un modèle cardiaque 3D, le modèle de Mitchell-Schaeffer (MS), et nous avons évalué sa puissance prédictive dans plusieurs configurations de stimulation. Cela a été réalisé sur des données ex vivo de cœurs porcins sains à l’aide d’images médicales et des données cartographiques optiques de l’épicarde. Les paramètres du modèle 3D ont été optimisés en utilisant des fonctions telles que la dépolarisation épicardique 2D et des cartes de repolarisation. La sensibilité de notre cadre de personnalisation a été évaluée avec différentes stimulations et les résultats sur sa robustesse ont été présentés. Puis, les prédictions du modèle volumétrique sur divers scénarios de stimulation épi-et endocardiques ont également été évalués. Ensuite, afin d’appliquer cette technique de personnalisation aux données du patient de manière efficace avec des calculs compatibles avec les contraintes cliniques, nous avons proposé un cadre de personnalisation couplée qui combine deux types de modèles (eikonal (EK) et MS) tout en gardant une complexité de calcul raisonnable. Le modèle EK a été utilisé pour estimer les paramètres de conductivité, qui ont ensuite été utilisés pour définir les paramètres du modèle MS. D’autres paramètres liés à la restitution du tissu ont également été estimés pour le modèle MS. Ce cadre a été appliqué à un ensemble de données cliniques provenant d’imagerie hybride XMR et d’une procédure de cartographie sans contact sur un patient souffrant d’insuffisance cardiaque. Ce cadre a ensuite été appliqué à des données de cartographie de contact pour des affections chroniques des cœurs infarcis. Le modèle personnalisé a également été testée afin de déterminer les effets de l’utilisation de mesures de cartographie endocardique ou épicardique.
Pour simuler une TV post-infarctus avec des modèles 3D macroscopiques, l’hétérogénéité structurelle et fonctionnelle du tissu près des cicatrices (péri-infarctus zones (PIZ)) a été incluse. L’hétérogénéité structurelle a été estimée par imagerie IRM de rehaussement tardif, tandis que l’hétérogénéité fonc-tionnelle a été réalisée en utilisant le cadre de personnalisation couplé proposé. Le modèle 3D MS a également été adapté pour simuler le comportement macroscopique structural de la fibrose près des cicatrices dans les PIZ. Ensuite, la simulation d’une étude in silico de stimulation de TV en utilisant le modèle adapté personnalisé MS a été réalisée, pour quantifier le risque de TV en termes de cartes d’inductibilité, ré-entrées des modèles et des cartes de points de sortie. Une approche de modélisation pour l’ablation par RF fondée sur l’état de l’art a été proposée. Cette approche a été effectuée en raison de l’absence de données d’imagerie du patient sur les lésions d’ablation par RF. En outre, les effets aigus et chroniques des lésions RFA ont été simulés. Les lésions chroniques de ARF ont ensuite été utilisées pour aider à estimer le succès de l’ablation par RF in silico. Enfin, l’étude in silico de stimulation de TV a été appliquée aux données in vivo personnalisées des patients, qui ont suivi ce protocole. Une validation de la prévision in silico de TV post-infarctus a été réalisée et comparée à la TV clinique induite. Le rôle de l’hétérogénéité spatiale des propriétés des tissus cardiaques estimés à partir du cadre de la personnalisation dans la genèse de TV ischémique a été évalué, ainsi que les caractéristiques des points de sortie, qui sont les candidats potentiels à l’ablation par RF.
Mots clés :Modélisation d’électrophysiologie cardiaque et arythmies, problèmes inverses,
optimisa-tion non-linéale, personnalisaoptimisa-tion des modèles, planificaoptimisa-tion de l’ablaoptimisa-tion par radiofréquence, cartogra-phie électro-anatomique, cartogracartogra-phie optique, tachycardie ventriculaire post-infarctus
The best material model for a cat is another [cat], or preferably the same cat. Arturo Rosenblueth - Philosophy of Science, 1945 What distinguishes a mathematical model from, say, a poem, a song, a portrait or any other kind of "model," is that the mathematical model is an image or picture of reality painted with logical symbols instead of with words, sounds or watercolors. John Casti - Reality Rules, 1997
Acknowledgements
This thesis arose, out of years of research that has been done in the Asclepios research team, along with close collaborations with St. Thomas’ Hospital, King’s College London, UK, & Sunnybrook Health Science Centre, Toronto, Canada & Centre Hospitalier Universitaire, Bordeaux, France, within the framework of an European project euHeart, coordinated by Philips Technologies GmbH, Aachen, Germany. During this thesis, I have worked with a great number of people, whose contribution in assorted ways to the research deserves a special mention. It is a pleasure to convey my gratitude to them all in my humble acknowledgement.
First of all, I would like to thank my supervisor, Prof. Nicholas Ayache for giving me an opportunity to work, learn and grow with his prestigious and internationally renowned team. I express my gratitude towards his supervision, advice, and guid-ance from the very early stage of this research as well as his support by encouraging my work. I am grateful to my co-supervisor Dr. Hervé Delingette, for his super-vision, guidance and ideas for advancement throughout my research. I gratefully acknowledge my co-supervisor Dr. Maxime Sermesant for his advice, supervision, and crucial contribution, which made him a backbone of this research and so to this thesis. I am highly indebted to him to help my research work grow internationally with collaborative experiences with various renowned research and clinical partners. Max, I am grateful to you in every possible way and making me feel more like a friend throughout my journey at Asclepios.
I am extremely grateful to the reviewers, Prof. Olaf Dössel and Dr. Yves Coudière for having spent their precious time to read my manuscript, and for being a part of my jury. I warmly thank them for their sharp and constructive comments about my work and for their encouraging compliments. I would like to thank Prof. Alexander Panfilov to encourage my work by being a member of my jury. I am also thankful to Prof. Dr. Pierre Jaïs and Prof. Dr. Reza Razavi, to highly appreciate my work and to be my jury members, and come at my defense despite their clinical commitments. Dear committee, thank you, it has been a great honour for me to have you in my jury.
I owe a great amount of gratitude to all the people I had a chance to closely work with: Dr. Zhong Chen, for his hard work in recruiting patients for this research work and I am indebted to him for helping me out with the difficult clinical data acquisition; Dr. Mihaela Pop, for providing me the most precious experimental ex vivo data, to start of my research work; Dr. Phani Chinchapatnam, for giving me insights on electrophysiology data processing and introducing me to the power of models in clinics; Dr. Hubert Cochet, for acknowledging and encouraging my efforts in tailoring Cardioviz3D software to meet clinical needs in cardiac electrophysiology domain; Prof. Dr. Michel Haïssaguerre, Prof. Dr. Pierre Jaïs, Prof. Dr. Reza Razavi, Dr. Aldo Rinaldi, Dr. Matt Ginks, and Dr. Kawal Rhode, for supporting and encouraging my work and helping me gather clinical data; I would also like to
thank my colleagues: Dr. Amir Jadidi, Dr. Katja Odening, Dr. Mélèze Hocini, Dr. Nick Linton, Dr. Ryan Boucher, Dr. Julian Bostock, Dr. Nicolas Toussaint, Dr. Bjoern Menze, Dr. Rashed Karim, Dr. Radomir Chabiniok and Dr. Oscar Camara Rey
I should not forget to thank all the members of the euHeart project. In particular, Dr. Jürgen Weese from Philips Research, Aachen, Germany. I would also like to thank Martin Krüger and Walther Schulze from Institute of Biomedical Engineering, Karlsruhe, Germany, for working together on clinical data and helping me expand my knowledge about the atria and body surface potentials.
I am also very thankful to all the people who went along with me during these years. In particular, I would like to thank Dr. Stanley Durrleman, Dr. Barbara An-dré, Dr. Florence Billet, Dr. Liliane Ramus, Dr. Ken Wong, Dr. Ender Konukoglu, Dr. Tommaso Mansi, Dr. Jean-Marc Peyrat, Dr. Romain Fernandez, Dr. Francois Chung, Dr. Pierre Fillard, Erin Stretton, Islem Rekik, Viateur Tuyisenge, Mathilde Merle, Rocio Cabrera Lozoya, Kristin Mcleod, Marine Breuilly, Adityo Prakosa, Hervé lombaert, Hugo Talbot, Ezequiel Geremia, Stephanié Marchesseau, Jan Mar-geta, Marco Lorenzi, Federico Spadoni, Christof Seiler, Vikash Gupta, Loic Le Fol-goc, Nicolas Cordier, Thomas Benseghir, Arnaud Le Carvennec, Chloe Audigier, Alan Garny, Sonia Durand, Bishesh Khanal, Erik Pernod, Benoît Bleuzé, Vincent Garcia, Florian Vichot, John Stark, Brina Goyette, Michael Knopke, Florence Dru, Aurélie Canale, Daniel Barbeau, Dr. Olivier Clatz, Dr. Grégoire Malandain, Dr. Xavier Pennec and all the Asclepios team for the warm welcome and the good time we spent together. I am also extremely grateful to Isabelle Strobant, for being always there when needed.
Last but not least, I would have never got this far without the support and love of my close friends, my mother and my family. Finally I would like to thank God for helping me and being with me all my way through this thesis work and my life. Let this be a gratification to you.
Table of Contents
I INTRODUCTION 1 1 Introduction 3 1 Clinical Context . . . 3 2 Manuscript Organisation . . . 5 2 Cardiac Electrophysiology 8 1 Anatomy . . . 82 Cardiac Electrical System & Arrhythmias . . . 9
3 Mapping Cardiac Electrophysiology . . . 12
4 Modelling Cardiac Electrophysiology . . . 17
5 Modelling Cardiac Arrhythmias . . . 25
6 Conclusion. . . 27
II PERSONALISATION OF CARDIAC ELECTROPHYSIOL-OGY MODELS 29 3 Building Personalised EP Models using ex vivo Experimental Data (Optical Mapping) 31 1 Introduction . . . 32
2 Data Acquisition and Processing . . . 34
3 Model Simulation: Direct Problem . . . 37
4 Model Personalisation: Inverse Problem . . . 38
4.1 Case 1: Personalisation Using a Single PF . . . 39
4.2 Personalisation of DT Isochrones . . . 39
4.3 Personalisation of Action Potential Duration. . . 42
4.4 Case 2: Personalisation Using Multiple PF. . . 42
4.5 Personalisation of Restitution curves . . . 42
4.6 Personalisation of DT Isochrones . . . 43
5 Results. . . 43
5.1 DT & APD error maps . . . 44
5.2 Fitting of restitution curves . . . 44
5.3 Robustness to Pacing Location . . . 46
5.4 Evaluation of Volumetric Predictions . . . 46
6 Discussion . . . 47
4 Building Personalised EP Models using in vivo Clinical Data
(Non-Contact Mapping) 51
1 Introduction . . . 52
2 Clinical Context . . . 54
2.1 Depolarisation and Repolarisation times extraction . . . 55
3 Cardiac Electrophysiology Models. . . 56
3.1 Eikonal Model (EK Model) . . . 56
3.2 Simplified Biophysical Model (MS Model) . . . 57
4 Coupled Personalisation Method . . . 58
4.1 Apparent Conductivity Parameter Estimation . . . 58
4.2 Coupling of EK and MS Model Parameters . . . 59
4.3 Parameter Estimation for APD Restitution . . . 60
5 Results. . . 62
5.1 Parameter Estimation . . . 62
5.2 Assessment of Heterogeneity Maps . . . 64
6 Discussion . . . 64
6.1 Data Limitations . . . 64
6.2 Model Simplifications . . . 65
6.3 Conclusion . . . 66
5 Building Personalised EP Models using in-vivo Experimental Data (Contact Mapping) 67 1 Introduction . . . 68
2 3D Electrophysiology Model with Chronic Infarction . . . 68
3 Contact Mapping and MR Dataset Processing . . . 69
4 Building personalised electrophysiological model. . . 71
4.1 Coupled personalisation approach (EK-MS) . . . 71
4.2 Application . . . 71
5 Conclusion. . . 73
III MODELLING VENTRICULAR TACHYCARDIA & RF ABLATION 75 6 Personalised Ventricular Tachycardia Modelling 77 1 Introduction . . . 78
2 Modelling Post-infarction Ventricular Tachycardia. . . 80
2.1 Structural Heterogeneity . . . 80
2.2 Functional Heterogeneity . . . 87
3 Modelling of Clinical VT-Stimulation Protocol. . . 90
3.1 VT Induction . . . 90
3.2 VT-Stim Modelling . . . 91
4 VT Risk Stratification . . . 92
Table of Contents xiii
7 Modelling Radio-Frequency Ablation 95
1 Radio-frequency Ablation: Concepts & Modelling . . . 96
1.1 Types of Ablation . . . 97
1.2 RF Ablation of VT . . . 98
1.3 Lesion Formation . . . 99
1.4 Lesion Size . . . 104
1.5 Lesion Characteristics & Modelling . . . 105
2 Radiofrequency Ablation on VT patients . . . 106
2.1 Simulation of Radiofrequency Ablation . . . 106
2.2 Short Term Effect of RF Ablation . . . 106
2.3 Long Term Effect of RF Ablation . . . 108
3 Conclusion. . . 109
IV CLINICAL APPLICATION & VALIDATION 111 8 Planning of Radio Frequency Ablation using in-vivo Clinical Data113 1 Introduction . . . 114
2 Methods . . . 115
2.1 Clinical Study: Patient Recruitment and Pacing Protocol . . 115
2.2 Data Analysis . . . 116
2.3 VT Modelling Study: Personalisation and Pacing Protocol . . 117
3 Results. . . 122
3.1 Estimation of the patient-specific spatial heterogeneities . . . 122
3.2 Correlation of the spatial heterogeneities: Inter-patients . . . 124
3.3 Induced VT: Clinical observations vs. Model predictions . . . 126
3.4 VT & Exit point predictions . . . 127
4 Discussion . . . 128
4.1 Tissue conductivity & APD restitution slope heterogeneity. . 128
4.2 Data Limitations & Model personalisation . . . 130
4.3 VT Model Predictions & Simplifications . . . 131
5 Conclusion. . . 131
V CONCLUSION 133 9 Conclusions & Perspectives 135 1 Contributions . . . 135
2 Perspectives . . . 138
2.1 Methodological perspectives . . . 138
2.2 Short-term & Mid-term clinical perspectives . . . 140
10 List of Publications 143
1 First-authored Methodological Papers (Peer-Reviewed) . . . 143
2 Clinical Abstracts. . . 144
3 Co-authored Publications . . . 145
4 European project deliverables . . . 146
VI APPENDIX 149 Appendix A Quantitative Comparison of Two Cardiac Electrophysi-ology Models 151 Appendix B Time Integration schemes & Spatial and Temporal res-olution 153 1 Time integration . . . 153
1.1 First Order Schemes . . . 153
1.2 Second Order Schemes . . . 154
1.3 Third Order Schemes. . . 155
2 Choosing optimum spatial & temporal resolutions . . . 155
Appendix C Model specifications and performance 157 Appendix D Figure Glossary 160 1 EP model personalisation to ex-vivo optical data . . . 161
2 EP model prediction to various pacing locations . . . 162
3 VT induction after personalisation . . . 163
4 in-silico RFA planning after personalisation . . . 165
5 Induced VT circuit from clinical data . . . 166
6 Integration of BSPM - Ensite Mapping . . . 167
7 Clinical VT-Stim protocol . . . 169
Abbreviations & Nomenclature
Table 1: Abbreviations and acronyms used in this thesis. Acronym Description
3D-SSFP 3 Dimensional Steady-State Free Precession MR imaging AHA American Heart Association
AC Apparent Conductivity
AP Action Potential
APath Accessory Pathway
APD(RC) Action Potential Duration (Restitution Curve) APD Rest Action Potential Duration Restitution
ARI Activation Recovery Interval
AV Atrioventricular Node
AVNRT AtrioVentricuar Nodal Reentry Tachycardia BSP(M) Body Surface Potential (Mapping)
Cath Lab Catheterisation Laboratory
CHU Centre Hospitalier Universitaire, Bordeaux, France
CL Cycle Length
CT Computed Tomography
CV Conduction Velocity
CV Rest Conduction Velocity Restitution CVD CardioVascular Disease
DCM Dilated CardioMyopathy
DI Diastolic Interval
DT Depolarisation Time
ECG ElectroCardioGraphy
ECGI ElectroCardioGraphy Imaging derived from BSPM
ED Eikonal-Diffusion
EK Eikonal Model
EM Electro-Mechanical (model)
EP ElectroPhysiology
EPS ElectroPhysiology Study
FEM Finite Element Method
FK Fenton-Karma (cell model)
FMM Fast Marching Method
FWHM Full Width at Half Maximum
IBT Institute of Biomedical Engineering, Karlsruhe, Germany ICD Implantable Cardioverter-Defibrillator
ICM Ischemic CardioMyopathy
ICT Information and Communication Technology IHD Ischemic Heart Disease
KCL King’s College London, UK
LA Left Atrium
LAT Local Activation Times
LE MRI Late Enhancement Magnetic Resonance Imaging
LGE-CMR Late Gadolinium Enhanced Cardiac Magnetic Resonance imaging LIVT Left Idiopathic Ventricular Tachycardia
LV Left Ventricle
LVEF Left Ventricular Ejection Fraction MAP Monophasic Action Potential
MCNAB Modified Crank-Nicolson/Adams-Bashforth
MIPS Medical Image Processing and Simulation (INRIA library)
MI Myocardial Infarction
MM Minimal Model (cell model)
MR(I) Magnetic Resonance (Imaging) MS Mitchell-Schaeffer (cell model)
NCM Non-Contact Mapping
PDE Partial Differential Equation
PF Pacing Frequency
RA Right Atrium
RC Restitution Curves
RF(A) Radio-Frequency (Ablation)
RT Repolarisation Time
RV(A) Right Ventricle (Apex)
RVOT Right Ventricular Outflow Tract
SA Sinoatrial Node
SCD Sudden Cardiac Death
TNNP Ten Tusscher-Noble-Noble-Panfilov (cell model) VF Ventricular Fibrillation
VT Ventricular Tachycardia
VT-Stim Ventricular Tachycardia Stimulation
Table 2: Nomenclature used. Nomenclature Description Na+ Sodium ions Ca2+ Calcium ions K+ Potassium ions Cl− Chlorine ions Cm membrane capacitance
Iion total ionic current
Im membrane current
Jstim stimulus current
Ix membrane current for ion x
Jin total inward ionic currents Jout total outward ionic currents
σ stress tensor
Td depolarisation time
Tr repolarisation time
Vm membrane voltage
D Diffusion tensor
d pseudo-conductivity in the fiber direction (apparent conductivity) dM S pseudo-conductivity in the fiber direction for MS model (s−1) dEK pseudo-conductivity in the fiber direction for EK model (m2) r conductivity anisotropy ratio in transverse planes (no unit) τopen opening time-constant of the gate (s)
τclose closing time-constant of the gate (s)
τin time-constant for inward currents (s) τout time-constant for outward currents (s)
Part I
Chapter 1
Introduction
Contents 1 Clinical Context . . . 3 2 Manuscript Organisation . . . 51 Clinical Context
The pathophysiology of the heart represents a highly relevant and epidemiologically significant contributor to mortality and loss of quality of life within Europe, where each year cardiovascular diseases (CVD) cause over 4.35 million deaths including nearly half of all non-accidental deaths [PPR+05]. This, currently western, epidemic
is now also spreading to developing nations with CVD predicted to become the most common cause of death in these countries by 2030 [Org09,Org04,Org03]. CVD is most commonly a consequence of atherosclerosis, manifesting itself in diseases such as coronary artery disease, congestive heart failure, cardiac arrhythmias and sudden cardiac death (SCD). The loss of quality and quantity of life producing a significant financial burden is spread across community sectors with approximately 62% of costs due to direct health care costs, 21% due to productivity losses and 17% due to the informal care of people with CVD. Thus the early detection and prediction of the progression of CVD are key requirements towards improved treatment, a reduction in mortality and morbidity, and of course to reduce healthcare costs within the European economy.
In the majority of cases, SCD is triggered by the onset of ventricular tachy-cardia (VT), an abnormally rapid heart rate originating in the ventricle [HCM01]. If undetected and untreated, VT can rapidly degenerate in ventricular fibrillation (VF) which is a chaotic propagation of the electrical impulse in the heart, caus-ing an abnormal contraction and inefficient blood pumpcaus-ing. This cascade of events leads within minutes to cardiac arrest and asystole (no pulse) and eventually to death unless the heart’s electrical activity is immediately restored using defibrilla-tion shocks [RZ+05]. Termination of sustained VT can be achieved by cardioversion
in order to reset the overall electrical activity of the heart. Cardioversion by shock therapy can be achieved by external electrical defibrillation or internally via an im-plantable cardioverter-defibrillator (ICD) that continuously monitors for and can detect episodes of VT. In the case of monomorphic VT, termination can also be
achieved by anti-tachycardia pacing, which is accomplished by the ICD rapidly pac-ing the heart. The use of ICDs for secondary prevention has been increaspac-ing because ICD therapy has been proven to reduce mortality by up to 39% in patients who sur-vived near fatal VF or who have sustained VT [LGL+03]. The percentage of VT
patients with appropriate ICD firing was 68% at one year and 81% at two years after implantation. However, ICD therapy is a non-curative approach to patients with VT. It does not prevent the VT from occurring, and up to 80% of ICD re-cipients still require pharmacological anti-arrhythmic therapy [FGDSG07]. Patients with frequent ICD firing due to monomorphic VT also experience significantly de-creased quality of life associated with VT symptoms and distress anticipating ICD activation, and hence require additional therapy.
Radio-frequency (RF) ablation offers a potential curative therapy for monomor-phic VT, which aims to interrupt the re-entry circuit by placing RF thermal lesions on the isthmus. However, the major challenge is identification of the location of the VT substrate (i.e., the isthmus in the re-entry circuit). Currently, this can be achieved with electrophysiological (EP) substrate mapping, a technique that constructs voltage, propagation and impedance maps of the endocardium and/or epicardium, most commonly via intra-cardiac catheter-based procedures. However, there is a clear need to improve the methods to characterise the substrate of VT, and to explore other modalities that can supplement diagnostic information and can help in selecting better treatment strategies. Those patients with monomorphic sustained VT associated with chronic infarct, particularly those being considered for RF ablation (RFA), are an important initial target population. Advances leading to improved treatment planning and outcomes assessment would have immediate impact on the quality of life in this substantial patient population. Thus, research efforts are focused towards construction of accurate patient-specific treatment plat-forms.
A large part of this thesis was performed within the euHeart1project, a four-year
European project partially funded by the European Community (7th Framework Program) (Fig. 1.1). The project is coordinated by Philips Technologies GmbH Aachen (DE), and involved 15 technical partners (including INRIA, France) and three clinical partners, namely King’s College London (London, UK), University Hospital Pontchaillou (Rennes, France) and Hospital Clínico San Carlos de Madrid Insalud (Madrid, Spain). The aim of the euHeart project is to incorporate In-formation and Communication Technology (ICT) tools and integrative multi-scale computational models of the heart within clinical environments to improve diag-nosis, treatment planning and interventions for CVD and thus to reduce the allied healthcare costs. These computational models also provide an excellent basis to optimise the design of implantable devices for improved therapy. The opportunity of multi-scale modelling spanning multiple anatomical levels (sub-cellular level up to whole heart) is to provide a consistent, biophysically-based framework for the integration of the huge amount of fragmented and inhomogeneous data currently
2. Manuscript Organisation 5
Figure 1.1: Diagram of the euHeart, a European research initiative targeting the personalised diagnosis and treatment of cardiovascular disease: the leading cause of morbidity in the western world. Image taken from http://www.euheart.eu/
available. However, the application of this research was not been translated into clinical environments mainly due to the difficulty of efficiently personalising the biophysical models and to the lack of multidisciplinary research.
The objective of this work was to use personalised biophysical models of the cardiac electrophysiology in order to improve the planning and guidance of radio-frequency ablation therapies on patients suffering from Ventricular Tachycardia (VT). Indeed, there is no clinical consensus about the optimum RF ablation patterns for these diseases yielding to a great deal of trial and error during the procedure which highly depends on the cardiologist’s experience. This work on using person-alised models to guide RF ablation therapies can provide a consensus on optimum RF ablation patterns for these diseases.
In order to plan and guide RF ablation therapy for VT the questions mainly tackled in this thesis were:
• How do we personalise biophysical models to the sparse in vivo clinical data? • How do we simulate ischemic ventricular tachycardia and RF ablation patterns,
as observed as in clinics and provide guidance and planning? • Are we really simulating patient-specific ischemic VT?
2 Manuscript Organisation
The thesis is organised along our published and submitted studies, on which it is largely based. The resulting manuscript progresses from the development of per-sonalisation tools for cardiac EP models, to the modelling & prediction of cardiac
arrhythmias for planning of RF ablation therapy. The definition of personalisation used in this thesis is: parameter estimation of 3D cardiac EP models derived from patient’s imaging and electrophysiological mapping data.
This thesis is organised in three parts demonstrating the three main contribu-tions: 1) Development of personalisation frameworks for 3D cardiac EP models, using various cardiac EP mapping data. 2) Modelling ventricular tachycardia and RF ablation lesions, for planning of RF ablation therapy. 3) Prediction & validation of ventricular tachycardia using clinical data.
Chapter2gives a background on cardiac anatomy, myocardial infarction, elec-trophysiology and ventricular arrhythmias. It also describes the state of the art technologies used in clinics, for mapping cardiac electrophysiology. Along with the basics and state of the art research being carried out in modelling cardiac electro-physiology in silico.
In Chapter 3, based on [RPD+11], we propose a framework for the
person-alisation of a 3D simplified biophysical cardiac EP model, the Mitchell-Schaeffer (MS) model to 2D epicardial ex vivo optical and MR data. We also evaluate its volumetric predictive power under various pacing scenarios. The sensitivity of the personalisation framework to different pacing locations is also performed.
In Chapter4, based on [RCS+11], we propose a coupled personalisation
frame-work, which combines the benefits of a simplified eikonal model (EK) with a simpli-fied biophysical MS model. We also demonstrate its applicability to in vivo clinical data using non-contact EP mapping data.
In Chapter 5, based on [RSDA11], we extend the framework’s applicability to in vivo contact EP mapping data. And we also evaluate the influence of using only endocardial mapping or epicardial mapping measurements, on the personalisation framework.
In Chapter6, based on [RCS+11,RDS+11], we illustrate the main macroscopic
characteristics of post-infarction Ventricular Tachycardia (VT) (chronic ischemic VT), and adapt the simplified biophysical MS model to incorporate those features. The personalised MS model derived from the in vivo clinical data is then used to perform an in silico simulation of a VT stimulation study to predict the induction of VT. This simulation study is used to assess the risk of VT for the patient and also to plan a potential subsequent radio-frequency (RF) ablation strategy to treat VT.
Implantation of ICD post ablation, causes the unavailability of imaging data on RF ablation lesions for VT patients. In Chapter7, based on [RDS+11], we propose
a rule based modelling approach of RF ablation lesions post ablation therapy, based on the state of the art studies. The RF ablation lesions are also modelled to simulate the acute and chronic effects of RFA therapy. The acute RF ablation lesions are then be modelled in the simulated VT stimulation study to assist in robust location of potential RF ablation lines in silico, while chronic RF ablation lesions could then be modelled in accessing the long-term success rate of RFA therapy.
In Chapter8, based on [RCD+12] we apply the in silico VT stimulation study
2. Manuscript Organisation 7 study. A validation of the in silico VT prediction is performed against the clinical induced VT. We also study the role of spatial heterogeneity of the cardiac tissue properties estimated from the personalisation framework, in the genesis of ischemic VT, and learn their characteristics for entry/exit points.
Lastly, Chapter9concludes this thesis with the list of contributions and directs us towards the feasible perspectives to this work. Chapter 10provides the list of publications written during this work, along with some co-authored publications and European project deliverables.
Cardiac Electrophysiology
Contents
1 Anatomy. . . 8
2 Cardiac Electrical System & Arrhythmias . . . 9
3 Mapping Cardiac Electrophysiology . . . 12
4 Modelling Cardiac Electrophysiology . . . 17
5 Modelling Cardiac Arrhythmias. . . 25
6 Conclusion . . . 27
1 Anatomy
The heart is a powerful muscular organ whose shape and function optimise the pump function while minimising the muscular work. It is located anterior to the vertebral column and posterior to the sternum. It is enclosed in a double-walled sac called the pericardium. The superficial part of this sac is called the fibrous pericardium. This sac protects the heart, anchors its surrounding structures, and prevents overfilling of the heart with blood. The outer wall of the heart is composed of three layers. The outer layer is called the epicardium. The middle layer is called the myocardium and is composed of cardiac muscle which contracts. The inner layer is called the endocardium and is in contact with the blood that the heart pumps.
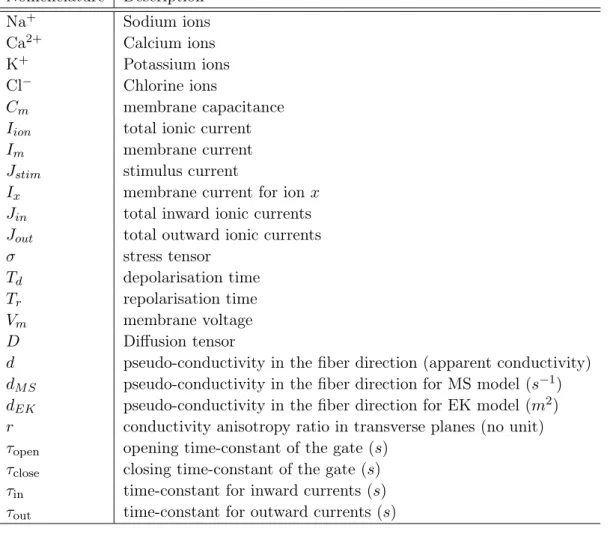
The human heart has four chambers, two superior atria and two inferior ven-tricles (Fig. 2.1). The atria are the receiving chambers and the ventricles are the discharging chambers. The pathway of blood through the heart consists of a pul-monary circuit and a systemic circuit. De-oxygenated blood flows through the heart in one direction, entering through the superior vena cava into the right atrium (RA) and is pumped through the tricuspid valve into the right ventricle (RV) before be-ing pumped out through the pulmonary valve to the pulmonary arteries into the lungs. It returns from the lungs through the pulmonary veins to the left atrium (LA) where it is pumped through the mitral valve into the left ventricle (LV) before leaving through the aortic valve to the aorta.
Myocardial Infarction Myocardial infarction (MI) results from the interrup-tion of blood supply to a part of the heart, causing heart cells to die. This is most commonly due to occlusion of a coronary artery following the rupture of a
2. Cardiac Electrical System & Arrhythmias 9
Figure 2.1: (a) Human heart, (b) Heart function (Images from Wikipedia) (c) Seg-mented whole heart model from SSFP MR images
Figure 2.2: (a & b) Myocardial infarction of the tip of the anterior wall of the heart, (Images from Wikipedia) (c) LE-CMR images showing infarction on the posterior wall (highlighted in box)
vulnerable atherosclerotic plaque (Fig. 2.2). The resulting ischemia (restriction in blood supply) and ensuing oxygen shortage, if left untreated for a sufficient period of time, can cause irreversible damage or death (infarction) of heart muscle tissue (myocardium). Ischemic heart disease (IHD), or chronic myocardial ischemia, is a disease characterised by ischemia of the heart muscle, usually due to coronary artery disease (atherosclerosis of the coronary arteries). Infarcted tissue can cause a cardiac arrest, which is the stopping of the heartbeat, and cardiac arrhythmia, an abnormal heartbeat.
2 Cardiac Electrical System & Arrhythmias
The normal intrinsic electrical conduction of the heart allows electrical propagation to be transmitted from the Sinoatrial (SA) Node through both atria and forward
to the Atrioventricular (AV) Node, then to the ventricle or Purkinje network and respective bundle branches (Fig.2.3). Time ordered stimulation of the myocardium allows efficient contraction of all four chambers of the heart, thereby allowing sys-temic blood circulation.
Cardiac action potentials arising in the SA node (and propagating to the left atrium via Bachmann’s bundle) cause the atria to contract with a speed (Conduction Velocity (CV)) of ≈ 0.5 m/s. In parallel, action potentials travel to the AV node via internodal pathways. After a delay (≈ 0.07 s), the stimulus is conducted through the bundle of His (≈ 2 m/s) to the bundle branches (≈ 2 m/s) and then to the Purkinje network (≈ 4 m/s) at the endocardium (mostly apical) of the heart, then finally to the ventricular myocardium(≈ 0.5 m/s) [MKY+02].
The pathway can be summarised as: SA node → internodal pathway → transi-tional fibres → AV node → penetrating fibres → distal fibres → Bundle of his/AV bundle → right and left bundle branches → Purkinje network (Fig. 2.3)(a). The total time taken by the nerve impulse to travel from the SA node to the ventricular myocardium is ≈ 0.19 seconds [MKY+02].
Action potentials (Fig.2.3(c,d)) are generated by the movement of ions through the transmembrane ion channels in the cardiac cells (Fig.2.3)(b):
• Phase 0 – Depolarisation Rapid Na+ channels are stimulated to open, flooding the cell with positive sodium ions. This causes a positively directed change in the transmembrane potential. Depolarisation of one cell triggers the Na+ channels in surrounding cells to open as well, causing the depolarisation wave front to propagate cell by cell throughout the heart. The speed of depo-larisation of a given cell (the slope of phase 0), determines how soon the next cell will depolarise, thus the CV.
• Phase 1 - Early Repolarisation is the initial stage of repolarisation with outflux of K+ & Cl−.
• Phase 2 - Plateau is the plateau stage where the rate of repolarisation is slowed by the influx of Ca2+ions into the cell. The Ca ions enter the cell slower than the Na ions and help prevent the cell from repolarising too quickly, thus extending the refractory period. This mechanism helps regulate the rate at which cardiac tissue can depolarise. Phases 1 & 2 correspond to the absolute refractory period.
• Phase 3 - Repolarisation is the later stages of repolarisation with outflux of K+. Once repolarisation is complete, the cell will be able to respond to a new stimulus. Phase 3 is that critical period where a strong signal may trigger depolarisation which could lead to VT or VF.
• Phase 4 -Resting occurs after repolarisation is complete. During this phase, known as the quiet or quiescent phase, there is no ion exchange across the cellular membrane in most cardiac cells. Time difference between Phase 1 & 3 represents the Action Potential Duration (APD) for the cardiac cell.
2. Cardiac Electrical System & Arrhythmias 11
Figure 2.3: (a) Heart conduction system, the electrical activity of the heart is trig-gered by the sinoatrial nodes (1) and then the atrioventricular nodes (2). It is transported by the left bundle (5) and the right bundle (10) branches and finally transmitted to the myocardium (8) through the Purkinje fibres (9). (c) Simplified ECG with the main electrical waves (Images from Wikipedia). (b) Ion exchanges at the surface of the cell membrane that generate the cardiac action potential [Mar02]. (d) Cardiac action potential
The cells in different regions of the heart do not all have the same action po-tential, and thus have varying conduction velocities. Electrocardiography (ECG) is a transthoracic interpretation of the electrical activity of the heart over a period of time, as detected by electrodes attached to the torso. It is decomposed with PQRST waves. P wave for atrial depolarisation, QRS complex reflects the rapid depolarisation of ventricles, T wave represents the repolarisation of the ventricles. The atrial repolarisation is hidden in the QRS complex. QT interval represents the APD over the ventricles. Cardiac arrhythmia is any of a large and heterogeneous group of conditions in which there is abnormal electrical activity in the heart. The heartbeat may be too fast (tachycardia) or too slow (bradycardia), and may be regular or irregular.
Ventricular Tachycardia Ventricular tachycardia (VT) is a fast heart rhythm, that originates in one of the ventricles of the heart. This is a potentially life-threatening arrhythmia because it may lead to ventricular fibrillation, asystole, and
Figure 2.4: (a) Schematics of RF ablation therapy & electrophysiology study (EPS) of cardiac arrhythmias (Images from Heart Centre Bad Krozingen) (b) Schematics of ischemic VT on LV free wall (www.medmovie.com)
sudden death. VT can be classified based on its morphology: Monomorphic VT (sustained morphology) & Polymorphic VT (beat-to-beat variations in morphology). The most common setting for VT is ischemic heart disease (Fig. 2.4(b)), in which myocardial scar tissue is the substrate for electrical re-entry. Treatments include synchronised electrical cardioversion, ICD implantation, cardiac ablation & anti-arrhythmic drug therapy.
Radio-Frequency ablation of Ventricular Tachycardia Radio-frequency ab-lation is one of the treatment for VT. Using catheters, radio-frequency energy (low-voltage, high-frequency electricity) is targeted toward the area(s) causing the ab-normal heart rhythm, permanently damaging small areas of tissue with heat. The damaged tissue is no longer capable of generating or conducting electrical impulses. If the procedure is successful, this prevents the arrhythmia from being generated, curing the patient. In some patients, insertion of a pacemaker is a planned part of the procedure. The ablation catheters are usually inserted into the vein or artery in the right and left groin (inner thigh) and are then positioned within the cham-bers of the heart using fluoroscopy (Fig. 2.4(a)). An electrophysiology study, as explained in the section3, is then performed to identify regions of the heart causing arrhythmia, and then ablated.
3 Mapping Cardiac Electrophysiology
Cardiac electrophysiology can be mapped with a host of systems, depending on the state of the mapped heart (ex-vivo & in-vivo). For in vivo mapping, in a clinical routine, cardiac electrophysiology is usually assessed non-invasively with electro-cardiograms (ECG). The ECG is obtained by placing skin electrodes on the torso,
3. Mapping Cardiac Electrophysiology 13
Figure 2.5: Schematic of an optical experiment using a dual-camera system to record the action potential from the heart perfused ex vivo via a Langendorff system (a) and a snapshot of the actual experiment (b). (a,b taken from [PSL+09]). (c)
Schematics for a cardiac epi-fluorescence experiment in isolated guinea pig hearts used in [HZS+08] for 3D optical imaging. (d) Myocardial wave reconstruction based
on subsurface wave front orientation (towards or away from the epicardium) and fluorescent signal (maximal time derivative) employed in [HZS+08]. (c,d taken
from [HZS+08])
that measure the electrical signal produced by the heart. This routine has been widely used for centuries in clinics and the clinicians are trained to detect cardiac abnormalities based on the deflections from normal shapes of ECGs (Fig.2.3(c)). Optical mapping For ex-vivo cases, optical mapping techniques are widely used. They use imaging devices such as a photodiode array or a charge-coupled device video camera with the heart being illuminated and either continuously or spa-tially scanned. The basis for these techniques is the use of voltage-sensitive dyes (VSD) that bind to or interact with cell membranes. It has been the method of choice to investigate arrhythmias experimentally at the tissue or whole heart level [RJ01, ENS04]. VSDs can be introduced through coronary flow without sig-nificant tissue damage and bind to the cardiac cell membranes. They respond to changes in transmembrane potential by changes in excitation and fluorescence spectra, which allow monitoring the cells electrical activity. Although recent ad-vances have been made towards 3D optical imaging of cardiac electrical activity
[KBMP06, HBP+07, HZS+08], surface epi-fluorescence imaging remains the most
Recently [HBP+07] presented a study of the 3D propagation of electrical waves in
the heart wall using Laminar Optical Tomography (LOT), and showed promising re-sults which demonstrated that LOT can clearly resolve the direction of propagation of electrical waves within the cardiac wall in the rat ventricular tissue.
Minimally invasive electroanatomic mapping Cardiac electrophysiology can also be studied intensively for arrhythmia patients, with minimally invasive methods during an electrophysiology study (EPS). This procedure is performed in a Catheter-isation laboratory (Cath lab) which is a specially equipped operating room. In order to reach the heart with a catheter, a site is prepared that will allow access to the heart via an artery or vein, usually in the groin. This site is then described as the insertion point. Once the catheter is in and all preparations are complete, the EP study begins. The X-ray machine gives a view of the heart and the position of the electrodes, and allows the doctor to guide the electrodes through the heart. The electro-physiologist begins by moving the electrodes along the conduction pathways and along the inner walls of the heart, measuring the electrical activity along the way.
A number of software tools, like the CARTO EP Contact Navigation System (Biosense Webster, Inc., CA) (Fig. 2.6) and the EnSite Velocity Non-contact Map-ping system (St. Jude Medical, MN, U.S.A.) (Fig. 2.7) have been developed aiming to facilitate the mapping of measured electrical activity on the living anatomy of the heart including the relative position of the catheter. These two systems are widely available, and mainly represent the two distinct approaches, which are the contact and the non-contact technique of electroanatomical mapping. The first step of 3D electroanatomical systems is to create an accurate anatomical model. The creation of the anatomic model of a cardiac chamber is heavily operator-depended, meaning that improper selection of points by the operators may result in an untrustworthy model. Misleading anatomy often results in diagnostic pitfalls by omitting crucial parts of the arrhythmia circuit or the arrhythmia foci. A minimum of 50 points are needed by both contact (CARTO) and non-contact (EnSite) 3D electroanatomical systems to create the anatomy of a chamber of the heart, but 100 points are usually appropriate. The accuracy of the 3D anatomical model can be compromised by un-controlled factors such as the extreme breathing movements, tension of the mapping catheter towards the myocardial wall and movement of the reference catheter. Comparison between contact and non-contact electroanatomical mapping Electroanatomical mapping has been proved to be quite useful in arrhythmias of complex pathophysiological substrate and in poorly tolerated arrhythmias. Al-though, both contact and non-contact electroanatomical mapping can be used to facilitate ablation of VT, the non-contact mapping has the potential advantage to be applicable in cases where the arrhythmia cannot be tolerated or in cases where the clinical arrhythmia is not reproducible during the electrophysiology study. Finally, the dynamic changes of the arrhythmogenic substrate induced by radio-frequency
3. Mapping Cardiac Electrophysiology 15 Table 2.1: Current applications of electroanatomical mapping systems. Table from [AKTM09]
Cardiac arrhythmia Mapping system
AVNRT not necessary/ NavX system
APath-related not necessary/ NavX system
Atrial tachycardia contact/non-contact mapping
Nonsustained non-contact mapping
Atrial flutter contact/non-contact mapping
Atrial fibrillation contact mapping
Ventricular tachycardia contact/non-contact mapping
RVOT VT/ LIVT not necessary/only for difficult cases
IHD/DCM contact/non-contact mapping
Nonsustained/unstable non-contact mapping
Sustained/stable contact/non-contact mapping
ablation can be continuously evaluated by the operator. This advantage is of clinical importance, given the unexpected changes of the complex arrhythmogenic substrate, which may occur during the ablation of ventricular tachycardias, especially in the setting of ischemic cardiomyopathy. In this setting, it is not uncommon that differ-ent forms of vdiffer-entricular arrhythmias may appear after the clinical arrhythmia has been successfully ablated. Continuous monitoring of the virtual electrograms and of the propagation map, afforded by the non-contact mapping during sinus rhythm and during ventricular arrhythmias, may help the operators to effectively create a curative strategy.
Conversely, in the case of contact electroanatomical mapping, a complete remap-ping should be performed after the relapse of an arrhythmia because the previous electroanatomical map is no longer valid if radio-frequency ablation lesions have been applied. This is time consuming and in some cases it can be proved simply not feasible. Mapping only the area of interest can be another strategy. On the other hand, the EnSite balloon catheter is expensive and occupies a large space in the cavity of interest. In particular it consists of a 64-electrode mesh, mounted on the outside surface of a 18 x 40 mm balloon (Fig.2.7b) . After appropriate positioning in the cavity of interest, this balloon should not be moved, thereafter. The balloon itself often represents an obstacle to the manipulation of the ablation catheter. Non-invasive body surface mapping Century-old routine of non-invasive de-tection and diagnosis of the cardiac electrical activity is performed with a 12-lead electrocardiogram (ECG), a widely used test that is part of routine medical care. However, this technology measures the reflection of cardiac electrical activ-ity on the surface of the body (body surface potential), not on the heart itself. Therefore, it has limited spatial resolution for determining regional cardiac elec-trical activity and limited ability to locate regions of arrhythmic activity in the heart. Recently, [Rud10, WCZ+11, WSD+07] have demonstrated a similar
Figure 2.6: (a) Fluoroscopic images of the chest, showing CARTO contact mapping catheters in LV (b). (c) Electroanatomical mapping with CARTO EP Contact Navigation System (Images from CHU, Bordeaux)
Figure 2.7: (a) Fluoroscopic images of the chest, showing EnSite balloon non-contact mapping catheters in LV. (b) deflated and inflated EnSite balloon. (c) Electroanatomical mapping with EnSite Velocity System (Images from KCL, Lon-don)
4. Modelling Cardiac Electrophysiology 17
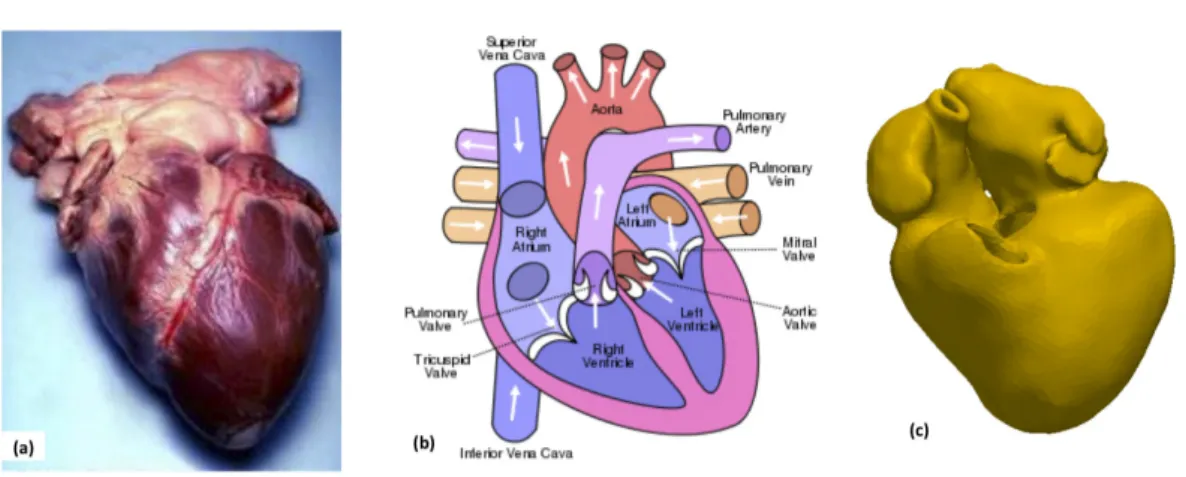
Figure 2.8: ECGI methodolgogy to have epicardial potential and activation maps from BSPM. Figure taken from [WCZ+11].
activity on the heart surface (rather than on the body surface). This could con-tribute greatly to the understanding of the mechanisms of ventricular arrhythmias and to the diagnosis and treatment of cardiac rhythm disorders in patients. It could also help to identify patients at risk of sudden cardiac death and to de-velop mechanism-based therapy and guide patient-specific treatments. The tech-nique used in [Rud10], is a non-invasive imaging method electrocardiographic imag-ing (ECGI) for electroanatomic mappimag-ing of cardiac electrical activation. It is ob-tained by solving the inverse problem of the reflected body surface potential towards the underlying cardiac electrical activity. Such studies have also been performed
in [Dös00,FD09,MGBD10, WWZ+11]. ECGI holds a promise to a better future
with non-invasive diagnosis and early detection of CVDs, thus prevention of cardiac related deaths [RPP+12].
In this thesis, we work with personalising 3D biophysical ventricular models de-rived from imaging data to ex vivo optical mapping and in vivo electroanatomic mapping (contact & non-contact). Although as a part of this thesis, we have col-laborated with IBT Germany to start personalising models with ECGI mapping derived from non-invasive BSPM mapping (AppendixD Table D.7 &D.8).
4 Modelling Cardiac Electrophysiology
Cardiac tissue contains excitable myocytes. Local depolarisation of the cardiac myocyte membrane above a threshold voltage, for example in response to current injection from a stimulating current provided by neighbouring myocytes, triggers the opening of voltage-gated Na+ channels and a rapid membrane depolarisation, which
generates an action potential. The action potential upstroke produces local gradients in membrane voltage that cause current flow within the tissue. This current flow acts in turn to open voltage-gated Na+ channels in neighbouring electrically connected cells, resulting in propagation of the action potential through the tissue. The speed and pattern of propagation depends on local tissue micro-structure, although at macroscopic spatial scales cardiac tissue behaves as a functional syncytium.
Hence, most models of cardiac electrophysiology assume that cardiac tissue can be treated as a continuum with diffused wave propagation in the tissue. Thus heart electrical behaviour can be governed by reaction diffusion equations. The biophysics of this process has been reviewed extensively elsewhere [KR04, PB00,
CBC+11,FNC+11]. In this thesis, we simulate this action potential propagation in
3D on a ventricular model derived from patient’s imaging data.
At the tissue scale cardiac tissue behaves as a functional syncytium of electrically coupled cells. A homogenisation of the discrete representation of cardiac tissue as a resistor network can be applied to derive a continuous description [NK+93], and
its idealised electrical behaviour may be considered as an excitable medium in 3D, where excitable cells are coupled diffusively via the transmembrane voltage [KKS09]. Bi-domain & Mono-domain models Bi-domain models represent cardiac tis-sue as a syncytium composed of intracellular and extracellular domains. It is as-sumed that both domains are overlapping and continuous, but separated by the cell membrane. The bi-domain model of cardiac tissue is based on current flow, distri-bution of electrical potential and the conservation of charge and current [H+93]. It
treats the intracellular and extracellular spaces separately, leading to the following coupled partial differential equations:
∇ · (Di+ De)φe =−∇ · (Di∇Vm) (2.1) ∇ · (Di∇Vm) +∇ · (De∇φe) =−β(Cm∂tVm+ Iion) (2.2) where ∇· is the divergence operator, ∇ the gradient operator, φe is the extracel-lular potential, Di and De are the intracellular and extracellular conductivity ten-sors [Rot92], β is the surface-to-volume ratio, and the membrane voltage is given by Vm= φi− φe, with φi as the intracellular potential.
The bi-domain model has the strong advantage to be based on a clear and physi-ologically relevant modelling process including an homogenisation step from a micro-scopic tissue scale to a macromicro-scopic organ one. This underlying interpretation at a microscopic tissue scale makes possible the embedding of the bi-domain model with a full torso model via physiologically relevant coupling conditions at the heart/torso interface [NK+93], allowing the simulation of the extra-cardiac potential field and of
the ECG. For these reasons the bi-domain model is very popular for the simulation of the heart and torso coupled electrical activity [LGT03]. Meanwhile, the bi-domain model is numerically highly demanding and various simplifications of this model have been widely used. For example, the eikonal model variant [CFGR90] allows
4. Modelling Cardiac Electrophysiology 19
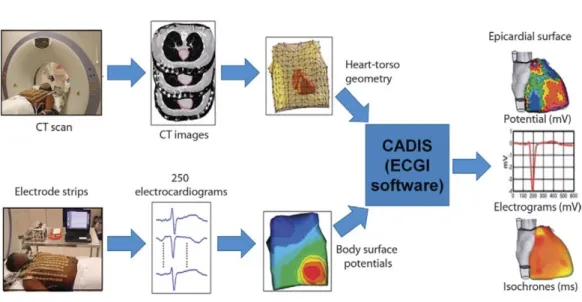
Figure 2.9: Simulated Action Potential Waveforms from a broad range of simple and complex mathematical models of cardiac cells [FC08].
to model the spread of transmembrane potential wavefront during depolarisation, and extra-cardiac potential fields can also be recovered during the depolarisation sequence using the oblique dipole layer representation [CFGV+82]. All these
sim-plified version of the bi-domain model have their own limitations and this strategy does not properly capture the feedback between the extra-cellular and extra-cardiac potential fields.
In 1D, or when the intracellular and extracellular anisotropy ratios are equal in 2D or 3D, the bi-domain representation reduces to the mono-domain. In the mono-domain formulation, the governing differential equation is
∂tV =∇ · (D∇V ) − Iion/Cm (2.3)
where D is the conductivity tensor, Cm is the membrane capacitance, and Iion is the ionic current specified by the model formulation used in each case. If there is no injection of current into the extracellular space, descriptions of physiological action potential propagation provided by mono-domain and bi-domain models are close to each other even under the condition of unequal anisotropy ratio in the extracellular
and intracellular spaces [CFPT05]. Complex patterns of action potential dynamics in a realistic framework have been successfully simulated using the mono-domain models [CGH03].
More recently [CNLH04,PDR+06], a new model referred to as the adapted
mono-domain model was proposed both to address the bi-mono-domain model high computa-tional cost problem and the coupling difficulty between the cardiac and extra-cardiac space for the mono-domain model. In this framework, the transmembrane poten-tial field is governed by a single reaction diffusion equation as for the mono-domain model, the computation of which remains decoupled from the extra-cellular/-cardiac potential fields. A complete extra-cardiac/-cellular potential field is then recon-structed from the transmembrane potential which construction naturally includes the physiological coupling between extra-cardiac and extra-cellular potentials on the heart surface. The adapted mono-domain model is considered as an approximation of the bi-domain model, providing both a much lower computational cost (since the extra-cardiac/-cellular potential field can be computed when desired only) and a cor-rect coupling on the heart surface between the extra-cardiac and extra-cellular po-tential fields. The bi-domain and adapted monodomain models have been compared extensively in [PRB+09], and the two models provided results in good agreement.
Myocardial model simulation in 3D As described earlier, models of cardiac tissue electrophysiology are based on reaction-diffusion systems where the reaction process is attributed to the cellular action potential, and the diffusion process repre-sents current flow between cells. Most modelling approaches including mono-, bi-, or multidomain models assume that cardiac tissue behaves as a functional syncytium. Whole heart models are commonly composed of discrete volume elements, for example tetrahedra [BEL03,VAT02] and hexahedra [FP04,SSK+10]. Each element
type has advantages and disadvantages. For instance, a mesh assembled from uni-form cubic voxels can be derived easily from imaging data, but does not reconstruct curved surfaces such as the epicardium effectively. In contrast, irregular tetrahedral meshes can improve the representation of surfaces, but mesh generation can be more difficult and the numerical methods associated with irregular meshes can result in higher computational costs. Recent work aims at providing adaptive meshes with high spatial accuracy that are appropriate for simulation of tissue electrophysiology in details in the regions of interest.
In our work, we generate an adaptive tetrahedral mesh from the patient’s MR images for simulations in 3D. Whole heart segmentation from 3 dimensional steady-state free precession (3D-SSFP) MRI is done using a plug-in developed by Philips Technologies GmbH, Aachen, Germany, in the framework of euHeart project. For cases without 3D-SSFP MRI, ventricular segmentation is done from cine-MRI using CardioViz3D1. The scar and peri-infarct zones (PIZ) segmentation is done using
widely accepted full width at half maximum (FWHM) method [KFFK09], more 1http://www-sop.inria.fr/asclepios/software/CardioViz3D
4. Modelling Cardiac Electrophysiology 21 details are listed in Section.2.2.1. This segmentation is done in OsiriX1. The
tetra-hedral mesh generation is done by VTK2 & CGAL3. Simulations are done in MIPS4.
And visualisations are done in ParaView5). Adaptive meshes, with uniform large
elements used to represent less important regions and grid refinement at critical points (e.g. border zones (PIZ)) are used for the simulations.
A Reaction-Diffusion system is a set of partial differential equations (PDEs). To solve these PDEs, numerical techniques implemented on computers approximate the PDEs and transform them into linear systems of equations (LSE) using discretisation techniques. In cardiac electrophysiology, the Finite Difference Method (FDM), the Finite Volume Method (FVM) and the Finite Element Method (FEM) are commonly used. In our work, we use FEM implementation of reaction-diffusion systems on the tetrahedral elements, based on the work of [Ser03],
Explicit, implicit, and semi-implicit methods can be used to solve the equations describing the time dependence of action potential propagation. The choice of nu-merical method influences the stability, computational cost and the accuracy of the implemented model. Explicit methods have been used extensively [BP84, HP90]. They have low computational cost for each time step, but require the time step to be small to guarantee stability for the diffusion operator. Implicit schemes can be stable with longer time steps, but require solution of a non-linear system of equations at each time step, and so are more computationally expensive. A good compromise between these two methods are the semi-implicit methods, they are studied extensively for bi-domain models in [EB08]. In this thesis, we implemented and studied those schemes extensively for mono-domain models, in order to choose the scheme which produced stable and accurate solutions. This study is described in Appendix B.
Choosing an appropriate spatial and temporal resolution for a tissue model is important and depends on the numerical method, cell electrophysiology model, diffu-sion coefficients and their anisotropy ratio, and geometrical properties of the tissue anatomy. Their choice affects the accuracy of the solution and results in errors w.r.t conduction velocity and action potential duration [CGH03, Cou96]. For the mono-domain models used in this work, we studied the effects of spatial and tem-poral resolutions on the solution, with respect to CV (as it had negligible effects on APD). The study led us to the selection of an optimum temporal and spatial resolutions with low errors on the accuracy. This study is detailed in Appendix B.
Propagation in 3D is influenced by tissue anisotropy and curvature. There is emerging evidence that 3D propagation is modulated by the fibre-sheet structure of the cardiac tissue [GSG+07, LSC+95, PSSL08, SGH+05]. The fibre anisotropy is
modelled by the diffusion term in the model. The anisotropic 3 × 3 Diffusion tensor D used in the model is given by,D = diag(1, r, r) in an orthonormal basis whose
1http://www.osirix-viewer.com 2http://www.vtk.org
3http://www.cgal.org
4http://www-sop.inria.fr/asclepios/software/MIPS/ 5http://www.paraview.org
first vector is along the local fibre orientation, and r as the conductivity anisotropy ratio in the transverse plane [Ser03].
Figure 2.10: (a) Confocal microscopy of isolated living ventricular myocyte from rabbit [SGFI+08]. (b) 3D model of ventricular tissue with 11 complete myocytes
and 11 partial myocytes [LHS09]. (c) A 3D tetrahedral ventricular model, with fine discretisation in regions around scars (black in colour) for fine modelling in PIZ. (d) fibre orientations per tetrahedra following the myocyte direction.(e) Epicardial (green), Endocardial(yellow & orange) and Myocardial (red) simulation domains on MR derived meshes. (f) 3D MS model simulation snapshot at a point in time, with action potential shown. (g) Depolarisation (Activation) isochrones from model simulation. Arrows show the tissue anisotropy in model simulation, based on fibre directions (h) APD maps from model simulation.
Classification of mono-domain cell models At the organ scale, mono-domain cell membrane models are embedded into a set of partial differential equations (PDEs) representing a continuum. Thus, we can divide the macroscopic approaches into three categories, in decreasing order of computational complexity:
• Biophysical: semi-linear Reaction-Diffusion dynamic PDEs with ionic models (over 50 variables for ions and channels) [Nob62]
• Phenomenological: semi-linear Reaction-Diffusion dynamic PDEs with math-ematical simplifications of the biophysical models (2-3 variables) [Fit61] • Eikonal: one static non-linear PDE for the depolarisation time derived from
![Figure 2.9: Simulated Action Potential Waveforms from a broad range of simple and complex mathematical models of cardiac cells [ FC08 ].](https://thumb-eu.123doks.com/thumbv2/123doknet/2973504.82824/38.892.170.747.140.626/figure-simulated-action-potential-waveforms-complex-mathematical-cardiac.webp)