OATAO is an open access repository that collects the work of Toulouse
researchers and makes it freely available over the web where possible
Any correspondence concerning this service should be sent
to the repository administrator:
[email protected]
This is a Publisher’s version published in:
http://oatao.univ-toulouse.fr/25378
To cite this version:
Sauvage, Jean-Baptiste
and Chalandon, Pierre and Poquillon, Dominique
and Nardin, Michel and Aufray, Maëlenn
Using the Finite Element Analysis
Method to Study the 3-point Bending Test for the Characterization of the
Adherence. (2019) Journal of Applied and Computational Mechanics, 6 (3).
505-516. ISSN 2383-4536
Using the Finite Element Analysis Method to Study the 3-point
Bending Test for the Characterization of the Adherence
Jean-Baptiste Sauvage
1,2,
Pierre Chalandon
3,
Dominique Poquillon
1,
Michel Nardin
2Maëlenn Aufray
11 CIRIMAT, Université de Toulouse, CNRS, INP-ENSIACET, 4 allée Émile Monso 31 030, Toulouse, France
Email(s): [email protected], [email protected], [email protected] 2
IS2M, Université de Haute Alsace, 15 rue Jean Starcky 68 057, Mulhouse, France, Email: [email protected]
3 CETIM, 7 rue de la Presse, 42 952 Saint-Étienne, France, Email: [email protected]
Received July 15 2019; Revised September 16 2019; Accepted for publication September 16 2019. Corresponding author: Maëlenn Aufray ([email protected])
© 2020 Published by Shahid Chamran University of Ahvaz
& International Research Center for Mathematics & Mechanics of Complex Systems (M&MoCS)
Abstract. An elastic finite element analysis was conducted to evaluate the stress distribution in the initiation
zone of the adhesive rupture during the 3-point bending test. This test is used to measure the adherence
between a polyepoxy adhesive and aluminum alloy with different surface treatments. The purpose is to
compare, in the high stress concentration areas, the stress fields calculated using finite element method with
the experimental data obtained in different configurations. Focusing on the load level at crack initiation, on
the localization and the size of adhesive failure initiation, a local criterion for adhesive fracture is proposed
based on the value of the stress normal to the interface.
Keywords: 3-point bending, Adhesive failure, Initiation test, FEM, Stress and strain distribution.
1. Introduction
The prediction of the behavior of bonded assemblies is an important stake in many industrial domains (automotive, aeronautics etc). Consequently, the numerical modeling of the bonded structures makes it possible to better understand their behavior under stress. However, it is complex to characterize the adherence with the different existing adherence tests and in particular the adhesive failure. Each test has several objectives: to overcome the shortcomings of others (parasite stress, edge effects), to introduce new load types (single mode or mixed modes), to test thin films or complete bonded structures, etc. [1].
The modeling of these adherence tests makes it possible to better understand their mechanics and thus to try to determine a criterion of adherence independent of the geometry of the test specimen and the mode of failure. Although, in recent years, many finite element (FE) models for modeling bonded assemblies have been developed, none of them can simulate totally the complex behavior of bonded joints [2]. The finite element models used are very varied and range from the linear behavior of the materials with a simple mesh to the nonlinear material model with cohesive zones [3-8]. The use of the cohesive zone model (CZM) for the bonded joint improve the models for the study of the failure [9-16].
The adhesive failure is difficult to get systematically during a test. However the 3-point bending test with epoxy adhesives makes it possible to obtain it. In addition, the initiation of adhesive failure can be located on the surface of the substrate [17, 18]. The objective of the paper is to study the 3-point bending test in this configuration with the finite element modeling. The purpose is to study the stress field in the area where adhesive failure initiates, then to link this failure with values taken from these mechanical fields. The modeling of the 3-bending test is poorly developed [19, 20]. The results presented here come from a study described in a previous article [21]. The initiation of the failure has been
studied at the surface of the substrate. It has been shown that the initiation of the failure is adhesive. This study has been carried out with a substrate made of aluminum alloy 2024 and polyepoxy composed of a mixture of DGEBA prepolymer and a DETA amine. This aluminum alloy 2024 is widely used in aircraft structures requiring high strength to weight ratio, as well as good fatigue resistance. It is a heat-treatable aluminum alloy with copper as the primary alloying element. It is used in many applications. During bonding, the DETA amine reacts with aluminum to form an organometallic reproducible interphase [22, 23]. The results of the 3-point bending test depends, on the one hand, on the characteristics of the materials (characteristics of the substrate surface, chemical composition, tempering, adhesive chemical and physical properties) and, on the other hand, on dimensions of the specimen. However, an analytical modeling based on energy partitioning leads to the evaluation of each contribution. Then a value of energy for the adhesive failure initiation can be obtained for a given couple of material and surface preparation [21]. In this paper, the purpose is not to focus on an approach made at a macroscopic level giving for example a value of force or energy at the time of crack initiation but to focus on the local stress field in the vicinity of crack initiation area. The failure initiation was observed as a penny shape area well defined in the area where crack initiate. The size and the localization of this zone are quite reproducible [21]. The purpose of the FEM was to make the link, in different configuration (different substrate thicknesses) with the profiles of the different components of the stress tensor, for a load level corresponding to crack initiation. Focusing on the load level at crack initiation, on the localization and the size of adhesive failure initiation, the objective is to study the different components of the stress tensor (normal stress etc.), but also the von Mises stress and the maximum principal stress in order to compare the localization of their concentration. The purpose is to determine if, for one of them, an iso-stress line corresponds to the area identified as crack initiation zone.
2. Materials and Methods
2.1 Materials
The metallic substrate used is laminated aluminum 2024 T3 (bulk composition: Al: 93.5 wt.% Cu: 4.55 wt.% Mg:
1.55 wt.% Mn: 0.5 wt.%), 1.6 mm thick, supplied by GOODFELLOW, and 1 mm thick, supplied by KAISER Aluminum.
The polyepoxide adhesive used in the study is a bisphenol diglycidyether pre-polymer (DGEBA) referred to as DER332, supplied by DOW chemical, used with diethylenetriamine (DETA) as a hardener, supplied by SIGMA-ALDRICH. The mix of epoxy monomer and amine is made in stoichiometric proportions, calculated from the functionalities of DETA amine (f=5) and DGEBA epoxy (f=2). The surface treatment used was the 3-aminopropyltriethoxysilane (> 99 % pure), supplied by SIGMA-ALDRICH.
2.2 Samples preparation and 3-point bending tests
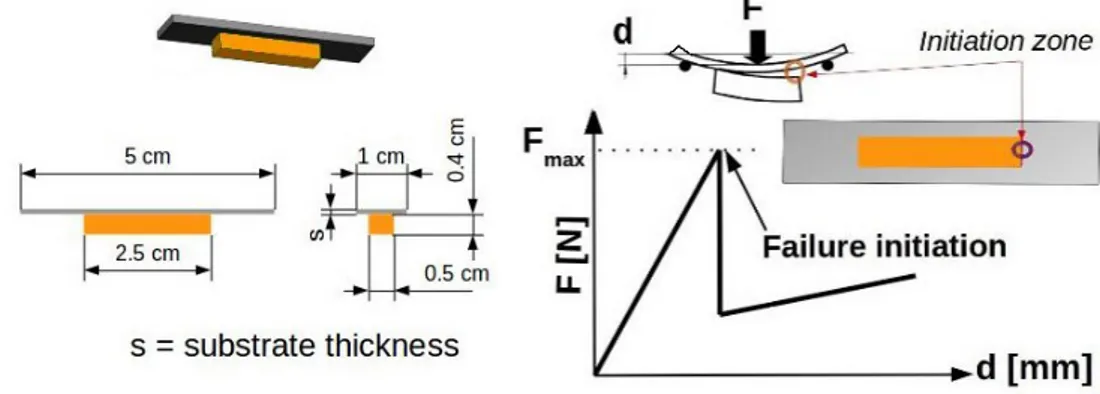
The samples used are dimensioned and manufactured in accordance with ISO 14 679- 1997 [24]. They consist of an aluminum plate, with a block of adhesive glued on it. Aluminum plates are cut using a punch, ensuring that the produced cuttings are of equal dimensions, 50 × 10 mm2 ± 0.10 mm, as mentioned in the standard (see figure 1).
Fig. 1. Dimensions of the sample, in accordance with ISO Standard 14679 (left part) and characteristic curve of the test (right part).
Application of the DGEBA-DETA was previously described [21], forming epoxy blocks of equal dimensions, 25 × 5 x 4 mm3, as mentioned in the standard. The formed thermosets have onset glass transition temperature of 136 °C.
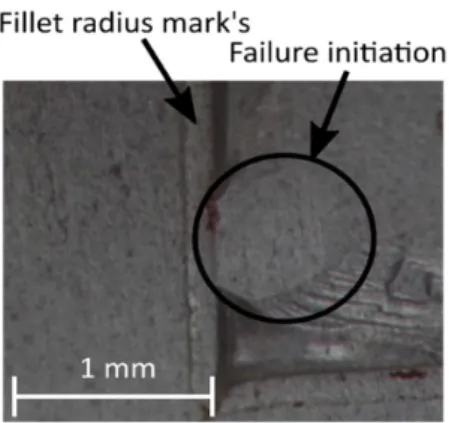
Series of 12 samples were realized for each. Let us note that a fillet radius of the adhesive block on the substrate takes place on each sample and modify the “perfect expected geometry”, as seen on the Figure 2.
Mechanical testing was conducted using an INSTRON tensile machine (model 3367, INSTRON SA, Buc, France) equipped with a 3-point bending system and a 500 N load sensor, with an error margin of ± 0.1 N. The distance between supporting pins is 35 mm and the speed of test is 0.5 mm/min. The actual displacement was measured using an optical monitoring system previously described [21]. The error margin for displacement measurement using the optical system was estimated to be ± 3 μm. Let us note that all the failures were brittle, as seen on the characteristic curve of the test (Figure 1).
Fig. 2. Presence of fillet radius.
Fig. 3. Modeling of a quarter of the specimen. The adhesive is bounded on the top of the 2024
plate.
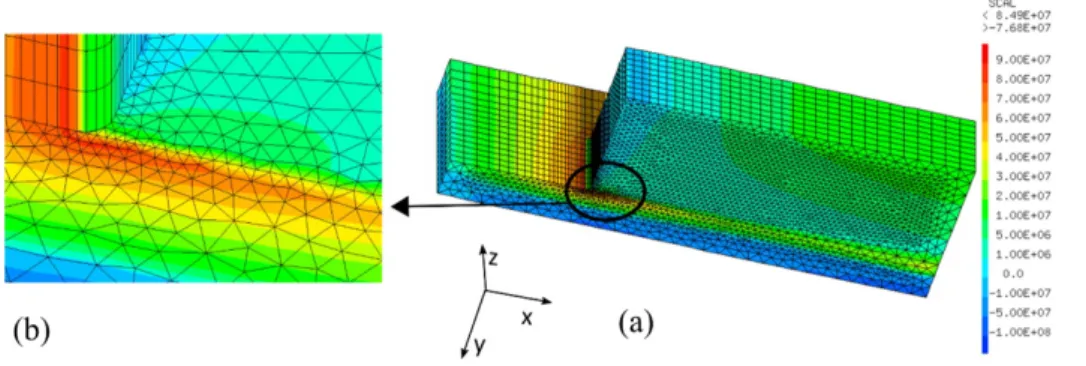
Fig. 4. 3D mesh of the quarter of a specimen, with a zoom on the fillet radius. The substrate is meshed in blue (lower part) and the adhesive in red (upper part).
2.3 Finite element analysis
Finite element calculations were performed with Cast3m finite element code [25]. Because of the geometry with two planes of symmetry, the simulation was carried out only on a quarter of the sample meshed with 8 node cubic isoparametric elements (Figures 3 and 4).
Both materials were described by an isotropic elastic mechanical behavior with the following data for aluminum substrate: Young's modulus 68 GPa, Poisson's ratio 0.33; for DGEBA/DETA: Young's modulus 3 GPa, Poisson's ratio 0.35. Both materials were tested in order to verify that they had an elastic mechanical behavior in the presented deformation domain.
Since the Euler–Bernoulli beam theory has been developed only for homogeneous beam, and since we used it in the proposed analytical energy approach for heterogeneous beams, we depart from its classical use. So, we have compared the values obtained, i.e. the elastic energy values stored in each beam (aluminum and adhesive) with the values calculated using FEM (see Table 1). This comparison is achieved for a load corresponding to the average failure load of a given system. The purpose of the finite element calculations is to understand and quantify the effects of the fillet geometry of the adhesive block on the substrate on the mechanical fields, to study the stresses at the interface: the principal stress, the normal stress and the shear stress.
Table 1. Elastic energy stored in the components. Comparison for the two configurations, at the loading corresponding to crack initiation. Adherence energy and load failure for various thicknesses.
Substrate thickness 1.6 mm, F = 123 N Substrate thickness 1 mm, F = 70 N Elastic deformation energy stored (mJ) Analytical approach [21] (Present study) Analytical approach [21] FEM (Present study) FEM
In the aluminum substrate 8.8 9.2 ١٫٦ ١٫٨
In the adhesive block 3.2 3.7 ٢٫٢ ٢٫٦
However, the first analysis was macroscopic to study, on the one hand, the curve force versus displacement and, on the other hand, the different energy contributions. We wanted to compare the analytical results with those from the FEM calculations for the elastic energy stored in the bended substrate and that stored in the bended adhesive block. 3D and 2D calculations were carried out and their results compared. The 2D modeling allows a more refined mesh and allows parametric studies, but it does not allow access to the quantitative quantities given the underlying approximations. We used the ENER operator of the FE Code that calculates the tensorial product of a stress field and a strain field. The result is a scalar field standing for energy density. Then, using the operator INTG, we performed the integration of this energy density in the aluminum substrate and in the adhesive block. Different 3D calculations have been performed. The first parameter of the study is the thickness of the substrate and two values were modeled: 1 and 1.6 mm. In both cases, the connection between the block of adhesive and the aluminum plate is made with a fillet radius of 150 μm which corresponds to the mean experimental value. The mesh is finer in the critical zone in which the rupture of the specimen
is initiated as illustrated in Figure 4. It has 30034 nodes for the 1.6 mm thick substrate. A preliminary study has been carried out in the most severe configuration (with the smallest fillet radius) to determine the mesh size 5 leading to stabilized stress values at 50 μm of the singularity. This mesh size has been used for all the calculations. In the vicinity of the fillet radius, the mesh size is about 20 μm.
The displacements perpendicular to each of the planes of symmetry are imposed null, i.e., as indicated in Figure 5, Ux = 0 in the plane yz located at x = 0 and Uz = 0 in the xy plane located at z = 0. The interface is perfect, i.e. continuity of the displacement and the traction vectors across it are assumed.
The test piece is in simple support, which corresponds to a blocking of the vertical displacement Uy = 0 on the supporting line. The force in the y-direction is imposed on the center line. The displacement of this line allows us to compare the computation to the load versus deflection experimental data. The mechanical fields are first studied at the interface, on the center line, drawn in green in Figure 5. Let us remind that previous work show that the failure initiation always takes place at one end of the block of adhesive, as shown in Figure 1.
In parallel with the 3D FEM calculations, a 2D modeling is also performed. Figures 6 and 7 illustrate the corresponding mesh which can be more refined than the 3D mesh, both at the interface and at the fillet. The calculations are carried out using the plane strain option to take into account the width of the sample and the fact that we study the stresses on the median axis. However, since the adhesive block does not have the width of the substrate, this modeling induces an over-rigidity. However, this 2D analysis makes it possible, with these limitations, to study the effect of the radius of the fillet but also the effect of a non-symmetrical positioning of the bending specimen.
Fig. 5. 3D Mesh with the axes, the boundary conditions and the line where stresses are plotted. The median axis is the green line in the x direction (for interpretation of the references to color in this figure legend, the reader is referred to the web version of this
article).
Fig. 6. 2D Mesh with the axes, the boundary conditions and the line where stresses are plotted (in green - For interpretation of the references to color in this figure legend, the reader is referred to the web version of this article).
3
. Results and Discussion
3.1 Approach based on load failure, from experimental results
The previous study [21] was analytical and based on bending beam equations to evaluate the deflection and the energy of the system. At failure initiation, the energy of the system is the sum of three contributions: the elastic energy stored in the aluminum substrate due to bending, elastic energy stored in the adhesive block due to bending and the adhesion energy. This latter contribution is deduced by subtracting the first two contributions from the total system energy coming from the test (force and displacement are known). Samples with various thicknesses were chosen having nearly the same adherence energy (Table 2), i.e. 3.7 mJ and 2.3 mJ for 1 mm and 1.6 mm thick samples respectively. Calculations are then carried out with these representative values. The yield stress of the aluminum substrate is not reached in the zone of interest. This point legitimates the elastic modeling chosen. It can be reached, however, very locally (on an element) at the points of support, which is without consequence of the value of the mechanical fields at the interface. A satisfactory agreement is obtained on the deflection versus load curves between the 3D modeling and the experimental data.
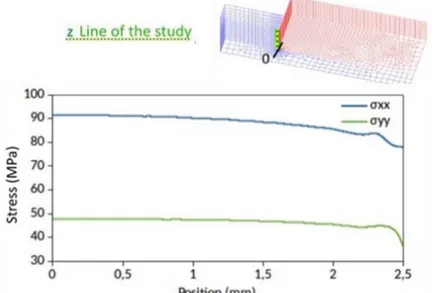
Figure 8 illustrates the xx and yy stresses obtained for the 1.6 mm thick substrate submitted to a 125 N load at the end of the block: the stresses at the interface are maximum in the expected zone, i.e. at the end of the block, in the vicinity of the fillet. This conclusion was verified too in the Figures 9 to 11. Moreover, for each component of the tensor, its value is the greatest on the median plane (see the Figure 8). That is why we will study these values on the line indicated previously in Figure 5.
Fig. 8. 3D modeling, comparison of the stress profile, components σxx and σyy for a 1.6 mm substrate (125 N). Stress at substrate/adhesive interface, on the z-line of the study.
Fig. 9. 3D modeling, 1.6 mm substrate, load value is 125 N, mapping of the stress component σxy. Table 2. Adherence energy and load failure for various thicknesses.
Thickness (mm) 1 1.6
Adherence energy (mJ) 3.7 2.3
Fig. 10. 3D modeling, 1.6 mm substrate, load value is 125 N, mapping of the stress component σxx.
Fig. 11. 3D modeling, 1.6 mm substrate, load value is 125 N, mapping of the stress component σyy.
Fig. 12. 3D modeling, 1.6 mm substrate, load value is 125 N. Stress at substrate/adhesive interface. The 0 position corresponds to the end of the fillet radius. The y direction is perpendicular to the interface.
Fig. 13. 3D modeling, comparison of the stress profile, component σxx for a 1.6 mm substrate (125 N) and a 1 mm substrate (57 N). Stress at substrate/adhesive interface, on the central line of the specimen. The 0 position corresponds to the end of the fillet radius.
Fig. 14. 3D modeling, comparison of the stress profile, component σyy for a 1.6 mm substrate (125 N) and a 1 mm substrate 57 N). Stress at substrate/adhesive interface, on the central line of the specimen. The 0 position corresponds to the end of the fillet radius.
The y direction is perpendicular to the interface.
Figure 12 illustrates the values obtained for the 1.6 mm thick substrate submitted to a 125 N load (coming from Figure 9 to 11). All components of the stress tensor have an extremum at the end of the adhesive. Let us note that the presence of the fillet radius cut the top of the stress curves at the zero position of the curves, i.e. in the fillet radius zone.
Figures 13 and 14 allow us to compare, for the two different substrate thicknesses, the localization of this extremum for the component σxx and σyy respectively. For the value of the force corresponding to the initiation of the adhesive fracture, the profiles of the 1 mm and the 1.6 mm thick samples are very close to the components σyy and much less for σxx [21]. Moreover, if we zoom into this zone (Figure 14), it is important to note that the zone in which the normal stress is maximum has an extension comparable to that observed experimentally. Indeed, it was found that the initiation zone of the adhesive rupture was located systematically rather in the central part of the test piece and is a disc shape area with a diameter ranging from 0.55 to 1 mm (see Figure 15). If we consider the components xx, yy and xy of the stress tensor, using the numerical simulations, it appears that the component yy, smaller than the component xx, locates exactly in the crack initiation zone.
Fig. 15. Correlation with the area of the opening stress.
Fig. 17. 2D model for the 125 N / 1.6 mm thickness simulations. Stress component σxx.
Fig. 18. 2D model for the 125 N / 1.6 mm thickness simulations. Stress component σyy.
Fig. 19. Stresses at the interface, 2D modeling Wadh = 4 mJ (corresponding to 125 N for 1.6 thickness substrate), for 3 dimensions of the fillet.
A comparison was made, on the median line of the interface, of the 2D and 3D results. Stresses profiles are illustrated on the Figure 16. As in the 2D calculation everything happens as if the block of adhesive had the width of the plate of the substrate, the calculation underestimates the value of the constraints with respect to the 3D simulation by overestimating the proportion of adhesive material. However, the profiles obtained have the same quantitative evolution. Furthermore,
the marked localization of larger values of σyy is evidenced. The evolution of the σxx component is much smoother.
The 2D results illustrated on the maps of Figures 17 and 18 confirm this specificity of the 3-point bending test. Von Mises stress is not much localized either. All these elements (stress profile at the interface, concentration zone and position of the maxima compared to the initiation zone of the adhesive rupture) tend to show that the stress σyy seems to be the one to be used to define a normal stress criterion for adhesive failure. As explained in the introduction, the main advantage of this 3-point bending test is that it ensures initiation of adhesive failure at the adhesive/substrate interface [21, 24]. However, the load at the initiation of the adhesive failure is not only dependent on surface treatments, as
expected, but also on the geometry of the test. The substrate must not be too thin in order to remain in the elastic domain (no remaining bending after the test) and not too thick. In that last case the elastic deformation energy stored in the aluminum substrate will be far over elastic deformation energy stored in the adhesive block due to bending and the initiation failure energy of the interface.
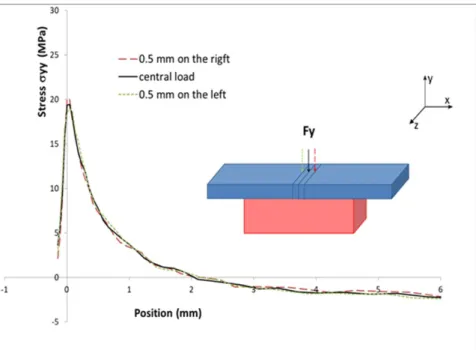
Fig. 20. Effect of a non-symmetrical positioning of the bending specimen. 2D modeling, stress profiles (component σyy) on the central line of the specimen (green line on the Figure 6) for a 1.6 mm substrate (Fy = 125 N). The 0 position corresponds to the end of
the fillet radius. The reference calculation is carried out with the load in the middle of the sample (black curve) and compared with results when the load is applied 0.5 mm on the right or on the left.
Knowing the load and the deflection, an estimation of the elastic energy stored in each bended beam can be achieved using the Euler-Bernouilli beam theory. These values can be compared to the values obtained with the 3D FE simulations. For the different cases tested, the analytical approach underestimates by 10 to 20 % the elastic energy calculated for the load corresponding to adhesive failure. As the Euler-Bernouilli beam theory neglects shear stress and is valid only for the infinitesimal strains and small rotations, it was interesting to focus on these points. First of all, even for the thinnest thickness (1 mm) and the best adherence (silane treatment), the deflection remains small, below 500 μm: the difference is due to shear stress (as illustrated in Figure 12). Due to rigidity gap between substrate and adhesive, shear stress level is not negligible at the interface and contributes to the elastic stored energy.
Due to the operating conditions, the geometry of the adhesive block is less controlled than the one of the substrate, inducing some discrepancy. Calculations need to be carried out with the real height of the adhesive block. Another point was the dimension of the fillet, measured on the specimens. It varies around the mean value of 150 μm, but can range from 100 to 200 μm. 2D simulations were focused on the influence of the fillet radius varying from the smallest to the largest value to determine the influence of the normal stress level in the vicinity of the crack initiation area (see Figure 19).
The results show a variation of 10 %. A smaller radius (100 μm) induces a slightly more pronounced maximum for σyy (+ 10 %), but the effect is very limited both in magnitude and localization, and the stress profile is modified only very locally. Since this parameter is difficult to control experimentally, the FEM makes it possible to see that it is rather a second order parameter.
There is a maximum clearance of 1 mm between the supports and the adhesive block of the test piece, i.e. a maximum displacement of 0.5 mm from the central position. 2D simulations were used but this time on the whole specimen (and not on one half of the test piece) to check the influence of the point of application of the force with respect to the points of support (see Figure 20). Their results show that the impact of the position of the force (in the test range) is minimal on the various constraints at the interface and smaller than the effect of the fillet radius, as illustrated by Figure 20. This result therefore makes it possible to assert that a positioning error of 0.5 mm with respect to the central position has little or no influence on both the profile of the stresses and the calculated values. This also confirms the robustness of this test on samples not perfectly sized or even slightly misaligned.
Table 3. Adherence energy and load failure for various thicknesses (grey backdrop: results from the table 2 and white backdrop: load failure calculated with the same adherence energy -4mJ-).
Thickness (mm) 1.6 1
Adherence energy (mJ) 3.7 4 2.3 4 Load failure (F) 125 123 57 70
3.2 Approach based on the models of analytical energy variation
In this part, the adherence energy is considered as independent of the thickness of the substrates, since this energy should depend only on the quality of the substrate-adhesive interface. Then, it is chosen as an average: here 4 mJ, whatever the thickness of the samples is. The choice of 4 mJ is the round number of the calculated initiation failure energy (from Table 2). At this value, a critical force (load failure) and displacement are calculated analytically for each substrate thickness, i.e. 70 N for 1 mm, 123 N for 1.6 mm (See Table 3).
Fig. 21. Stress XX at the interface, 3D modeling Wadh = 4 mJ (corresponding to 123 N for 1.6 thickness substrate and 70 N for 1 mm thickness substrate).
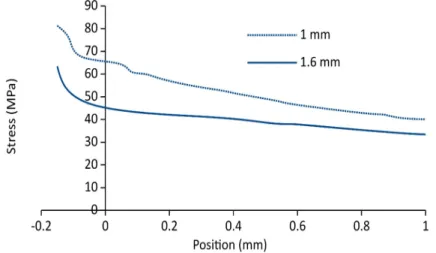
Fig. 22. Stress YY at the interface, 3D modeling Wadh = 4 mJ (corresponding to 123 N for 1.6 thickness substrate and 70 N for 1 mm thickness substrate).
Fig. 23. Stress XY at the interface, 3D modeling Wadh = 4 mJ (corresponding to 123 N for 1.6 thickness substrate and 70 N for 1 mm thickness substrate).
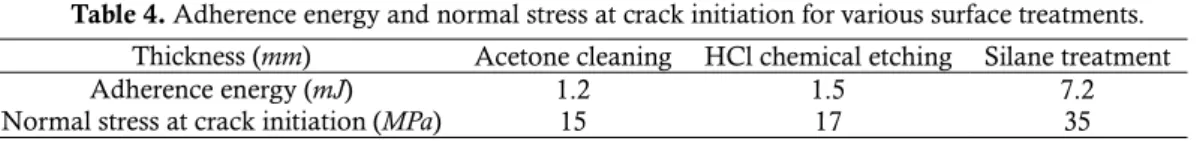
Table 4. Adherence energy and normal stress at crack initiation for various surface treatments. Thickness (mm) Acetone cleaning HCl chemical etching Silane treatment
Adherence energy (mJ) 1.2 1.5 7.2
Normal stress at crack initiation (MPa) 15 17 35
For the two geometries studied (1 and 1.6 mm for the 2024 thickness), the stresses at the interface are studied in 3D and presented in Figures 21 to 23. These figures are very comparable with previous Figures 12 to 14. However, the imposed force no longer corresponds to the experimental average of the forces at the initiation of the rupture but to that for the same adherence energy.
The results exposed here confirm the previous ones when analyzing the stress profiles at the interface. The stress concentration zone and position of the maxima compared to the initiation zone of the adhesive rupture tend to show that the normal stress σyy seems to be the one to be used to define a stress criterion for adhesive failure: this approach, using models of analytical energy variation strengthens the FE results, coming directly from experimental load failure. It is now possible to propose a failure criterion, based on normal stress. More detailed simulations are then carried out for the load corresponding to different surface treatments and the different adherence energies. If we take the experimental data obtained after three different treatment (Acetone cleaning, HCl chemical etching, silane treatment), a previous study has allowed us to obtain respectively 1.2, 1.5 and 7.2 mJ as adherence energies, whatever the thickness of the substrate is (1 or 1.6 mm). Each of the configurations corresponds to a couple sample geometry / load for crack initiation at the interface. FEM is then used to determine the corresponding value for the normal stress and the results are presented in Table 4.
These results are in good accordance with Bresson et al. [26] who found values with the same order of magnitude for similar systems (Arcan adherence test, aluminum alloy 7075 as substrate, polyepoxy network 9 Hysol EA9394 and two surface treatments: sandblasting and silane chemical treatment), i.e. from 30 to 40 MPa.
4. Conclusion
FEM calculations were carried out both in 2D and 3D to analyze the 3-point bending test used for adhesive failure. The sensitivity to the various factors such as substrate thickness, centering of the test specimen and the radius of the fillet was studied. The results of different simulations were compared to the experimental results and to a previously published analytical approach. It was concluded that:
- For rigid adhesives, with a high Young's modulus like that used in this study, adhesive fracture can be characterized using a 3-point bending test. The crack initiation corresponds at the interface to the location of the normal stress and a critical normal stress can be used to dimension the initiation of adhesive failure.
- This critical stress strongly depends on the substrate surface treatment, as expected.
The precision of the test was all better when the substrate is thin but remaining in its elastic domain. Then, the FE modeling strengthens the analytical results presented previously [21], showing that it exists a failure criterion, based on the normal stress and independent of the substrate thickness. The presented results cannot be directly generalized: this approach is able to model the adhesive failure in the specific case of the three-point bending test.
Acknowledgements
The authors mentioned that this article comes from the following thesis, with the permission of its author (Jean-Baptiste Sauvage) and the industrial partner (CETIM): Jean-(Jean-Baptiste Sauvage (2016): Characterization and modeling of adhesion in bonded assemblies (Doctoral Thesis). University of Haute Alsace – Mulhouse, France.
Link: https://tel.archives-ouvertes.fr/tel-01509896/file/2016MULH9553_these_SAUVAGE.pdf
Conflict of Interest
The authors declared no potential conflicts of interest with respect to the research, authorship and publication of this article.
Funding
The authors received no financial support for the research, authorship and publication of this article.
References
[1] da Silva, L.F.M., Öchsner, A., Adams, R.D. (Eds), Handbook of Adhesion Technology, Springer Berlin Heidelberg, 2011. [2] He, X., A review of finite element analysis of adhesively bonded joints. Int. J. Adhes. Adhes. 31(4), 2011, 248-264. [3] da Silva, L.F.M., Campilho RDSG. (Eds) Advances in Numerical Modeling of Adhesive Joints, New York, Springer, 2012. [4] Cognard, J.Y., Créac’hcadec, R., Sohier, L., Davies, P., Analysis of the nonlinear behavior of adhesives in bonded assemblies-Comparison of TAST and Arcan tests. Int. J. Adhes. Adhes. 28(8), 2008, 393-404.
[5] Garcia, J.A., Chiminelli, A., Garcia, B., Lizaranzu, M., Jiminez, M.A., Characterization and material model definition of toughened adhesives for finite element analysis. Int. J. Adhes. Adhes. 31(4), 2011, 182-192.
[6] Leffle, K., Alfredsson, K.S., Stigh, U., Shear behavior of adhesive layers. Int. J. Solids Struct. 44(2), 2007, 530-545. [7] Fessel, G., Broughton, J.G., Fellows, N.A., Durodola, J.F., Hutchinson, A.R., Evaluation of different lap-shear joint geometries for automotive applications. Int. J. Adhes. Adhes. 27(7), 2007, 574-583.
[8] Mackerle, J., Finite element analysis and simulation of adhesive bonding, soldering and brazing an addendum: a bibliography (1996 2002). Model. Simul. Mater. Sci. Eng. 10(6), 2002, 637-671.
[9] Tvergaard, V., Hutchinson, J.W., The relation between crack growth resistance and fracture process parameters in elastic-plastic solids. J. Mech. Phys. Solids. 40(6), 1992, 1377-1397.
[10] Needleman, A., An analysis of tensile decohesion along an interface. J. Mech. Phys. Solids. 38(3), 1990, 289-324. [11] Mohammed, I.K., Charalambides, M.N., Kinloch AJ. Modeling the interfacial peeling of pressure-sensitive adhesives. J. Nonnewton. Fluid Mech. 222, 2014, 141-150.
[12] Jousset, P., Rachik, M., Implementation, identification and validation of an elasto-plastic-damage model for the finite element simulation of structural bonded joints. Int. J. Adhes. Adhes. 50, 2014, 107-118.
[13] Neumayer, J., Koerber, H., Hinterhölzl, R., An explicit cohesive element combining cohesive failure of the adhesive and delamination failure in composite bonded joints. Compos. Struct. 146, 2016, 75-83.
[14] Campilho, R.D.S.G., de Moura, M.F.S.F., Domingues, J.J.M.S., Using a cohesive damage model to predict the tensile behavior of CFRP single-strap repairs. Int. J. Solids Struct. 45(5), 2008, 1497-1512.
[15] de Moura MFSF. Numerical simulation of the ENF test for the mode-II fracture characterization of bonded joints. J. Adhes. Sci. Technol. 20(1), 2006, 37-52.
[16] Bedon, C., Machalická, K., Eliášová, M., Vokáč, M., Numerical Modelling of Adhesive Connections Including Cohesive Damage. Challenging Glass Conference Proceedings, 6, 2018, 309-320.
[17] Roche, A.A., Dole, P., Bouzziri, M., Measurement of the pratical adhesion of paint coatings to metallic sheets by the pull-off and three-point flexure tests. J. Adhes. Sci. Technol. 8(6), 1994, 587-609.
[18] Roche, A.A., Behme, A.K., Solomon, J.S., A three-point flexure test configuration for improved sensitivity to metal/ adhesive interfacial phenomena. Int. J. Adhes. Adhes. 2(4), 1982, 249-254.
[19] Bouchet, J., Roche, A.A., Jacquelin, E., The role of the polymer / metal interphase and its residual stresses in the critical strain energy release rate ( Gc ) determined using a three-point flexure test. J. Adhes. Sci. Technol. 15(3), 2001, 345-369.
[20] Golaz, B., Michaud, V., Lavanchy, S., Månson, J.A.E., Design and durability of titanium adhesive joints for marine applications. Int. J. Adhes. Adhes. 45, 2013, 150-157.
[21] Sauvage, J.B., Aufray, M., Jeandrau, J.P., Chalandon, P., Poquillon, D., Nardin, M., Using the 3-point bending method to study failure initiation in epoxide-aluminum joints. Int. J. Adhes. Adhes. 75, 2017, 181-189.
[22] Bentadjine, S., Petiaud, R., Roche, A.A., Massardier, V., Organo-metallic complex characterization formed when liquid epoxy-diamine mixtures are applied onto metallic substrates. Polymer. 42(14), 2001, 6271-6282.
[23] Aufray, M., Roche, A.A., Residual stresses and practical adhesion: effect of organo-metallic complex formation and crystallization. J. Adhes. Sci. Technol. 20(16), 2006, 1889-1903
[24] ISO. 14679 - Adhesives - Measurement of adhesion characteristics by a three-point bending method. 1997. [25] CEA – Saclay, Cast3m finite element code, Gif sur Yvette, France, 2003, http://wwwcast3m.cea.fr.
[26] Bresson, G., Jumel, J., Shanahan, M., Serin, P., Strength of adhesively bonded joints under mixed axial and shear loading. Int. J. Adhes. Adhes. 35, 2012, 27-35.
ORCID iD
Dominique Poquillon https://orcid.org/0000-0002-5006-1958 Maëlenn Aufray https://orcid.org/0000-0001-5921-6322
© 2020 by the authors. Licensee SCU, Ahvaz, Iran. This article is an open access article distributed under the terms and conditions of the Creative Commons Attribution-NonCommercial 4.0 International (CC BY-NC 4.0 license) (http://creativecommons.org/licenses/by-nc/4.0/).