OATAO is an open access repository that collects the work of Toulouse
researchers and makes it freely available over the web where possible
Any correspondence concerning this service should be sent
to the repository administrator:
[email protected]
This is an author’s version published in:
https://oatao.univ-toulouse.fr/cgi/users/home?screen=EPrint::View&eprintid=25100#t
To cite this version: Ponnou-Delaffon, Vivien and Probst, Anne and Payre,
Virginie and Granouillac, Franck and Ferrant, Sylvain and Perrin, Anne-Sophie
and Probst, Jean-Luc Long and short-term trends of stream hydrochemistry and
high frequency surveys as indicators of the influence of climate change,
agricultural practices and internal processes (Aurade agricultural catchment,
SW France). (2020) Ecological Indicators, 110. 105894. ISSN 1470160X
Official URL:
https://www.sciencedirect.com/science/article/pii/S1470160X19308891?via%3Dihub
Long
and short-term trends of stream hydrochemistry and high frequency
surveys
as indicators of the influence of climate change, agricultural
practices
and internal processes (Aurade agricultural catchment, SW France)
Vivien
Ponnou-Delaffon
a,
Anne Probst
a,⁎,
Virginie Payre-Suc
a,
Franck Granouillac
a,
Sylvain
Ferrant
a,b,
Anne-Sophie Perrin
a,c,
Jean-Luc Probst
aa EcoLab, Université de Toulouse, CNRS, Toulouse, France
bPresent address: Centre d’Etudes Spatiales de la BIOsphère, Université de Toulouse, CNRS, CNES, IRD, INRA, Toulouse, France cPresent address: Terres Inovia, Campus de La Gaillarde, Montpellier, France
Keywords: Nitrates
Major elements trends High frequency Nycthemeral cycle Hydrological conditions Critical Zone Hydrochemical indicators A B S T R A C T
The hydrochemical time series of stream water from a cultivated catchment were investigated at different time scales and survey frequencies. A 35-year time series of nitrate concentration and discharge, a 15-year time series of major elements and dissolved organic carbon (DOC) concentrations were analysed from a yearly to a daily/ hourly basis during discharge recession after storm event periods, to determine the origin of elements, the time trends and the main controlling factors of the trends. A significant decrease over time of nitrate, base cations and other major anions was observed. These trends were controlled by agricultural practice changes (decrease of N -fertiliser input, grass-band set up) and discharge increase, especially in the last years of the period. On the other hand, K and DOC increased over the 15-year period. This increase might result from both 1) organic matter eroded from the soil surface by runoff during flood events and 2) an increase in mineralisation with increasing temperature. Seasonal variations and nycthemeral cycles indicated either calcite precipitation and nitrification processes and/or evapotranspiration, water and/or vegetation uptake during the day with increasing tem-perature. This paper highlights that the hydrochemical parameters measured at various time scales and fre-quencies can be used as powerful indicators of catchment internal processes, and of changes in agricultural management and climate change. Particularly, the multivariate high-resolution survey has shown its ability to evidence very tenuous processes not detectable by discrete sampling. The recent observed changes in hydrology argue for the need to continue the hydrochemical survey over decades.
1. Introduction
During the twentieth century, the critical zone (CZ) (NRC, 2001; Brantley et al., 2006) has been under increasing pressure due to an-thropogenic activities. To better understand the CZ function (fluxes and processes) and to maintain its sustainability, long term hydrochemical observatories have been established in forested ecosystems of the Northern Hemisphere from the sixties to the eighties to investigate the biogeochemical cycles (Hubbard Brook catchment; Bormann et al., 1968) and the impact of acid atmospheric deposition on soil and streamwater acidification (Dambrine et al., 2000; Driscoll et al., 2001; Hruska et al., 2002; Likens et al., 1996; Meesenburg et al., 2016; Pierret et al., 2018, 2019). In the meantime, few observatories were set up in an agricultural context (Ferrant et al., 2013; Halliday et al., 2014; Fovet
et al., 2015; Abbott et al., 2018). However, the impact of agricultural practices could be evidenced by: (i) CO2 emissions/sequestration (Letcher, 2008; Powlson et al., 2014); (ii) modification of the carbon cycle by inputs of N-fertilisers (Perrin et al., 2008) and of the“priming effect” (Jenkinson et al., 1985) with the emission of nitrous oxide (N2O) (Breitenbeck et al., 1980), and (iii) soil acidification and carbonate dissolution increase (Faurie, 1977; Raymond and Cole, 2003; Perrin et al., 2008; Gandois et al., 2011). Moreover, agricultural practices such as reduced tillage and crop rotation with surface residue cover have increased soil organic carbon and nitrogen content (Havlin et al., 1990), which may lead to an increase in soil organic matter and DOC in streamwater (Royer and David, 2005). In such anthropic CZ, it is thus important to develop methods to trace sources and pathways of che-micals (Nadiri et al., 2018), to identify processes (Nadiri et al., 2013)
⁎Corresponding author.
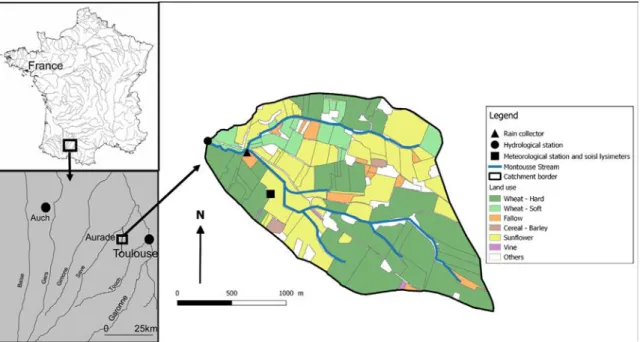
altitude of the catchment ranges between 172 and 276 m a.s.L., and the average slope is 9% (maximum slope 29%). The geological substratum is a Miocene molassic deposit (called molasse) resulting from the ero-sion of the Pyrenees Mountains and the subsequent sediment deposition in the Gascogne fan at the end of the Tertiary Period. This impermeable molassic substratum consists of a mixture of sands, clays, limestones and calcareous sediments (Perrin et al., 2008). The soils are mainly calcareous (locally called Terrefort), and are mainly composed of silts and clays of smectite type, which have a high potential for water re-tention (Perrin et al., 2008; Gandois et al., 2011). Soils are mainly developed from “molasse” and in a few locations from lacustrine limestones, and are organised as toposequences. The series of calcaric cambisols or rendzic leptosols (IUSS Working Group WRB, 2015) oc-cupies the top of the hills, whereas along the long slope with moderate steepness, deeper clayey calcaric cambisols or hypereutric cambisols have developed. Evidence of clay illuviation are sometimes observed. Finally, deep clayey calcaric cambisols with color mottling or gleyic properties from colluvial andfluvial deposits, occupy the alluvial plains along the main channel. Tillage and water erosion have shaped very shallow soils at the top of the hills (20–50 cm) and deeper colluvial soils, which can reach more than 2.5 m downslope (Perrin et al., 2008). In terms of land use, 90% of the Montousse catchment is devoted to agriculture with an annual rotation of wheat (58%) and sunflower (38%) and marginally barley, garlic, grass and fallow. Forested (3%) and farmhouse (3%) areas represent the remaining surface (Perrin et al., 2008). InFig. 1, as an example, the land use is shown for the hydrological year 2008–2009, which is considered as a mean year over the period (see results § 3.3.1). Applied fertilisers (around 110 kgN ha−1a−1) are mainly ammonium nitrate, sulphonitrate and potassium sulphate. Sulphonitrate is composed of (NH4)2SO4(sulphate ammonium) and NH4NO3(ammonium nitrate). Potassium chloride and urea are also locally applied in the catchment. Fertiliser application generally occurs between mid-January and April for wheat (Paul et al., 2015), whereas it is very scarce on sunflower.
Nitrate measurements in stream waters were started in 1985 by AZF Company in Toulouse (today GPN-TOTAL) to survey nitrate con-centrations and losses in relation to N-fertiliser input. This site has undergone experimental research and long-term environmental ob-servations since 2004 by EcoLab (initially in collaboration with GPN-TOTAL). In 1992, 43 farmers created an association (AAA, Association des Agriculteurs du Bassin Versant d’Aurade) to promote water quality in relation to best agricultural practices and landscape management in the Aurade catchment. One of their main initiatives was to set up, in 1992, vegetated buffer strip bands (grass bands) along the stream, which was awarded, in 1995, the French Prize “Pierre Sarazin” (Foundation and French Academy of Agriculture). Nowadays, the as-sociation has grown up to a regional asas-sociation (GAGT, Groupement des Agriculteurs de la Gascogne Toulousaine), which has gathered nu-merous farms and several sub-catchments. In 2017, they received an-other “Pierre Sarazin” prize for setting up an efficient experimental relay cropping relative to the site conditions.
The Montousse catchment at Aurade is an experimental agricultural catchment (Fig. 1) belonging to the French Research Infrastructure of Critical Zone Observatories (OZCAR, Observatoires de la Zone Critique Applications et Recherche). This experimental catchment (http://www. ecolab.omp.eu/bvea/) is also a regional platform for research and in-novation in Midi-Pyrénées (http://www.midipyrenees.fr/Guide-pratiquedes-plates-formes-de-recherche-et-d-innovation), and it is part of the international Critical Zone Exploration Network (CZEN) (http:// www.czen.org/;Banwart et al., 2012).
2.2. Hydro-climatology
The climate is of oceanic type (Köppen Climate Classification). The nearby Atlantic Ocean plays an important role in regulating the tem-perature and precipitation regimes. The mean annual regional air and indicators of changes in water quality (Bowes et al., 2015).
The hydrochemical surveys also point out the role of hydrological events in the transport of chemicals (Taghavi et al., 2010, 2011; Roussiez et al., 2013; Bowes et al., 2015; Darwiche-Criado et al., 2015; Fovet et al., 2015; El Azzi et al., 2016; Lloyd et al., 2016; Benabdelkader et al., 2018), as well as soil loss (Xiubin and Juren, 2000; Wang et al., 2016). In addition, agricultural practices play an important role in the intensity of surface and sub-surface runoff during flood events (Powlson et al. 2014; El Azzi et al., 2016; Rogger et al., 2017). Indeed, climate change (IPCC, 2008, 2013) may increase the risk of more frequent ex-treme hydrological events (Ribes et al., 2019). Long-term observations are thus needed to record the pattern of occurrence of major hydro-logical events which, in reactive systems, occur over very short time periods, and thus require appropriate tools for high resolution records. Nowadays, probes with various sensors and laboratories in the field (such as river labs) (Ferrant et al., 2013; Halliday et al., 2014; Floury et al., 2017; Freyberg et al., 2017) have completed the hydrological equipment of gauging stations. High-frequency studies have evidenced daily cycles on river discharge and their link with vegetation influence (Meyboom, 1965; Callede, 1977; Dawson, 1993), and on dissolved oxygen, pH or temperature (Fritz et al., 1984; Moatar et al., 1999; Moatar et al., 2009). Hydrochemical diel cycles were also shown in karst systems due to biological processes and calcite dissolution/pre-cipitation in streams (Montety et al., 2011; Jiang et al., 2013). Such high-frequency investigations have shown their ability to detect the evolution of the nitrate daily cycle in the stream from one season to another (Aubert and Breuer, 2016). According to Nimick et al. (2011), long-term studies which ignore daily cycles, include a bias in their in-terpretation. Identification and understanding of processes and hydro-logical pathways in agricultural catchments benefited from multi-time-scale studies (Tang et al., 2008; Braud et al., 2014).
The scientific community, particularly in France, joined efforts in various observatories of different CZ compartments in different en-vironmental conditions into a common research infrastructure called OZCAR (Observatoire de la Zone Critique: Application et Recherche) (Gaillardet et al., 2018). The Montousse catchment (called “Aurade catchment”) is one of the CZ observatories of OZCAR with 35 years of records monitoring nitrate concentrations and river discharge and 15 years of high-frequency river chemistry records for major elements. The catchment has been studied since 1985 to survey the impact of agricultural practices on soil erosion and water quality with special emphasis on the influence of N-fertilisers on carbonate dissolution (Perrin et al., 2008; Brunet et al., 2011), pesticide transfers (Taghavi et al., 2010, 2011), trace metals (Roussiez et al., 2013) and nitrogen behaviour (Ferrant et al., 2013; Paul et al., 2015), particularly during flood events.
In this context, the aim of this study is to: (i) investigate the var-iations of stream discharge and major element concentrations in the river water using long and short time-scale surveys with discrete and high-frequency data; (ii) to assess the origin of the elements; (iii) to highlight the key controlling factors and the key processes explaining the observed hydrochemical fluctuations (interannual, annual, sea-sonal, flood event, nycthemeral) and the long-term trends over the period of survey ; and, (iv) to demonstrate how the hydrochemical parameters measured at various time scales and frequencies can be used as indicators of internal catchment processes and changes in agri-cultural management and climate change.
2. Materials and methods 2.1. Study area
The Montousse catchment at Aurade (328 ha) is located in south-western France, 30 km west of Toulouse. The Montousse joins the Boulouze River downstream of Aurade village, which then meets the Save River, one of the left bank tributaries of the Garonne River. The
temperature is 13.9 °C. Since 1985, a significant increasing trend (0.050 °C yr−1 with R2= 0.47, p-value = 5.27*10−6; n = 34) can be observed, even if interannual variations occur. Moreover, since 1994 the occurrence of positive anomalous annual temperatures was ob-served, and in a continuous way since 2014 (Fig. 2a). Average annual rainfall calculated for the last 32 years is 621 mm, with a maximum value in spring.
Despite the temperature increase over the period (Fig. 2a), no sig-nificant trend was observed on annual stream discharge variations for the same period (Fig. 2b). Whereas, these variations point out a humid period between 1992 and 1996; since 1997, the occurrence of dry years
tends to increase. The annual discharge over 34 years (1985–2018) ranges from 44 to 336 mm (1985 and 1994, respectively), with a mean of 164 mm. The highest discharge period occurs in February and the majorflood events generally occur in May, while the low water flow period is from July to October. Because the molassic substratum is impermeable and the slopes are steep, the stream discharge is mostly supplied by surface and sub‐surface runoff during flash flood events (Roussiez et al., 2013). Mean evapotranspiration is high (500–600 mm), which refers to this catchment’s semi-arid hydroclimatic characteristics (Perrin et al., 2008). Evapotranspiration mainly occurs during high temperature period in summer (86%,Ferrant et al., 2013). Ground-water reservoirs are very limited and during the summer dry period, the stream discharge is very low and sometimes the stream dries up (Brunet et al., 2011).
2.3. Sampling strategy– sample treatment – field measurement
At the outlet of the stream calibrated by a V-Notch Weir (Fig. 1), the water level is measured continuously using a limnigraph (OTT20 1/5). Discharge is estimated from the rating curve. From October 1985 to October 2004, samples were collected automatically (ISCO 3600) three times a day, and the samples were mixed at the end of the week before being analysed. Thus sampling was not related to discharge. Since November 2004 once a week, instantaneous water samples were taken and some parameters were measured in the field (i.e. specific con-ductivity at 25 °C, temperature (°C), pH and dissolved oxygen (%) using a WTW probe). Moreover, since May 2006, N-NO3concentration, as well as pH, pressure (water level), conductivity, water temperature, turbidity and dissolved O2were registered at a high frequency (every 10 min) in the mid-depth of the water column using a YSI 6920 EDS multiparameter probe equipped with different sensors. Additionally, water samples were collected with an Ecotech automatic sampler AWS2002 (Bohn, Germany) logged to the probe (Ferrant et al., 2013), and sampling was related to water level variations. One sample is col-lected every 4 cm of delta water level variation. This is guaranteed to get a representative hydrological-dependent sampling during theflood event to complement weekly sampling. Moreover, to prevent any device problem, another automatic sampler (ISCO 3600) was programmed for sampling every day at noon. Nevertheless, the Buishand test (Buishand, 1982see § 2.5) applied to the time-series (1985–2018) did not detect any change-point due to the change in sampling protocol in 2004 (SM Fig. 1. Location of the Aurade catchment with the different sampling stations and the land use of the mean hydrological year (2008–2009) as an example.
Fig. 2. Fluctuations of the mean annual deviation from the interannual average (Δ in %): (a) air temperature at the Blagnac station (Meteo-FranceMeteo, 0000, https://publitheque.meteo.fr, mean = 13.9 °C over 32 years) and (b) discharge of the Montousse stream at Aurade station (EcoLab, mean = 164 mm.yr−1over 32 years).
J
500 1000 m 105
*
<l0
-5
-10
"
~~~~~~~~~~~~~~~~~
~~~~~~~~~~~~~~~~~ 10050
*
<l0
-50
-100
a
b
Legend A Rain collectore
Hydrological station•
Meteorological station and SOisl lysimeters - Montousse Stream D Catchment OOrder Land use • Wheat -Hard - Wheat-Soft • FallowTable 1).
Samples were collected in polypropylene plastic bottles of 2 L and 1 L for weekly and automatic samplings, respectively. Once in the la-boratory, samples were filtered at 0.22 µm with acetate cellulose Millipore filters. After filtrating 200 mL of water to rinse the filter, 300 mL wasfiltered. A subsample was kept for inorganic anion analysis and another subsample was kept for cations after acidification with 5 µL HNO36 N. Then, the last subsample was kept for DOC analysis after acidification with 20 µL HCl 6 N. This procedure was already positively tested and ensured that the acetatefilter does not release any organic contamination. The samples were then stored in darkness at 4 °C to stand before analysis.
2.4. Chemical analysis and probe calibration
The major cations (Ca2+, Mg2+, Na+and K+) and silica (SiO2) were measured by an inductively coupled plasma-optical emission spectroscopy (ICP–OES) system (Iris Intrepid II XLD, Thermo Electron). The major anions (NO3−, Cl−, SO42−), and in this context NH4+as a minor cation, and the minor anions (F−, NO2−, PO43−) were analysed by high performance liquid chromatography (HPLC, Dionex Chromatograph ICS 2000). The detection limits for major ions range between 0.2 µmol L−1and 65 µmol L−1. Nitrite and ammonium con-centrations were generally under the detection limits, except during someflood events for the latter one. Alkalinity was determined by acid titration with HCl (716 DMS Titrino, Metrhom). DOC was analysed on a Shimadzu TOC 5000 analyser using the 680 °C combustion catalytic oxidation method and CO2detection using an infrared gas analyser (NDIR).
N-NO3, discharge and conductivity probe drift was calibrated using weekly HPLC values, water level observation and conductivity mea-sured manually in situ, respectively. Under the assumption that drift was linear between two measurements, a drift coefficient was calcu-lated for each 10-minute time step (Ferrant et al., 2013).
2.5. Data treatment
During the period 2004–2018, a relationship between Ca+Mg (meq L−1) and conductivity (µS cm−1) (y = 3.49*10−3x + 1.04) (R2= 0.40, p = 2.2*10−16, n = 643) was set up using instantaneous data. This relationship was then used to simulate Ca+Mg high-frequency con-centrations based on high-frequency data of conductivity recorded by the probe.
Theflux Fi-i+1corresponding to each sampling interval (i to i + 1) was calculated using the mean arithmetic concentration and the water volume as follows:
∫
= + ∗ − + + + F C C V 2 i i i i i i 1 1 1 (1) with Ciand Ci+1: concentrations at time i and i + 1, respectively; V: volume offlow between i and i + 1.The annualflux Fawas calculated by summing theflux of all (n) sampling periods (i to i + 1) during one year, as follows:
∑
= − + Fa F i n i i , 1 (2) Finally, the average discharge weighted annual concentration was calculated using Fa/Va(with Va: equal to the total annual volume of flow).Statistical data treatments were done using R Studio software (version 3.5.1). The detection of a change-point in the long-term dataset was performed using the Pettitt test developed byPettitt (1979)and a Buishand test developed byBuishand (1982). Trend tests such as the Mann-Kendall test, Kendall rank correlation and linear regression were used to determine the long-term trend of each element. These results are shown insupplementary material(SM Table 1 and Table 2). Plot-ting for the ternary diagram was facilitated using the method developed byHamilton (2018). Spectral analysis was performed using R Studio and the methodology described inGolyandina et al. (2001). Spearman correlation analysis was used to determine the relationships between different elements since the normality test of data distribution failed. Principal component analysis (PCA) was performed on raw data transformed with log-ratio data using the rgr package.
3. Results
3.1. Stream water hydrochemical characteristics
As already stated byPerrin et al. (2008)for the period 2004–2006, the pH of Montousse stream water is neutral to basic (between 7.2 and 9.0). Calcium and bicarbonate are the dominant ions (5.68 meq L−1 and 6.20 meq L−1 average concentration, respectively,Table 1). So-dium and potassium concentrations are much lower (0.92 and 0.04 meq L−1, respectively). Chloride was the second most concentrated anion (1.43 meq L−1) followed by sulphate and nitrate (0.81 and 0.58 meq L−1, respectively). The cation-anion charge balance is lower than 5% for 69% of the total samples, and lower than 10% for 100% of the samples.
OnFig. 3(Piper diagram;Piper, 1944), the relative abundance be-tween ions indicated the dominance of calcium (47–86% of the total sum of cations), followed by magnesium (8–38%) and Na+K (6–17%). The cluster of points is well aligned between the calcium and the magnesium end-members, with a low variation of the Na+K propor-tion. HCO3−had the highest proportion among anions (34–85%) fol-lowed by NO3−+Cl−(10–55%) and SO42−(3–26%). Opposite to the cations, the cluster of points was more dispersed and evolved in two directions from the alkalinity pole to the sulphate end-member on one way, and to the nitrate+chloride end-member, on the other way.
The relationships performed on the minimum common dataset, in-dicate that most elements were strongly significantly related, particu-larly Ca, Mg, HCO3, Cl and SO4 (Table 2). Nitrate was significantly negatively related to other parameters, but with lower coefficients. All elements were also negatively related to discharge, except DOC and K, which are positively related together and negatively related to all the other chemicals. There is no correlation between nitrates and discharge. Silica was weakly related to other parameters, and only positively re-lated to Mg and HCO3. As a synthesis, in the PCA (SM Fig. 1,SM Table 2 Table 1
Average discharge weighted annual concentration, standard deviation (sd), median, minimum (min) and maximum (max) values of the discharge (Q) and main physico-chemical parameters in the Montousse stream from 1 October 2004 to 30 September 2018.
Q pH Cond Ca2+ Mg2+ Na+ K+ HCO
3− NO3− Cl− SO42− SiO2 DOC
Unit mm.yr−1 µS.cm−1 meq.L−1 mmol.L−1 mg.L−1
Average (sd) 164 (89) 7.94 (0.12) 859 (64) 5.68 (0.67) 2.13 (0.31) 0.92 (0.12) 0.04 (0.01) 6.20 (0.66) 0.58 (0.12) 1.43 (0.31) 0.81 (0.20) 4. 74 (1.52) 3.66 (0.77) Median 149 7.97 857 5.51 2.11 0.91 0.04 6.12 0.60 1.39 0.79 4.15 3.51 Min 47 7.58 749 4.47 1.56 0.77 0.03 4.91 0.36 0.89 0.53 3.88 2.53 Max 293 8.06 891 7.06 2.70 1.14 0.06 7.09 0.76 2.06 1.36 8.90 5.08
and SM Table 3), thefirst three axes represent 88.7% of the variance. Thefirst set of parameters (Ca, Mg, HCO3, Na, Cl, SO4) were strongly related to axis 1 (64.8% of the variance) in an opposite way to dis-charge. Potassium and DOC were also associated with axis 1, but also with axis 2 (13.1% of the variance), which is mainly driving NO3(82%) and secondary SO4 (11.6%). Silica was strongly related to axis 3 (85.7%), together with K of a lower intensity.
3.2. Long- and middle-term trends in streamwater chemistry
In this section, various time scale periods were considered to ad-dress the behaviour of the elements at the outlet of the Aurade catch-ment in relation to controlling factors such as environcatch-mental changes. At the long-term scale (35 years), only nitrate and discharge time series were investigated, whereas all major elements, DOC and discharge were considered at the middle time scale (15 years).
3.2.1. Long-term trends (35-year period)
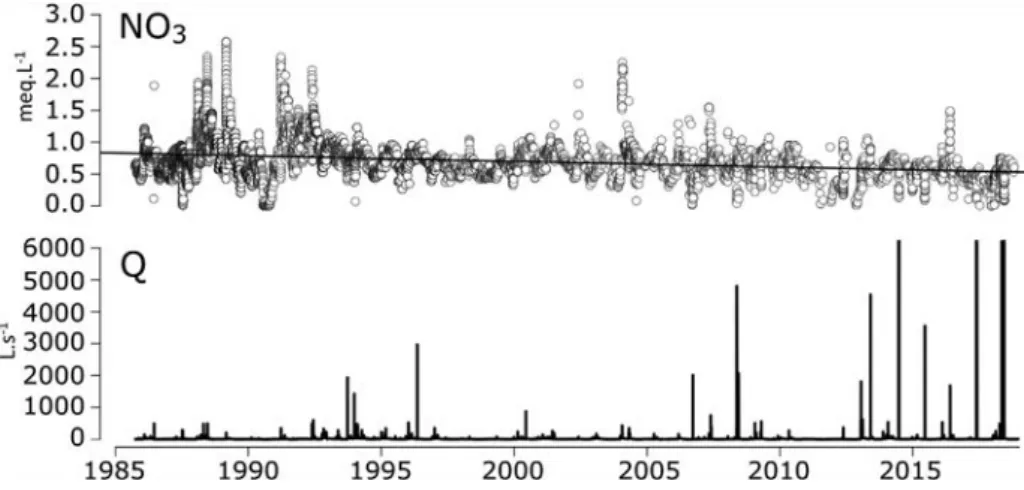
Nitrate concentrations and discharge measured over a 35-year period (1985–2018) provided evidence for long-term trends (Fig. 4).
A succession of dry and humid periods was observed. Four dry periods (1990–1991, 1997–1999, 2001–2003 and 2011–2012) with a low mean discharge (4.6 L s−1) were interrupted by minor storm events (like in spring 2012), whereas the rest of the period exhibited frequent moderate to highflood events. During the six last years of the survey Fig. 3. Piper ternary diagrams for major ion concentrations in Montousse stream waters from 2004 to 2018 (n = 893).
Table 2
Kendall correlation matrix of the major elements, SiO2and DOC concentrations, and discharge (Q) of the Montousse stream. Bold values: p < 0.01, italic values: p > 0.1 (n = 471).
Ca K Mg Na Cl SO4 NO3 HCO3 SiO2 DOC Q
Ca – K −0.23 – Mg 0.58 −0.25 – Na 0.57 −0.23 0.80 – Cl 0.60 −0.20 0.65 0.70 – SO4 0.60 −0.13 0.50 0.51 0.63 – NO3 −0.05 −0.34 −0.11 −0.14 −0.03 −0.05 – HCO3 0.66 −0.25 0.65 0.62 0.55 0.45 −0.10 – SiO2 0.03 0.06 0.11 0.04 0.03 −0.05 0.01 0.09 – DOC −0.23 0.50 −0.33 −0.27 −0.23 −0.14 −0.22 −0.28 −0.02 – Q −0.37 0.24 −0.60 −0.48 −0.42 −0.32 0.00 −0.50 −0.27 0.36 –
(2013–2018), considered as a humid period (mean discharge 20 L s−1), the most numerous and strongest flood events over the period were recorded (nine flood events over 5000 L s−1, including six in 2018, and among them, two exceptional events (Q > 13000 L s−1).
Because of the increasing number of storm events of high intensity in the last six years, the discharge trend significantly increased over the whole 35-year period (y = 2.0*10−5x – 183 with R2 = 0.04, n = 11288, SM Table 4).
On the other hand, the nitrate decreased significantly over the period (y = -1.7*10−8x + 1, with R2 = 0.06, n = 11268, SM Table 4). The highest concentrations were observed during the first 10 years of the survey (1985–1995) and were generated by moderate storm flows; such high concentrations were only observed for moderate hydrological events in January 2004 and, to a lesser extent, in May 2016. By 1992, the range of nitrate concentrations was lower, even during the last humid period (2013–2018) which exhibited the highest flood events ever registered.
3.2.2. Middle-term trends (15-year period)
The evolution of the major element concentrations, DOC content and stream discharge for the period October 2004-September 2018 is presented in Fig. 5.
The discharge pattern indicated a low mean baseline data (10.8 L s−1) interrupted by very rapid and significant storm flow events. A positive increasing trend (slope a = 1.1*10−4) was observed for discharge, which was more important than during the 35-year period (a = 2.0*10−5, SM Table 1).
The major element concentrations also varied along a base line with some positive (e.g., K, DOC) or negative (e.g., HCO3, Ca) fluctuations, and scarcely more or less significant outliers (e.g., SO4). These fluc-tuations were in correspondence with discharge variations. In parti-cular, the most significant outlier concentrations (both positive and negative values) occurred during spring storm events (e.g., NO3 and Cl, respectively), and during winter storm events for negative values only (e.g., NO3 and Cl). The exception is for K and DOC concentrations, for which only positive outliers were observed regardless of the storm event periods.
A significant decreasing trend over the period (p < 0.05) was ob-served in a decreasing order for concentrations of alkalinity, calcium, magnesium, chloride, sodium, sulphate and nitrate (Fig. 4 and SM Table 1). However, the decreasing trend for the three former para-meters was one order of magnitude higher compared with the other ions (SM Table 1). For nitrate, the slope of the trend (a = -3.0*10−8, p = 1.3*10−8, SM Table 2) for the considered period was higher than during the whole 35 year-period. Consequently, the mean nitrate con-centration over the last 15-year period was 0.58 meq L−1 compared with 0.77 ± 0.20 meq L−1 for the 35-year period (1985–2018) (Table 1). Note that the concentrations for all elements exhibited the highest/lowest (or close to) concentration values after the summer dry periods with the occurrence of the first autumn significant flows
80 60 fO
Ca2
20 20 40 60 80
i-Fig. 4. Variations of instantaneous nitrate concentrations (meq L−1) and instantaneous stream discharge (Q; L s−1) from 1985 to 2018 at the outlet of the Montousse catchment.
Fig. 5. Middle-term variations of instantaneous major ion concentrations (K, Na, Mg, Ca, HCO3, Cl, SO4, NO3), DOC and instantaneous corresponding discharge (Q in log10) for Montousse stream water over the period 2005–2019. Straight lines were linear regression trends over the period (for details of linear regression and Mann-Kendall refer toSM Table 1 and SM Table 4).
3.0
2.5
~ 2.0
E
1.5
1.0
0.5
0.0
6000
5000
4000
j
3000
2000
1000
0Q
1985
1990
1995
2000
2005
2010
2015
1 ~
:
::
~
o
.
o5
j
Ke
8 o~~J~
2 Nag
1 E ---! 2 '73
]
c-OJ 1 E 0 15l
.:.., 10af
5 E 0 0so
,
O~@
~~
~"~
10000l
Q \ •I
!
•
'
J
j
10~~ . J ~ . . l ~ ~
• 01-2005 01-2007 01-2009 01-2011 01-2013 01-2015 01-2017 01-2019(particularly in 2006, 2011 and 2012), and in winter or spring (parti-cularly in 2014, 2015 and 2018) with the majorflood events, respec-tively. On the other hand, DOC and potassium concentrations sig-nificantly increased over the period (y = 2.1*10−7x-0.3, p = 4.03*10−10; y = 7.4*10−10x + 3.6*10−2, p = 0.06, respectively, SM Table 4), but K is the only element for which the trend is not sig-nificant (p > 0.05). Note that the data interruption observed in 2006 and 2008 had to be related to the absence of measurements for cations, alkalinity and DOC, whereas in 2011 and 2012, it was due to dry conditions.
3.3. Short-term trends
3.3.1. Annual and seasonal variations
As an example, the hydrological year 2008–2009 (October 2008-September 2009,Fig. 6) was investigated to evaluate the annual and seasonal patterns of stream water concentrations in more detail. This year was chosen because the annual and seasonal patterns and mean discharge (Q = 18 L s−1) were representative of the mean 35-year period (Q = 17.2 ± 8.7 L s−1).
On an annual basis, seasonal variations can be observed for dis-charge as well as for concentrations. Typical for this catchment, the
highflows occurred during the winter and spring period (November to May), whereas the low-flow period extends from early summer (June) to early autumn (October) (Fig. 6). Fiveflood events were registered over the year, among which the two most significant ones were rather minorflood events (between 100 and 1000 L s−1), as regard to the 35-year period; however, they were representative of 45% of the total flood events registered over this whole period. These events occurred in January and April and represented 26% of the total annual discharge of the 2008–2009 hydrological year.
The baseline concentrations and the positive or negative outliers of the major element concentrations due to discharge variations, were in agreement with what was already mentioned for long-term trends. Seasonal variations were observed for Na, Mg, Ca, Cl, HCO3(note that the data were scarcer) and DOC with lower and higher concentrations in summer and winter, respectively, with reference to the base line. Potassium and SO4concentration trends were stable with a slight in-crease in autumn (by November). Nitrates showed a different behaviour with a concentration increase from late winter to early summer (February to August) and then, a decrease to the end of September.
On a shorter time scale during 2008–2009 year, the concentrations of Na, Mg, Ca, Cl, SO4, NO3and HCO3decreased with increasing dis-charge during eachflood event, whereas concentrations increased for K Fig. 6. Variations of instantaneous concentrations of major ions (K, Na, Mg, Ca, HCO3, Cl, SO4, NO3), DOC and discharge (Q) for stream water at the outlet of the Aurade catchment for the hydrological year 2008–2009. Due to technical problems, no data were registered during March 2009 for all elements, except discharge, and from mid-December 2008 to mid-January 2009 for DOC. Note also that for the November 2008 event, DOC was not registered extensively.
.:..,
g
0.1~ 0.10 E 0.05 0.~01.S~1.0
Eo.s
l
~ 2.5 3_;o.o
~H
:,
ci-<lJ E 1.0·; :
i
!
j
~
~
~
~
1~i
~
:
:
l
o
0t1:1
g
1.0
l
E 0.8 0.6 8 0.4 E 2 K 0 o O Ogoj
O&fco
o0 0Na
eoo oo(l)0 ~<C:loo Coo Mg eoo Oo'ool ~ oo o)
(j 0 g Ca 0 (1)01<c,08000 Oii
e
0::)0 Oo 8 Q HCO, 'bo~'(,Oo 00 0 0 octi;> o 8 g 08
NO,so
,
8
0 0 0 0 00~
O O~o 0 'Qoo co~ coe
o o ~o g oO<oOooo 0 o O 0 0 0 0 0 0 0 0 0 0 0 0 OOoOOOOo Co 0 0 00 0 0 0 0 o o 'i5Doo o oco o o o o o o o~O oo Doooooooe
Co 0 o ol;f <6¾::,o o o eoo coo eo o o ' o ~ o 0 g oooioo 0 OO<PoOO co 0 o oooooo o DOC 0 0 0 0 o0o ~ 00 i£3bo o o<o o o O o o o o~:
l
,
111
l
: .. ,
....
_.".1'-
·
··
0,i
•
·
• ~'·••
I I-
•
·
••
·
I•·•·•
·
•
·
t
·
•-•
•·
•·
·
·
····
··
t···
····
tt
oct nov dee jan feb mar apr
2008
may jun
2009
and DOC. There was an exception during thefirst small flood event in November 2008 which occurred after the dry summer period, in which Cl and SO4concentrations increased, and NO3concentration decreased and then increased.
3.3.2. Weekly and daily variations
To focus on detailed trends, a 10-day period was selected during the same hydrological year 2008–2009, and January 2009 included a low waterflow period and a flood event (Fig. 6). Concentration variations were observed on both instantaneous sampling data (respective points: Ca+Mg, NO3and DOC) and hourly smoothed data using continuous probe recording (lines: Ca+Mg, NO3and discharge) (Fig. 7a). During the lowflow period, extending from 15 January to 22 January 2019 (if we include the very smallflood event on the 20th), Ca+Mg, NO3, DOC and discharge varied between 7.8 and 8.9 meq L−1, 0.4 and 0.8 meq L−1, 2.0 and 3.2 meq L−1and between 10 and 32 L s−1, respectively. After this period, a major flood event from 23 to 25 January 2019 provoked steep changes in Ca+Mg, NO3, DOC concentrations and discharge, which varied between 4.2 and 8.9 meq L−1, 0.2 and 1.3 meq L−1, 2.2 and 7.5 meq L−1and between 12 and 508 L s−1, respectively (Fig. 7a).
3.3.2.1. Low flow period. During the non-influenced meteoric period (15–19 January 2019), a rather stable base line of nitrate and Ca+Mg concentrations as well as discharge, was observed (Fig. 7a). This
situation was observed after a 5-week period without any significant rainfall (< 10 mm per day; the last hydrological event occurred on 18 December 2018). Only some variations were observed around the baseline of concentrations, which can be clearly associated with daily time step for nitrates, whereas it is less obvious for Ca+Mg. After January 19th, a small increase in discharge contributed to a decrease in concentrations, more obviously observed in the NO3pattern. Despite this perturbation, the daily time-stepfluctuations for water temperature and nitrate concentrations can still be observed. A signal analysis was performed to detect the concentration patterns at daily/hourly time scales (Fig. 7b and 7c).
The continuous NO3 and Ca+Mg concentrations signal was de-composed (Fig. 7b, 7c, respectively) into three components: 1) a smooth trend representing the main trend and often the major part of the signal amplitude relative to the original signal (81.8% and 19.4%, respec-tively), which exhibited a different pattern for the two chemicals (de-creasing at the end of the period for NO3and increasing in the middle part of the period for Ca+Mg); 2) a nycthemeral cycle of a 24 h-period representing 39.1% and 31.1% of the relative signal amplitude for NO3 and Ca+Mg, respectively and 3) the rest corresponding to the residual fraction not explained by thefirst two components (28.7 and 77.1% of the relative signal amplitude for NO3and Ca+Mg, respectively).
The general daily variations (or nycthemeral variations) are syn-chronous for Ca+Mg and nitrates (with maximum between 8:00 and 9:00 a.m. and minimum between 8:00 and 9:00 p.m.) and asynchronous Fig. 7. Very short-termfluctuations - (a) Continuous measurements using probe recording (lines) and instantaneous samples (points) of NO3(red line and circle points), Ca+Mg (grey dashed line and black triangles), DOC (only punctual sampling in green squares) and of discharge (blue dotted line) from 15 January 00:35 am to 25 January 03:28 am 2009. The three lines are hourly-smoothed signals from continuous probe recording. (b) and (c) Decompositions of the original probe signals ((b) for nitrates and (c) for calcium plus magnesium calculated from conductivity probe signal) into three components (smooth trend, nycthemeral, residual).
:.., er (I) E
"'
0z
142.01 10 10
a
Low water period Flood event 50012--i E:10 Cl. E
2
8 -Q)i
6•
1
os
j
2 2 0O
.
O
J
0
b
0.7 0.6 Smooth Trend 0.5 0.4 0.05 0.00 -0.05 0.04 0.00 -0.04 15 16 5"
" I~
'
•
375 0'
"'
.c. 250 125.
-
--
...
----
-
---
--
----
..
..
..
-
-
-4~ ~ - ~ - - ~ - ~ - ~ - - ~ - ~ - - ~ - ~ - ~ - - ~~o 22 23 24 25 17 18 19 20 21 15 16 17 18 19 20 21PCA axis 2 (SM Table 3) represented the soil component contribution. Soil leaching of nitrates remaining after the denitrification process contributed to the observed nitrate concentration in streamwater (Sebilo et al., 2013; Paul et al., 2015). The similar pattern between DOC and K (R2= 0.38; p < 0.001;Table 2andSM Table 3, SM Fig. 1) is consistent and attests to their partly common origin from organic matter stored mainly in the upper soil horizons, enriched by the crop residue supply degraded by micro-organisms (Loÿe-Pilot, 1985; Soulsby, 1992; Idir et al., 1999). PCA axis 2 was thus an indicator of both surface horizon contribution (K, DOC) and deeper soil horizons (nitrates).
4.2. Natural and anthropogenic controlling factors at various time scales 4.2.1. Hydrological conditions
The water discharge variations of the Montousse stream were under the influence of the climate of southwest France, which consisted of a humid period from late autumn to early spring and a dry period in late spring and summer (Figs. 1and4). This confirmed that the hydrology of a given catchment was controlled by the regional climatic regime (Gupta et al., 1986; Kendall and McDonnell, 1998; Van Loon and Laaha, 2015).
Discharge variations were the main driver of the range of element concentrations, as was confirmed by the correlation matrix and the PCA axis 1 (Table 2 andSM Fig. 1 andSM Table 3). High or low con-centration outliers were observed at various time scales: 30 years (Fig. 4), 15 years (Fig. 5), as well as for seasonal and daily observations (Figs. 6and7).
The interannual, seasonal and daily (more obvious forflood event) variations in stream water ion concentrations can be related to dis-charge variations (Figs. 4–7). The converging of decreasing con-centration trends observed for Ca, Mg and Na (of similar origin from mineral weathering) could be related to the increasing discharge over the 15-year period, which was particularly due to the higher number of significant flood events during the last years of the survey (Fig. 5), but was not observable at the annual scale (Fig. 2). This was evidenced by the Pettit and Buishand tests (SM Table 1) and on the trend coefficients (SM Table 4). The consequence for Ca concentration (but also for Mg and Na) is a dilution process (Figs. 6 and 7andSM Fig. 1a) by less concentrated waters from surface-flow components of different water origins (rainwater and surface runoff, soil solutions with subsurface flow) with less relative contributions of concentrated groundwater flows (Probst, 1985; Wels et al.,1991; Ladouche et al., 2001).
The significant nitrate concentration decrease over the 35-year period (Fig. 4) might be partially linked to changes in hydrological conditions, particularly because of the strongest dilution in the last decade with the increase of the frequency and intensity offlood events. If the decreasing nitrate trend was already detected during the twofirst decades (see § 4.2.2), the slope of the initial general decreasing trend was increased when considering the whole period (y = -1.7*10−8x + 1.0;SM Table 4). Nevertheless, the water discharge pat-tern was not obviously the main driver of the nitrate trend over the whole period since it did not change significantly if the last period is removed (y =−1.0*10−8x + 0.9; R2= 0.01; n = 10352; period 1985–2011).
Indeed, after 2004, the sampling strategy took into account more precisely the variation of concentrations during storm events. The dif-ference between sampling strategies before and after 2004 (see §2.3) could thus be reasonably evoked as influencing the observed trends. However, the decreasing trends of nitrate were similar regardless of the period (Fig. 5). The more efficient capture of individual storm events, which were the major means of nitrate exportation over the last 15-year period, did not lead to an occurrence of increasing concentrations during these hot-spot moments. The decreasing trend was even stronger by 2004 (Figs. 4and5). Consequently, the regular decreasing trend of nitrate concentration was not significantly due to the influence of for temperature (Fig. 7a).
3.3.2.2. Flood event. The discharge increase during the main storm event 23–25 January 2019 led to the high variations of concentrations detected on both instantaneous samples and continuous probe measurements. Disturbances of daily cycles were also registered by probe measurements. The rising discharge (508 L.s−1) provoked a general synchronous diminution of Ca+Mg and NO3 concentrations, while DOC content increased. During the recession period, the discharge and DOC decreased, while Ca+Mg and NO3 increased. Note that the dilution observed for nitrate (52%) was more important than for Ca+Mg (35%). The maximum dilution for nitrate occurred during the first rising step of discharge, whereas it was during the maximum discharge for Ca+Mg. Otherwise, each discharge pulsation during the flood event provoked a synchronous opposite variation for Ca+Mg and NO3. The recovery base flow value was not reached at the step of discharge recession for Ca+Mg. The nitrate pattern was more erratic and exhibited a peak concentration (85% increase compared with the value before the storm) four hours after the peak of discharge during the recession flow period (on 23 January 2019).
4. Discussion
4.1. Origin of elements in the stream waters
The composition of major elements in river water was strongly re-lated to soil and bedrock composition of the drainage basin (Gaillardet et al., 1999; Garrels and Mackenzie, 1971; Meybeck, 1986, 1987; Probst, 1992; Tardy, 1971). The dominance of calcium and magnesium among cations and of bicarbonate among anions (Table 1; Fig. 3) in the Montousse stream water, resulted from the weathering of the calcar-eous molassic substratum and soils (Perrin et al., 2008), as indicated by their strong positive relationships (Table 2, SM Fig. 1 and Table 2 and SM Table 3). The likely source for these ions, Ca, Mg, HCO3, was consistent with similar variations observed at every time scale (Figs. 4 and 5) and with their relative importance, particularly during low water (Fig. 3). Sodium was less concentrated in the stream and like silica it mainly originated from the weathering of plagioclases, which are more scarcely found in the molasse and in silicate stones frequently found in the soils. This was consistent with the presence of quartz and phyllosilicate minerals in the soils and in the streambed sediments (Bur, 2008). To a lesser extent, Na was also brought by atmospheric de-position (very significant Na-Cl correlation, Table 2), as well as po-tassium, which contributed up to 52% of the total riverine concentra-tions (as estimated by Perrin et al., 2008); nevertheless, these inputs have been mainly related to local fertiliser applications (from January to April), which enriched the precipitation fallouts. More widely, fer-tiliser input to soils (K2O (N-P-K)) was the main source of K to the stream. To a lesser extent, the weathering of bedrock feldspars was also a contributor of K to stream water (Perrin et al., 2008). A delayed secondary source was from the cultivated plant residues, which were regularly buried in the tillage soil horizon following crop yield. Indeed, this potassium mainly originated from fertilisers, and accumulated in plant tissues (Gregory et al., 1979); this turn back to soil contributed to soil surface enrichment. The common link between silica and to a lower extent K, to Axis 3 of PCA (SM Table 3) indicated this probable source of both elements, wheat straw being particularly enriched in silica. Indeed, the fact that K was related to the three PCA axes (SM Fig. 1 and Table 3) reveals the multiple sources of K. A strong increase in K con-centration in stream water was observed during the storm events fol-lowing fertiliser applications (February and May as, e.g., Figs. 5 and 6), and also in autumn after the tillage period in September-October (Fig. 5). Acid anions (NO3, Cl and SO4) mainly originated from fertiliser input to soils (Perrin et al., 2008) and the rest from oceanic precipita-tion input from long- and short-range atmospheric polluprecipita-tion deposits (Probst et al., 1995; Pascaud et al., 2016). Their common link to the
evapotranspiration can be one of the controlling factors due to intense evapotranspiration in summer (Perrin et al., 2008), the occurrence of this pattern during the winter period (as observed for ex. in January 2009,Fig. 7), inferred that other processes might reasonably be evoked (see § 4.2.2.).
4.2.2. Geochemical, physical and biological processes
In addition to hydrological parameters, physical, biological and chemical parameters may influence the trends and patterns of element concentrations as well.
At a 35-year scale, the significant increase in air temperature (Fig. 2a) had a strong impact on various environmental factors of the CZ, which was not possible to measure or simply detect. However, the observed significant decreasing trend of Ca, Mg and Na (Fig. 5) might be explained by at least two geochemical mechanisms, detectable at various time scales:
(i) the rise of water temperature (as a consequence of increased air temperature,Fig. 2a) amplified the precipitation of the calcite and dolomite fraction of the molasse (Perrin et al., 2008; Bur et al., 2009; Gandois et al., 2011). The dissolution of carbonate was limited by the inverse temperature dependence of the absolute so-lubility of calcite (Drever, 1997; Langmuir, 1997). Indeed, calcite precipitation was observable in the stream bed of the Montousse. In addition, a decrease in temperature during a stable hydrological period matched the increase in Ca+Mg concentrations, detected at the hourly scale using continuous probe measurements (e.g., period of 16–18 January 2009;Fig. 7c), and evidenced by spectral analyses and signal decomposition. The precipitation of calcite might thus occur at this daily time step: the nycthemeral cycle of 24 h with lower concentrations (due to increase of temperature by solar heating during the day) and higher concentrations (during the night) of Ca+Mg was detectable (Fig. 7c). This phenomenon was also observed during the night in a karstic catchment (Montety et al., 2011; Jiang et al., 2013; Kurz et al., 2013). A higher con-centration of Ca and Mg during the cold winter period was also observed at the yearly scale as well (Figs. 5 and 6), as already ob-served by Probst and Bazerbachi (1986) in the upper Garonne River.
(ii) the impact of N-fertiliser input, which increases the production of H+in soils (Gandois et al., 2011), stimulated the carbonate dis-solution (Perrin et al., 2008). The improvement of agricultural practices by reducing N fertiliser input as was done in this catch-ment from the 1980s, might have contributed to reduced carbonate dissolution and/or lower depletion of the exchangeable base sa-turation in soils due to less proton exchange. Consequently, a de-crease of Ca, Mg and Na leaching from soil to stream water might occur. This was consistent with the decreasing trend observed for nitrate concentrations (Figs. 4 and 5).
In addition to the precipitation of calcite with temperature increase, the nycthemeral cycle of Ca+Mg (Fig. 7a) was also influenced by biological assimilation and by chemical transformation. Indeed, the synchronous 24-hour cycle between Ca+Mg and nitrates, with lower concentrations during the day than during the night, indicated that plant, biofilm and phytoplankton primary production in the stream channel consumed nitrates and dissolved CO2for photosynthesis and then, enhanced the calcite precipitation in the riverbed during the day. Nevertheless, not only calcite precipitation should be involved, but also biological assimilation by plant due to water pumping (Dawson, 1993) and nitrification/denitrification processes (Duan et al., 2014) (Fig. 7b and c, respectively). The role of phreatophytic vegetation was evi-denced to impact river water levelfluctuations (Meyboom, 1965). We mentioned in §4.1 that the Montousse dischargefluctuated during night and day, possibly in relation to the evapotranspiration process. The nutritive elements were thus mostly absorbed by the riverine vegetation sampling strategy (as also evidenced by the Pettitt and Buishand tests,
see SM Table 1).
During the entire survey period, the low nitrate concentrations observed during each dry period (1990, 1997–2000, 2001–2004 and 2011–2012) could result from limitation of soil leaching and conse-quently, of transfer to the stream (Scholefield et al., 1993; Oeurng et al., 2010; Darwiche-Criado et al., 2015). The periodic discharge variations influenced accordingly the concentration patterns, but could not ex-plain the general trends observed over decades. Moreover, if hydro-logical events might lead to some nitrate concentration/dilution, si-milar storm intensities did not lead to sisi-milar nitrate pattern responses (Fig. 4), as was already observed in the literature (Oeurng et al., 2010; Bowes et al., 2015). The soil condition in terms of moisture, tempera-ture and precipitation intensity, were among other key factors ex-plaining these discrepancies (Scholefield et al., 1993; Weier et al., 1993; Willems et al., 1997).
The hydrological and seasonal conditions were the drivers of the two different clusters of points observed in Fig. 3 (higher proportion of SO4 or of NO3+Cl vs HCO3, Fig. 3). By focussing on the annual survey scale (Fig. 5, e.g., November event), it was easy to detect that the highest concentrations for all major elements (more obvious for po-tassium, sulphate and chloride) were recorded with the first flood event following a dry summer period, as already observed by Foster and Walling (1978) and Reynolds et al. (1992). Indeed, during the dry summer time period, the transfer of those elements to the stream was limited (Fig. 5). Following these conditions, the first storm event loaded and carried elements accumulated in soils by concentration (elements from mineral weathering or dissolution such as Ca, Mg, Na and/or from fertiliser input, K, Cl, SO4, NO3) and adsorption/desorption processes, particularly obvious for sulphate as described in many catchments (Piñol et al., 1992; Probst et al., 1990; Probst and Ambroise, 2019). This high concentration was described as “the washout effect” (Piñol et al., 1992) or a“flush” effect (Reynolds and Edwards, 1995).
If the increasing trend in potassium and DOC concentrations over the 15-year period could not be related to a significant trend of dis-charge (Fig. 5), the high number of intense flood events at the end of the period (2013 and 2018; more details in Ponnou-Delaffon’s PhD, in progress) could have led to increasing concentration release (see Fig. 7 for DOC). Indeed, instantaneous DOC and K concentrations are related to instantaneous discharge (Table 2). The rapid and intense storm events were characterised by an intense runoff, which favoured the erosion and leaching of surface soil layers enriched in DOC (Idir et al., 1999; Dalzell et al., 2005) and K (as discussed in §4.1) and was the cause of the observed high outliers of DOC and K concentrations ob-served in Figs. 5 and 6 (Römkens et al., 2001).
Over the 35-year period, the continuous occurrence of anomalous positive annual temperatures observed since 2014 (Fig. 2a) was not accompanied by a significant increase in discharge at the yearly scale (Fig. 2b), but by a higher occurrence of flood events with discharge intensities never reached before (Fig. 4). This was observed elsewhere in the world (Ribes et al., 2019) and was an indicator of significant climatic change.
The daily oscillations recorded for conductivity, nitrates and pH using continuous probe measurements during the non-influenced me-teoric discharge conditions, were associated with nycthemeral cycles (Fig. 7a). Indeed, daily variations were also observed in discharge during the non-influenced meteoric period in the Montousse stream (not shown). This phenomenon was already observed by other authors (White, 1932; Callede, 1977; Burt, 1979) for discharge, groundwater level, specific conductance, water temperature, pH, nitrates, phos-phates, stables isotopes, DOC, dissolved inorganic carbon, calcium and dissolved oxygen (Schurr and Ruchti, 1977; Moatar et al., 1999; Scholefield et al., 2005; Pellerin et al., 2009; Nimick et al., 2011; Kurz et al., 2013; Schwab et al., 2016). It has been interpreted as resulting from plant evapotranspiration (White, 1932) as one of the main con-trolling factors of the daily hydrological cycle. If for the Montousse,
release by plant root nutrient uptake (as explained in § 4.2.2;Perrin et al., 2008; Gandois et al., 2011).
4.3. Interests of various time and frequency scales of hydrochemical surveys as environmental indicators
The survey of the CZ of the earth is nowadays well accepted as a major challenge for the future (Banwart et al., 2012; Brantley et al., 2015). However, the various time scales and frequencies of observa-tions as indicators is important to point out. The Aurade catchment is one of the few CZ with 35-years of hydrochemical surveys in France. This long-term survey has evidenced the changes in water chemistry due to agricultural practices and/or climate change (particularly the consequence of temperature increase and of the occurrence of erratic hydrological events,Figs. 2 and 4). The sampling strategy allowed us to catch the role of hydrological events on the chemicals over the different periods of time from 35-years based on discrete sampling to high-fre-quency (minute) probe measurements. These extreme time scales and frequencies of observation indicated changes in concentration variation patterns and were powerful in identifying the origin of the elements and the mechanisms of regulations. The 15-year period of survey revealed some significant trends. Yearly variations (humid/dry years), seasonal variations, and the role of some agricultural practices, temperature increase (also shown byWhitehead et al., 2009) and, surface soil ero-sion by increased storm events (like for K or DOC increase) were de-tectable. But statistics were less robust than for the 35-year period (for nitrates) and the period was too short for detecting a climate change influence (Figs. 4 and 5) (Boé, 2007), whereas it could be evoked with the 35-year period of survey. The 15-year and yearly surveys evidenced seasonal influence on concentration variation patterns, as well as the breakdown of hydrological events on water chemistry. However, the nycthemeralfluctuations were only clearly demonstrated by the precise continuous probe measurements (Fig. 7), which avoid intensive discrete samplings and analytical performance (as already stated by Ferrant et al., 2013for nitrates). Detailed mechanisms related to hydrology, biology and geochemistry, as well as the origin of a set of elements, were identified. These different scales of survey were very informative to set up modelling approaches and predictions since long-term trends can be used for validation and calibration. The origin of elements and identified processes (geochemical, hydrochemical, biological) at the shorter time scale could also improve modelling designs.
In such a catchment, having highly responsive discharge to rainfall, the high frequency survey also allowed us to reveal concentration/ discharge relationships (Lloyd et al., 2016) and to improve (without extended samplings) the calculation accuracy of element fluxes ex-ported duringflood events, which consisted in hot-spot moments of element exports (e.g., 94.1% for the total suspended particulate matter (SPM) export byflood events in 2009, Roussiez et al., 2013) (Lloyd et al., 2016; Meyer et al., 2019).
5. Conclusion
The target of this study was to use the power of the various time scales and frequency of observations of hydrochemical parameters in a cultivated catchment as indicators of the key factors influencing the concentration variations and the chemical transfer in the stream.
On a long-term survey (35 years), no change in mean annual dis-charge was detectable, but instantaneous disdis-charge increased mainly due to more frequent and intenseflood events in the last five years, in relation to an obvious temperature increase at the regional scale. During this period, the nitrate concentration decreased, but more in-tensively during the last 15-year survey, like Ca, Mg, Na, HCO3, Cl and SO4concentrations. On the other hand, significant increasing trends of K and DOC concentrations were observed. The main explaining factors of these trends were: improved agricultural practices (reduced inputs of N fertilisers, more adapted spreading period, set up of strip bands, relay during the day (Callede, 1977). Such nycthemeral variations could also
be observed for other parameters like water temperature, phosphorus (Bowes et al., 2015) or other major elements with very short time-scale recordings (Fritz et al., 1984; Floury et al., 2017, Meyer et al., 2019).
Another consequence of the increase in air temperature is the in-crease in soil microbial activity and organic matter mineralisation (Lloyd and Taylor 1994; Kirschbaum, 1995), particularly at the soil surface mostly enriched in organic matter (Cole et al., 2002; Clark et al., 2010). The increasing DOC concentration over the 15-year period in stream water (Fig. 5) might thus be a consequence of a higher carbon availability at the soil surface, leached with subsurface runoff during fast flood events (Freeman et al., 2001; Worral and Burt,2004). The intense organic matter mineralisation process in soils explained the post-summer flush of sulphate and other elements and was also con-sistent for the DOC pattern. The increasing temperature during the warming period (February to July) also stimulated the microbial ac-tivity and the denitrification processes, which might contribute, fol-lowing soil leaching, to the decrease of nitrate concentrations (Perrin et al., 2008; Paul et al., 2015).
4.2.3. Agricultural practices
By 1992, the farmers had improved their agricultural practices to perform a more sustainable agriculture in the Montousse catchment. It consisted, at that time, of the very innovative initiative to set up grass bands along the stream (which aimed to reduce soil nitrate transfer to stream water), as well as a more adapted dose and spreading periods of N-fertilisers. It is undoubtable that the decrease of mean nitrate con-centrations over the period and the large reduction of nitrate peaks during storm events by 1992, might be a consequence of these agri-environmental management methods (Fig. 4). Moreover, the Pettitt and Buishand statistical tests showed a significant change-point in nitrate concentrations the year after the set up of strip bands (in 1994 and 1993, respectively, SM Table 1). During the last 15 years, the most significant decrease (SM Table 4) of nitrate concentration in stream water might attest that (i) soils have been progressively leached from N excess, (ii) mineral fertiliser input to soils continue to decrease (this is consistent with chloride and sulphate decrease) and (iii) changes in soil agricultural practices (like reduced tillage or no tillage) might have contributed to biodiversity improvement favouring denitrification processes (Regina and Alakukku, 2010) and reducing soil erosion (Phillips et al. 1980; Seta et al., 1992). The similar diminution trends over the 15-year period of the elements originating mainly from ferti-liser applications, were consistent (Fig. 5).
Indeed, the increase in potassium and DOC over the period might be an indicator of change in agricultural practices over time. As stated before, the more frequently performed burial of crop residuals in soil surface might have contributed to increased DOC and K content at the soil surface horizon. However, the absence of soil cover during winter and spring (in some parcels, e.g., where sunflower was planted) in-creased the risk of soil erosion and of the transfer of these two elements in stream water by surface runoff, particularly because of the very steep slopes in this critical zone. The lower increasing trend of concentration for K compared to DOC (SM Table 4) is probably related to the decrease in fertiliser input due to improvement of agricultural practices.
The high concentrations of nitrate, chloride and sulphate, observed in the following storm events (e.g., flood 30 April 2007 and 28 May 2016 for NO3; Fig. 5) (Paul et al., 2015), as well as at the seasonal scale (by the end of most of January, Figs. 5 and 6), indicated that the period of fertiliser spreading also had a direct influence on stream water composition on a short time scale. This was already reported in Auradé catchment as well as in other agricultural catchments (Ferrant et al., 2013; Bowes et al., 2015).
Finally, changes in agricultural practices, namely reduced N-ferti-liser input and more adapted periods of spreading, may be one of the reasons for Ca+Mg decreasing trends in stream water by lowering mineral exchange/weathering processes, proton production and CO2