Université de Sherbrooke
Evaluation of the radioprotective ability of cystamine as a
function of radiation quality using Monte Carlo simulations of
the radiolysis of the Fricke dosimeter
ParEsteban SEPULVEDA
Département de médecine nucléaire et radiobiologie
Mémoire présenté à la Faculté de médecine et des sciences de la santé en vue de l’obtention du grade de maître ès sciences (M. Sc.) en sciences des radiations et imagerie biomédicale
Sherbrooke, Québec, Canada Novembre 2018
Jury
Pr Armand Soldera Examinateur, Département de chimie, Faculté des sciences Pr Benoit Paquette Examinateur, Département de médecine nucléaire et
radiobiologie, Faculté de médecine et des sciences de la santé Pr Jean-Paul Jay-Gerin Directeur de recherche, Département de médecine nucléaire et
radiobiologie, Faculté de médecine et des sciences de la santé
R
ÉSUMÉÉVALUATION DE LA CAPACITÉ RADIOPROTECTRICE DE LA CYSTAMINE EN FONCTION DE LA QUALITÉ DU RAYONNEMENT À L’AIDE DE SIMULATIONS MONTE CARLO DE LA RADIOLYSE DU DOSIMÈTRE AU
SULFATE FERREUX DE FRICKE Par
Esteban SEPULVEDA
Département de médecine nucléaire et radiobiologie
Mémoire présenté à la Faculté de médecine et des sciences de la santé en vue de l’obtention du diplôme de maître ès sciences (M.Sc.) en sciences des radiations et imagerie biomédicale, Faculté de médecine et des sciences de la santé, Université de Sherbrooke,
Sherbrooke, Québec, Canada, J1H 5N4
La protection radiologique joue, aujourd’hui, un rôle clé dans de nombreuses applications, y-compris l'ingénierie aérospatiale, les accidents nucléaires, le terrorisme nucléaire/radiologique, la radiobiologie militaire et la radio-oncologie clinique. La cystamine, forme disulfure de la cystéamine – un aminothiol de la même famille, est un composé connu pour son potentiel radioprotecteur en clinique pendant des procédures de radiothérapie. Une manière pratique pour évaluer son efficacité radioprotectrice est basée sur l'utilisation du dosimètre au sulfate ferreux de Fricke en combinaison avec des simulations Monte Carlo. La radiolyse du dosimètre de Fricke, basée sur l'oxydation des ions ferreux en ions ferriques par les espèces oxydantes •OH, HO2• et H2O2 produit par la
décomposition radiolytique de l'eau en solution acide aérée, forme la base de notre étude. La présence de cystamine dans les solutions pendant l'irradiation empêche la radio-oxydation du Fe2+ et entraîne une diminution des rendements (ou valeurs G) en Fe3+. Les résultats indiquent clairement que l'effet protecteur de la cystamine provient de sa capacité à capturer les radicaux libres, ce qui permet à ce composé d'agir en compétition avec les ions Fe2+ pour les divers radicaux formés lors de l'irradiation de l'eau environnante. Nos simulations Monte Carlo ont permis de réaliser l'évaluation de l'efficacité protectrice de la cystamine pour diverses qualités de rayonnement, en utilisant des protons, des ions He2+ et C6+ de différentes énergies allant de 500 MeV à 150 keV par nucléon. La diminution de l’énergie incidente des particules ou, de manière équivalente, l’augmentation du transfert d’énergie linéaire (TEL) du rayonnement produit une diminution notable de G(Fe3+), comme prévu par la théorie des structures de trajectoires. Cependant, lorsque la cystamine en concentration 1 M est ajoutée aux solutions, on observe une diminution spectaculaire de G(Fe3+), ce qui reflète clairement l’efficacité radioprotectrice de ce composé. Cette diminution dépend cependant beaucoup de l'énergie des ions incidents : plus le TEL du rayonnement est élevé, plus l'efficacité radioprotectrice de la cystamine est faible.
Mots clés: Radiolyse de l'eau, dosimètre de Fricke, protons, ions hélium et carbone, transfert d’énergie linéaire (TEL), schéma réactionnel, cinétique de compétition, radioprotecteur, cystamine, rendement radiolytique (valeur G), simulations Monte Carlo, structure et chimie des trajectoires, hadronthérapie.
S
UMMARYEVALUATION OF THE RADIOPROTECTIVE ABILITY OF CYSTAMINE AS A FUNCTION OF RADIATION QUALITY USING MONTE CARLO SIMULATIONS
OF THE RADIOLYSIS OF THE FRICKE DOSIMETER By
Esteban SEPULVEDA
Département de médecine nucléaire et radiobiologie
Thesis presented at the Faculty of Medicine and Health Sciences in order to obtain the Master degree of Sciences (M.Sc.) in Radiation Sciences and Biomedical Imaging, Faculty of Medicine and Health Sciences, Université de Sherbrooke, Sherbrooke, Québec, Canada,
J1H 5N4
Currently, radiation protection plays a fundamental role in many applications, including aerospace engineering, nuclear accidents or possible nuclear/radiological terrorism, military radiobiology, and clinical radiation oncology. Cystamine, the disulfide form of cysteamine – an aminothiol of the same family, is a compound most known for its radioprotective potential in the clinic during procedures of radiotherapy or in case of risk o f overexposure in patients. A convenient manner to evaluate its radioprotective efficiency consists in using the ferrous sulfate (Fricke) dosimeter in combination with Monte Carlo simulations. The well-known radiolysis of the Fricke dosimeter, based on the oxidation of ferrous ions to ferric ions by the oxidizing species •OH, HO
2•, and H2O2 produced by the radiolytic
decomposition of acid water in aerated solutions, forms the basis of our method. The presence of cystamine in Fricke dosimeter solutions during irradiation prevents the radiolytic oxidation of Fe2+ and leads to decreased ferric ion yields (or G-values). Results
clearly indicate that the protective effect of cystamine originates from its radical-capturing ability, which allows this compound to act by competing with the Fe2+ ions for the various free radicals formed during irradiation of the surrounding water. An impressive agreement is found between calculated G(Fe3+) values and experiment. Using our simulation modeling, the evaluation of the radioprotective efficiency of cystamine has been performed for various radiation qualities, using irradiating protons, helium and carbon ions of different energies ranging from 500 MeV to 150 keV per nucleon. Decreasing the incident energy of the ion or equivalently, increasing the linear energy transfer (LET) of the radiation, produces a noticeable decrease in G(Fe3+), as expected from the track structure theory. However, when 1 M cystamine is added to the solutions, we observe a dramatic decrease in G(Fe3+), which clearly reflects the radioprotective efficiency of this compound. This decrease very much depends upon the energy of the ion used; the higher the LET of the radiation, the lower the radioprotective efficiency of cystamine.
Keywords: Water radiolysis, aerated ferrous sulfate (Fricke) dosimeter, high-energy irradiating protons, helium and carbon ions, linear energy transfer (LET), reaction scheme, competition kinetics, antioxidant, radioprotector, cystamine, radiolytic yield (G value), Monte Carlo track chemistry simulations, hadrontherapy.
T
ABLE OF CONTENTSRésumé ...ii
Summary ...iii
Table of contents ...iv
List of figures ...v
List of tables... xii
List of abbreviations ... xiii
1. Introduction ...1
2. Research objectives...9
3. Radiolysis of water ...12
3.1 The “physical” stage ... 14
3.2 The “physicochemical” stage ... 19
3.3 The “chemical” stage ... 23
4. The ferrous sulfate (or Fricke) dosimeter...26
5. Monte Carlo track chemistry simulations ...29
6. Article...37
Evaluation of the radioprotective ability of cystamine for 150 keV-500 MeV proton rradiation: a Monte Carlo track chemistry simulation study. ... 37
Authors: Esteban Sepulveda, Sunuchakan Sanguanmith, Jintana Meesungnoen and Jean-Paul Jay-Gerin ... 37
Status: Canadian Journal of Chemistry: Accepted (September 23, 2018) ... 37
7. Discussion ...87
7.1 The effect of LET on the yield of the Fricke dosimeter ... 87
7.2 Influence of added cystamine on the Fricke yield under helium and carbon ion irradiation... 90
7.3 Influence of LET on the protective effect of cystamine under helium and carbon ion irradiation... 93
9. Acknowledgements ...100
L
IST OF FIGURESChapter 1: Introduction
Figure 1.1 – Relative dose in percentage as a function of the depth from the surface of the body of the patient in cm (MEDICAL EXCELLENCE JAPAN, 2018)……...2
Figure 1.2 – Relative biological effectiveness and oxygen enhancement ratio for -rays, protons, negative pions, fast neutrons, helium, carbon, neon, silicon and argon ions (MEDICAL EXCELLENCE JAPAN, 2018)……….4
Figure 1.3 – Applicable and inapplicable cancer treatments using heavy ion therapy (MEDICAL EXCELLENCE JAPAN, 2018)………5
Figure 1.4 – Process of heavy-ion therapy using carbon ions (MEDICAL EXCELLENCE JAPAN, 2018)………6
Figure 1.5 – Location of various cancer centres with proton and heavy-ion therapy around the world. With a total amount of five accelerators, nowadays Japan is the country with the highest number of heavy-ion therapy centers (MEDICAL EXCELLENCE JAPAN, 2018)……….6 Chapter 2: Research objectives
Figure 2.1 – Chemical structure of cystamine ……….10 Chapter 3: Radiolysis of water
Figure 3.1 – Time scale of events that occur in the radiolysis of pure, deaerated water (MEESUNGNOEN & JAY-GERIN, 2011). As a guide to the eyes, we use different colors in the figure in order to contrast the individual processes occurring during the radiolysis of water ……….13
Figure 3.2 – Classification of energy deposition events in water by track structure entities so-called spurs (spherical entities, up to 100 eV), blobs (spherical or ellipsoidal, 100-500 eV), and short tracks (cylindrical, 500 eV-5 keV) for a primary high-energy electron (not to scale). Short and branch tracks are described as -rays. From BURTON (1969), with permission………...16
Figure 3.3 – Projections into the XY-plane of figure of track segments of 300 (a) and 0.15 (b) MeV protons (LET ~ 0.3 and 70 keV/m, respectively) incident on liquid water at 25 °C (KANIKE et al., 2015). The two irradiating protons are
generated at the origin and start moving along the Y axis. Dots represent the energy deposited at points where an interaction occurred ………...…...17
Figure 3.4 – Primary energy-loss events in high-LET radiation tracks (FERRADINI, 1979)………17 Figure 3.5 – Projections over the XY-plane of track segments calculated (at ~10-13 s) using
Monte Carlo simulations for (a) H+ (0.15 MeV), (b) 4He2+ (1.75 MeV/nucleon), (c) 12C6+ (25.5 MeV/nucleon), and (d) 20Ne10+ (97.5 MeV/nucleon) impacting ions. Ions are generated at the origin and along the Y axis in liquid water under identical LET conditions (~70 keV/μm). Dots represent the energy deposited at points where an interaction occurred. From MUROYA et al. (2006), with permission………18 Chapter 4: The ferrous sulfate (or Fricke) dosimeter
Chapter 5: Monte Carlo track chemistry simulations
Figure 5.1 – Diagram of the Monte Carlo computer program developed by the group in radiation chemistry of the Université de Sherbrooke and used in the present study……….31 Chapter 6: Article
Figure 1 – Time evolution of G(Fe3+) (in molecule/100 eV) from our Monte Carlo simulations of the radiolysis of Fricke dosimeter solutions (1 mM FeSO4 in
aerated aqueous 0.4 M H2SO4) with various concentrations of cystamine,
using 150-keV incident protons (LET ~ 72.2 keV/m) at 25 °C. The different lines correspond to three different cystamine concentrations (indicated to the right of the figure): 10-3 M (dash-dot line), 10-2 M (dotted line), and 0.1 M (dashed line). For reference, the solid line shows our simulated kinetics of Fe3+ ion formation for the Fricke dosimeter without added cystamine under the same irradiation conditions………77 Figure 2 – Time evolution of G(Fe3+) (in molecule/100 eV) from our Monte Carlo
simulations of the radiolysis of Fricke dosimeter solutions (1 mM FeSO4 in
aerated aqueous 0.4 M H2SO4) containing various concentrations of
cystamine, using 500-MeV incident protons (LET ~ 0.23 keV/m) at 25 °C. The different lines correspond to four different cystamine concentrations (indicated to the right of the figure): 10-4 M (dash-dot-dot line), 10-3 M (dash-dot line), 10-2 M (dotted line), and 0.1 M (dashed line). For reference, the solid line shows our simulated kinetics of Fe3+ ion formation for the Fricke
dosimeter without added cystamine under the same irradiation conditions……….78 Figure 3 – Variation of ferric ion yield (in molecule/100 eV) from our Monte Carlo
simulations (~200 s after ionization) of the radiolysis of Fricke/cystamine solutions (1 mM FeSO4 in aerated aqueous 0.4 M H2SO4) with cystamine
concentration in the range ~5 × 10⁻⁷-0.1 M, using 500-MeV (solid line) and 150-keV (dashed line) irradiating protons (LET ~ 0.23 and 72.2 keV/m, respectively) at 25 °C. The symbols correspond to experimental Fe3+ ion yield data obtained by different authors for 250-kVp X-ray [(●) ref. 29 and
60Co -ray (▲) ref. 30 and (□) ref. 32 irradiations. There is a very good
agreement between the results of the simulations using the low-LET 500-MeV incident protons and the experimental yields of Fe3+ obtained for X- and -irradiations. Unfortunately, in the case of high-LET 150-keV irradiating protons, there are no experimental data available in the literature with which to compare our results………..79 Figure 4 – Panel a: Time evolution of G(Fe3+) (in molecule/100 eV) for 150-keV incident
protons (LET ~ 72.2 keV/m) in the radiolysis of aerated Fricke dosimeter solutions containing 1 mM FeSO4 and 1 mM cystamine in aqueous 0.4 M
H2SO4 at 25 °C. The concentration of dissolved oxygen used in the
calculations is 0.25 mM. The solid line shows our simulated kinetics of Fe3+
ion formation.
Panel b: Time dependence of the extents ΔG(Fe3+) (in molecule/100 eV) of the different reactions that contribute to the formation of Fe3+ ions, calculated
from our Monte Carlo simulations in the interval ~10-10-200 s. The oxidation of Fe2+ ions to Fe3+ involves reactions mainly with HO2•, H2O2, and the
cystamine-radical species RS• and RSSR•+ (see text)………..80 Figure 5 – Panel a: Time evolution of G(Fe3+) (in molecule/100 eV) for 500-MeV incident
protons (LET ~ 0.23 keV/m) in the radiolysis of aerated Fricke solutions containing 1 mM FeSO4 and 1 mM cystamine in aqueous 0.4 M H2SO4 at 25
°C. The concentration of dissolved oxygen used in the calculations is 0.25 mM. The solid line shows our simulated kinetics of Fe3+ ion formation.
Panel b: Time dependence of the extents ΔG(Fe3+) (in molecule/100 eV) of the different reactions that contribute to the formation of Fe3+ ions, calculated
from our Monte-Carlo simulations in the interval ~10-10-200 s. The oxidation of Fe2+ ions to Fe3+ involves reactions mainly with HO2•, H2O2, and the
Figure 6 – Time dependence of the extents G(RSSR) (in molecule/100 eV) of the various reactions that contribute to the formation and decay of cystamine (RSSR) (see text), calculated from our Monte-Carlo simulations of the radiolysis of aerated Fricke solutions (1 mM FeSO4 and 1 mM cystamine in aqueous 0.4 M H2SO4)
by 500-MeV (LET ~ 0.23 keV/m) (panel a) and 150-keV (LET ~ 72.2 keV/m) (panel b) incident protons at 25 °C and in the interval ~10-10-200
s………82 Figure 7 – Plot of the ferric ion yield G(Fe3+) (in molecule/100 eV) from the proton radiolysis of air-saturated Fricke solutions (1 mM FeSO4 in aqueous 0.4 M
H2SO4) without cystamine addition, as a function of LET in the range of
~0.2-75 keV/m at 25 °C. The solid curve shows the values of G(Fe3+) obtained from our Monte Carlo simulations (at ~200 s after ionization) using irradiating protons of various initial energies between ~500 MeV and 150 keV. The dashed curve shows results of ref. 48 for oxidation of ferrous sulfate by protons for LET varying from ~0.3 to 15 keV/m Experiment: ( ) ref. 76, ( ) ref. 77, ( ) ref. 78, () ref. 79, () ref. 80, (☆) ref. 81, (∆) ref. 82, and ( ) ref. 83. For the sake of completeness, experimental G(Fe3+) values determined at low LET for a number of X-, - and -rays of a wide range of energy are also shown in the figure: (), ref. 84 and () refs. 44 and 45. Finally, the arrow on the left of the figure shows the accepted value (15.5 ± 0.2 molecules/100 eV) of the yield of the (aerated) Fricke dosimeter for 60Co -rays or fast electrons……….83 Figure 8 – Effect of LET on the ferric ion yield (in molecule/100 eV) as obtained from our
Monte Carlo simulations (at ~200 s following ionization) of the radiolysis of (aerated) Fricke/cystamine solutions (1 mM FeSO4 in aerated aqueous 0.4 M
H2SO4) containing various concentrations of cystamine, using irradiating
protons in the range of 500 MeV-150 keV, at 25 °C. The concentration of dissolved oxygen used in the calculations is 0.25 mM. The different lines correspond to four different cystamine concentrations: 10-3 M (dashed line), 10-2 M (short dashed line), 0.1 M (dotted line), and 1 M (short dotted line). The solid line shows our results for the Fricke dosimeter without added cystamine under the same irradiation conditions……….84 Figure 9 – Time dependence of the extents G(Fe3+) (in molecule/100 eV) of the various
reactions that contribute to the formation of Fe3+ ions (see text), calculated
from our Monte Carlo simulations of the radiolysis of aerated Fricke solutions (1 mM FeSO4 in aqueous 0.4 M H2SO4) with various concentrations of
500-MeV incident protons (LET ~ 0.23 keV/m) at 25 °C in the interval 10-10-200 s. The concentration of dissolved oxygen used in the calculations is 0.25 mM. It can be clearly seen that the formation of ferric ions mainly results from the reactions of Fe2+ with HO2•, H2O2, and the cystamine-radicals RS• and RSSR•+
at 0.01 M cystamine. However, with increasing cystamine concentration, the contribution of these different reactions to the formation of Fe3+ decreases sharply in favor of the reaction of Fe2+ with the peroxyl radical ROO•, which largely dominates at 1 M cystamine……….85 Figure 10 – Time evolution of the yields G(X) (in molecule/100 eV) of all reactive species
(X) involved in the radiolysis of aerated Fricke dosimeter solutions (1 mM FeSO4 in aqueous 0.4 M H2SO4) with 1 M cystamine, as obtained from our
Monte Carlo simulations for 500-MeV irradiating protons (LET ~ 0.23 keV/m) at 25 °C and in the interval ~10-12-200 s. For clarity, G(RSSR•+) and G(HO2•) are not shown in the figure as they are very small over the considered
time interval. The concentration of dissolved oxygen used in the calculations is 0.25 mM………...86 Chapter 7: Discussion
Figure 7.1 – Plot of the ferric ion yield G(Fe3+) (in molecule/100 eV) of the radiolysis of aerated Fricke solutions (1 mM FeSO4 in aqueous 0.4 M H2SO4) with no
cystamine addition as a function of LET (in keV/m), at 25 °C. The solid lines show the values of G(Fe3+) obtained from our Monte Carlo simulations (at ~200 s after ionization) using incident protons (green), 4He2+ (blue) and
12C6+ (red) ions of various initial energies between ~500 MeV and 150 keV
per nucleon. Experiment: ( ) HARDWICK (1952a, b), ALLEN (1954); ( ) HART (1954), McDONELL & HART (1954); ( ) DONALDSON & MILLER (1955); ( ) HART et al. (1956); ( ) HAYBITTLE et al. (1956); (
) SCHULER & ALLEN (1956, 1957); ( ) SCHULER & BARR (1956), BARR & SCHULER (1959); ( ) BACK & MILLER (1957); ( ) LEFORT (1957, 1958); ( ) GEVANTMAN & PESTANER (1959); ( ) COATSWORTH et al. (1960); ( ) PEISACH & STEYN (1960); ( ) ANDERSON & HART (1961); ( ) PUCHEAULT (1961); ( ) SHALEK et al. (1962); ( ) DAVIES et al. (1963); ( ) FREGENE (1967); ( ) MARIANO & SANTOS (1967); ( ) ICRU REPORT 17 (1970); ( ) IMAMURA et al. (1970); ( ) MATSUI et al. (1970); ( ) JULIEN & PUCHEAULT (1972); ( ) SAUER et al. (1978); ( ) ICRU REPORT 34 (1982); LAVERNE & SCHULER (1996): data for carbon ions ( ) and for helium ions (); ( ) ELLIOT et al. (1996)……….88
Figure 7.2 – Time evolution of G(Fe3+) (in molecule/100 eV) as obtained from our Monte Carlo simulations of the radiolysis of aerated Fricke dosimeter solutions containing 1mM FeSO4 in aqueous 0.4 M H2SO4 at 25 °C, for incident 8 MeV 4He2+ (red solid line) and 360 MeV 12C6+ (blue solid line) ions, that is, under
the same LET conditions (~64 keV/m). The concentration of dissolved oxygen used in the calculations is 0.25 mM. As we can see, G(Fe3+) is greater for the higher-Z ion.
Figure 7.3 – Time evolution of G(Fe3+) (in molecule/100 eV) as obtained from our Monte Carlo simulations of the radiolysis of aerated Fricke dosimeter solutions (1 mM FeSO4 in aqueous 0.4 M H2SO4) containing various concentrations of
cystamine, using 8 MeV irradiating 4He2+ ions (LET ~ 64.2 keV/m) at 25 °C. The different lines correspond to four different cystamine concentrations, indicated to the right of the figure: 10-3 M (orange solid line), 10-2 M (blue
solid line), 10-1 M (red solid line) and 1 M (cyan solid line). For reference, the black dashed line shows our simulated kinetics of Fe3+ formation for the normal Fricke dosimeter with no added cystamine under the same irradiation conditions. The concentration of dissolved O2 used in the calculations is 0.25
mM………...91
Figure 7.4 – Time evolution of G(Fe3+) (in molecule/100 eV) as obtained from our Monte Carlo simulations of the radiolysis of aerated Fricke dosimeter solutions (1 mM FeSO4 in aqueous 0.4 M H2SO4) containing various concentrations of
cystamine, using 360 MeV irradiating 12C6+ ions (LET ~ 64.4 keV/m), at 25 °C. The different lines correspond to four cystamine concentrations, indicated to the right of the figure: 10-3 M (orange solid line), 10-2 M (blue solid line), 10-1 M (red solid line) and 1 M (cyan solid line). For reference, the black dashed line shows our simulated kinetics of Fe3+ formation for the Fricke
dosimeter with no added cystamine under the same irradiation conditions. The concentration of dissolved O2 used in the calculations is 0.25 mM…….92 Figure 7.5 – Effect of LET on the ferric ion yield (in molecule/100 eV) as obtained from
our Monte Carlo simulations (at ~200 s following ionization) of the radiolysis of Fricke/cystamine solutions (1 mM FeSO4 in aerated aqueous 0.4 M H2SO4)
containing various concentrations of cystamine, using irradiating 4He2+ ions in the LET range of ~1-105 keV/m (or in the energy range of ~500-1 MeV/nucleon), at 25 °C. The concentration of dissolved O2 used in the
calculations is 0.25 mM. The different lines correspond to four different cystamine concentrations: 10-3 M (green solid line), 10-2 M (cyan solid line), 0.1 M (red solid line), and 1 M (blue solid line). For reference, the black
dashed line shows our results for the Fricke dosimeter with no added cystamine under the same irradiation conditions……….93
Figure 7.6 – Effect of LET on the ferric ion yield (in molecule/100 eV) as obtained from our Monte Carlo simulations (at ~200 s following ionization) of the radio lysis of Fricke/cystamine solutions (1 mM FeSO4 in aerated aqueous 0.4 M H2SO4)
containing various concentrations of cystamine, using irradiating 12C6+ ions in the LET range of ~10-400 keV/m (or in the energy range of ~500-3 MeV/nucleon), at 25 °C. The concentration of dissolved O2 used in the
calculations is 0.25 mM. The different lines correspond to four different cystamine concentrations: 10-3 M (green solid line), 10-2 M (cyan solid line), 0.1 M (red solid line), and 1 M (blue solid line). For reference, the black dashed line shows our results for the Fricke dosimeter with no added cystamine under the same irradiation conditions……….94
Figure 7.7 – Dependence of ferric ion production from irradiated Fricke/cystamine solutions (1 mM FeSO4 in aerated aqueous 0.4 M H2SO4) upon the
concentration of added cystamine in the range of 10-5-1 M using irradiating 4He2+ ions. The different lines show the Fe3+ ion yields (in molecule/100 eV)
obtained from our Monte Carlo simulations (at ~200 s following ionization) for three different LET values (in keV/m): ~1.4 (300 MeV/nucleon, red line), ~4 (70 MeV/nucleon, blue line), and ~104 (1 MeV/nucleon, black line), at 25 °C. The concentration of dissolved O2 used in the calculations is 0.25
mM………...95
Figure 7.8 – Dependence of ferric ion production from irradiated Fricke/cystamine solutions (1 mM FeSO4 in aerated aqueous 0.4 M H2SO4) upon the
concentration of added cystamine in the range of 10-5-1 M using irradiating
12C6+ ions. The different lines show the Fe3+ ion yields (in molecule/100 eV)
obtained from our Monte Carlo simulations (at ~200 s following ionization) for three different LET values (in keV/m): ~12.8 (300 MeV/nucleon, red line), ~33.6 (70 MeV/nucleon, blue line), and ~330 (4 MeV/nucleon, black line), at 25 °C. The concentration of dissolved O2 used in the calculations is
L
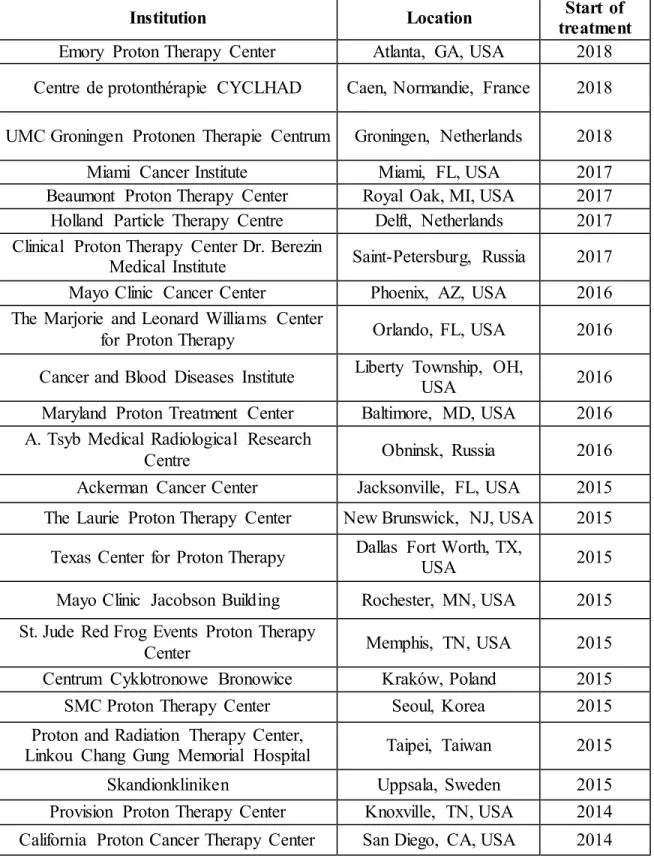
IST OF TABLESTable 1.1 – Cancer centres around the world with proton or heavy-ion therapy facilities in a chronological order from 2018 to 1984 (PARTICLE THERAPY COOPERATIVE GROUP, 2018)…...………...7
Table 3.1 – Main reaction scheme and rate constants (k) in the radiolysis of liquid water at 25 °C (MEESUNGNOEN & JAY-GERIN, 2011; ELLIOT & BARTELS, 2009)………24
Table 5.1 – Reactions added to the pure water reaction scheme to simulate the radiolysis of aqueous H2SO4 solutions, at 25 °C (AUTSAVAPROMPORN et al., 2012). The
rate constants given here for the reactions between ions are in the limit of zero ionic strength (i.e., at infinite dilution of ions).………..32
Table 5.2 – Chemical reactions and rate constants used in simulations of the radiolysis of cystamine (RSSR) in the Fricke dosimeter in the presence of oxygen, at 25 °C (MEESAT et al., 2012). The rate constants quoted here for the reactions between ions are in the limit of zero ionic strength………...33
L
IST OF ABBREVIATIONSDNA Deoxyribonucleic acid
e-aq Hydrated electron
eV Electron-volt
GX or g(X) Primary yield of the radiolytic species X
G(X) Experimental yield of the final product X
Gy Gray
IRT Independent reaction times
k Reaction rate constant
LET Linear energy transfer
keV Kilo-electron-volts MeV Mega-electron-volts µm Micrometer s Microsecond ns Nanosecond ps Picosecond
pH -log10 H+, where the square brackets denote concentration
RBE Relative biological effectiveness
1.
I
NTRODUCTIONFor decades, medical physicists and doctors have been fighting cancer; in 2018, radiotherapy is the most effective technic to treat this disease (BASKAR et al., 2012; MILLER et al., 1981). On average, 50% of cancer patients will receive radiation, either for curative or palliative purposes. Currently in Canada, one out of two persons will develop cancer at some time during their life. Moreover, 50% of these diagnosed patients will develop at least one metastasis in the brain. Therefore, the treatment for those patients should be precise and highly accurate. Nowadays, researchers in radiotherapy and chemotherapy are enhancing and refining conventional technics. These new improvements in radiation therapy come along with new technics that allow better irradiation procedures and optimum treatments (NAIR et al., 2001).
The conventional methods used in clinical radiotherapy show significant weaknesses for the health of the patient; some of those disadvantages and how other new alternative methods can solve those problems are briefly summarized below (JEMAL et al., 2011; LIU et al., 2001; MARRETT et al,. 2008; TORRE et al., 2015).
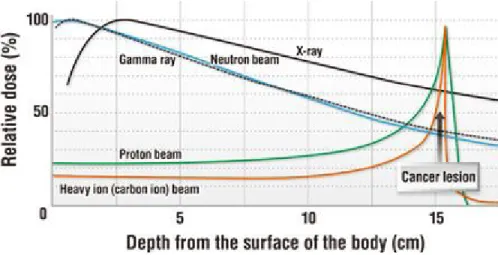
In general, nowadays there are five different radiotherapy techniques used to treat tumors in human beings: photon (- and X-rays)-based therapy, neutron therapy, proton therapy and heavy ion therapy (note that, when the irradiating beams are made of charged particles – protons and other ions, such as carbon – radiation therapy is called “hadrontherapy”). These techniques all deposit energy in a different way, which represents either an advantage or a disadvantage for the treatment. Figure 1.1 shows the depth-dose profiles for all the different types of radiation mentioned before (DURANTE & LOEFFLER, 2010; KRÄMER et al., 2000; HALL & GIACCIA, 2006). As can be seen, the Bragg peak for proton and heavy ion therapies is immensely localised, which means that the energy is deposited within the wished volume. This is a great benefit in cancer treatment because it provides a more precise treatment and more importantly, the irradiation in healthy tissue is very low. In other words, one the biggest problems in conventional radiotherapies is the fact that irradiation in surrounded tissues can lead to secondary cancers or damage in vital organs; using any of the advanced medical
technologies of hadrontherapy mentioned above, the irradiation in healthy organs is lower than using standard treatments (MEDICAL EXCELLENCE JAPAN, 2018).
Figure 1.1 – Relative dose in percentage as a function of the depth from the surface of the body of the patient in cm (MEDICAL EXCELLENCE JAPAN, 2018).
As an example, the comparison between two different techniques: conventional radiotherapy (X-rays) and modern radiotherapy (heavy ions) is useful to understand the significant difference between both technologies. The dose deposition using X-rays is mostly on the surface of the body decreasing relatively slowly with depth, whilst the deposition of energy using carbon ions is acutely localized at the tumor site, falling to zero after the Bragg peak and with a low irradiation on the surface. Additionally, for conventional radiotherapy, the energy deposition is not only on the pathway before reaching a tumor, but also, it is likely to measure some dose in the tissue located after the lesion. In contrast, using carbon ion therapy guaranties a low irradiation in organs before and after a tumor in comparison with standard treatments (NODA et al., 2006, 2007).
Although both methods show remarkable results, there are a few discrepancies in the mode they perform and the applicability of these techniques. To discuss these variations it is important to clarify two relevant concepts in medical physics and radiobiology: “relative biological effectiveness” (RBE) and “oxygen enhancement ratio” (OER).
The relative biological effectiveness, on the one hand, refers to the possibility of certain types of radiation to induce a biological damage in the irradiated cells. Although the dose is vital, in radiobiology it is more important to observe the real damage of a given dose in the tissue. The relation between the numerical physical dose and the cell damage is called the relative biological effectiveness. More precisely, the RBE is defined as the ratio of the doses of high-energy photons (e.g., 60Co -rays) and charged particles required for equal biological effect (ELSÄSSER et al., 2010; PAGANETTI et al., 2002; STORER et al., 1957; SUZUKI et al., 2000).
On the other hand, the availability of oxygen (O2) is of vital importance to the
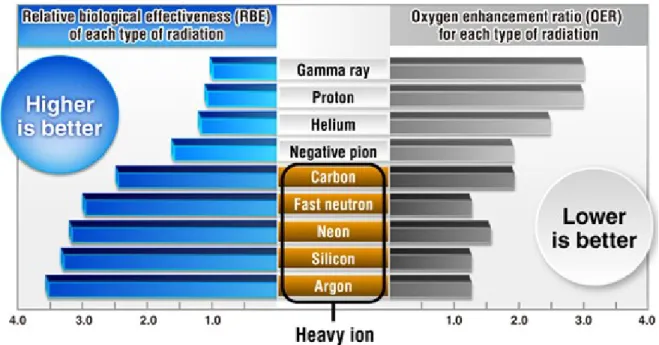
radiosensitivity of a cell; well-oxygenated cells respond better to radiotherapy than tumors with extensive hypoxia (GRAY et al., 1953). This relative boosting effect of oxygen on cell-kill is quantified by the oxygen enhancement ratio, which is defined as the ratio of the dose required to produce a given effect in the absence of oxygen to that dose required to achieve the same effect under fully oxygenated conditions. In other words, the use of a radiation type with a low oxygen enhancement ratio will definitely increase the probability of full remission of a patient after treatment. Figure 1.2 shows various types of radiation used in cancer treatments and their respective RBE and OER values (PALCIC & SKARSGARD, 1984; WENZL & WILKENS, 2011). As can be seen, the OER decreases with increasing LET clearly suggesting a potential clinical advantage of high-LET radiotherapy with heavy ion beams compared to low-LET photon or proton irradiation. In fact, for instance, it has been proved today that carbon-ion radiotherapy is significantly more effective in the treatment of radioresistant cancers (e.g., malignant melanoma or colorectal cancers) than conventional photon radiotherapy or even proton therapy. In spite of the high cost of the installations necessary for the production of these ions, carbon-ion radiotherapy looks increasingly appealing as a cancer treatment modality (EBNER & KAMADA, 2016).
Figure 1.2 – Relative biological effectiveness and oxygen enhancement ratio for -rays, protons, negative pions, fast neutrons, helium, carbon, neon, silicon and argon ions (MEDICAL EXCELLENCE JAPAN, 2018).
Figure 1.3 shows all the diverse forms of treatments in which heavy-ion therapy can be used. As it is seen, despite its wide range of applications in solid tumors, this practice is not appropriate for cancers with extensive metastases or blood cancers (BRAHME et al., 1989; ENGHARDT et al., 1999; HAMADA et al., 2010; JÄKEL et al., 2003; KRÄMER et al., 2000; NIKOGHOSYAN et al., 2004; SCHARDT et al., 2010).
Figure 1.3 – Applicable and inapplicable cancer treatments using heavy-ion therapy (MEDICAL EXCELLENCE JAPAN, 2018).
During a treatment with carbon ion therapy, the depth of the depositio n of energy is controlled by the energy of the carbon ion, which can reach up to 70% of the light speed (Fig. 1.5). This energy is delivered precisely to the tumor, taking advantage of the Bragg peak effect, providing less damage to surrounding healthy tissue than with other conventional techniques. Carbon therapy increases the biological efficiency of the dose by a factor between 1.5 and 3 in comparison with conventional photon-based methods (ANDO & KASE, 2009; BLAKELY & KRONENBERG, 1998; KOMATSU et al., 2011; PARODI et al., 2012; SCHOLZ et al., 1997; SCHULZ-ERTNER & TSUJII, 2007).
Figure 1.4 – Process of heavy-ion therapy using carbon ions (MEDICAL EXCELLENCE JAPAN, 2018).
Heavy-ion therapy shows magnificent results in cancer treatment, such as low pain, suitable for elderly patients, curative in an early stage of development of the disease, effective on X-rays resistant tumors and feasibility of short-course therapy. Presently, there is a number of cancer centres with these facilities. Figure 1.5 and Table 1.1 show the location and year of first treatment of proton and heavy ion accelerators around the world (GLIMELIUS et al., 2005; KAMADA et al., 2015; OLSEN et al., 2007; SUIT, 2003).
Figure 1.5 – Location of various cancer centres with proton and heavy-ion therapy around the world. With a total amount of five accelerators, nowadays Japan is the country with the highest number of heavy-ion therapy centers (MEDICAL EXCELLENCE JAPAN, 2018).
Table 1.1 – Cancer centres around the world with proton or heavy-ion therapy facilities in a chronological order from 2018 to 1984 (PARTICLE THERAPY CO-OPERATIVE GROUP, 2018).
Institution Location Start of
treatment Emory Proton Therapy Center Atlanta, GA, USA 2018 Centre de protonthérapie CYCLHAD Caen, Normandie, France 2018 UMC Groningen Protonen Therapie Centrum Groningen, Netherlands 2018
Miami Cancer Institute Miami, FL, USA 2017
Beaumont Proton Therapy Center Royal Oak, MI, USA 2017 Holland Particle Therapy Centre Delft, Netherlands 2017 Clinical Proton Therapy Center Dr. Berezin
Medical Institute Saint-Petersburg, Russia 2017 Mayo Clinic Cancer Center Phoenix, AZ, USA 2016 The Marjorie and Leonard Williams Center
for Proton Therapy Orlando, FL, USA 2016
Cancer and Blood Diseases Institute Liberty Township, OH, USA 2016 Maryland Proton Treatment Center Baltimore, MD, USA 2016 A. Tsyb Medical Radiological Research
Centre Obninsk, Russia 2016
Ackerman Cancer Center Jacksonville, FL, USA 2015 The Laurie Proton Therapy Center New Brunswick, NJ, USA 2015 Texas Center for Proton Therapy Dallas Fort Worth, TX, USA 2015 Mayo Clinic Jacobson Building Rochester, MN, USA 2015 St. Jude Red Frog Events Proton Therapy
Center Memphis, TN, USA 2015
Centrum Cyklotronowe Bronowice Kraków, Poland 2015
SMC Proton Therapy Center Seoul, Korea 2015
Proton and Radiation Therapy Center,
Linkou Chang Gung Memorial Hospital Taipei, Taiwan 2015
Skandionkliniken Uppsala, Sweden 2015
Provision Proton Therapy Center Knoxville, TN, USA 2014 California Proton Cancer Therapy Center San Diego, CA, USA 2014
Institution Location treatment Start of Centro per la protonterapia Trento, Italy 2014
PTC Uniklinikum Dresden, Germany 2014
Shanghai Proton and Heavy Ion Center Shanghai, China 2014 SCCA Proton Therapy Center Seattle, WA, USA 2013 Siteman Cancer Center St. Louis, MO, USA 2013 Westdeutsches Protonentherapiezentrum Essen, Germany 2013 ProCure Proton Therapy Center Somerset, NJ, USA 2012 Roberts Proton Therapy Center Philadelphia, PA, USA 2010 Hampton UniversityProton Therapy Institute Hampton, VA, USA 2010 ProCure Proton Therapy Center of Oklahoma Oklahoma City, OK, USA 2009 Heidelberg Ion-Beam Therapy Center Heidelberg, Germany 2009 Rinecker Proton Therapy Center Munich, Germany 2009 Proton Therapy Center, Korea National
Cancer Center Seoul, Korea 2007
University of Florida Health Proton Therapy
Institute-Jacksonville Jacksonville, FL, USA 2006 University of Texas MD Anderson Cancer
Center Houston, TX, USA 2006
Wanjie Proton Therapy Center Zibo, China 2004
Centro di adroterapia oculare Catania, Italy 2002 Francis H. Burr Proton Center Boston, MA, USA 2001 Proton Medical Research Center University
of Tsukuba Tsukuba, Japan 2001
Helmholtz-Zentrum Berlin Berlin, Germany 1998
TRIUMF Vancouver, Canada 1995
Crocker Nuclear Laboratory Davis, CA, USA 1994
Research Center for Charged Particle
Therapy Chiba, Japan 1994
Centre de protonthérapie de l'Institut Curie Orsay, France 1991
Centre Antoine Lacassagne Nice, France 1991
Loma Linda University Medical Center Loma Linda, CA, USA 1990 Clatterbridge Cancer Centre NHS
Foundation Trust
Liverpool, United
Kingdom 1989
2.
R
ESEARCH OBJECTIVESAlthough the main objective of the radiation therapy of cancer is to induce tumor cell death, there are still healthy cells irradiated around the main target and, as well, along the pathway of the radiation to reach the target. Clearly, in order to obtain better tumor control with a higher dose, the normal tissues should be protected. Consequently, during the last decades, much work has been done on creating and probing different radiation protectors and sensitizers to minimize this problem. A radioprotector, as its name says, protects the surrounded normal tissues from the radiation whilst radiosensitizers increase the radiosensibility of a tumor. In general, radiation modifiers play a critical role in radiotherapy and cancer treatment (MEESAT et al., 2009; NAIR et al., 2001; WARDMAN, 2007).
As human cells contain roughly 80% water, there is a significant irradiation of water molecules generating free radicals such as the hydrated electron (e
aq), the hydroxyl
radical (•OH), the hydrogen atom (H•), and so on. These free radicals can lead to damages to DNA, RNA, proteins and cell membranes that can cause the death of the cell. Free radicals may attack healthy tissue as well as a tumor; therefore, scientists search to find the possibility to protect healthy tissues from those free radicals with, of course, a preferential protection of normal tissues vs. tumors (BUMP & MALAKER, 1998; LEVIN et al., 2005; LOMAX et al., 2001; MIN et al., 2006; MUNZENRIDER & LIEBSCH, 1999; PAGANETTI, 2012; PEDRONI et al., 1995; SLATER et al., 2004).
By definition, free radicals contain at least one unpaired electron, which makes them highly reactive and thereby able to damage all macromolecules, including lipids, proteins and nucleic acids. The present work aims to examine, from a radiation chemistry point of view, the mechanistic basis for the protection exerted by some compounds, generally called antioxidants or radioprotectors, used to protect cellular components from free radical induced damage (BITZER et al., 2018; HALLIWELL, 1994; HALLIWELL & GUTTERIDGE, 2015; PREMARATNE et al, 2018; REINA & MARTÍNEZ, 2017; VALKO et al., 2007).
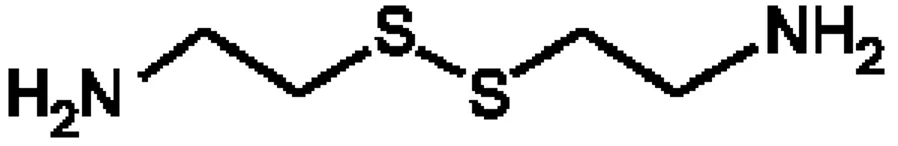
Currently, there is a wide range of radioprotectors studied by researchers in a number of laboratories, but, certainly, cystamine is among the most interesting ones due to its well-known high radioprotective effects in radiobiology (see Appendix, where we present a list of important radioprotector agents and their mechanisms of action, along with a brief history of their development). This compound comes from a chemical family, called thiols (which are analogous to alcohols but in which sulfur replaces the oxygen of the hydroxyl group), and its chemical structure can be represented as (JAYSON et al., 1967)
Figure 2.1 – Chemical structure of cystamine.
or, in abbreviated form, RSSR with R = NH2-CH2-CH2. Interestingly, it is the disulfide
form of cysteamine (or 2-aminoethanethiol, RSH), an organic aminothiol well known also for its radioprotective properties.
The chemistry of radiation modifiers is not fully understood nowadays. The present study defines, from a radiation chemistry perspective, the basis of how chemical (i.e., non-biologic) radioprotectors – such as cystamine – actually work at the molecular level. In cellular systems, these compounds are usually thought to exert their protective effects by a combination of different individual mechanisms that include free-radical scavenging and H• atom donation (BUMP & MALAKER, 1998; VON SONNTAG,
2006; HALL & GIACCIA, 2006). If the radiolysis water-produced reactive intermediates are scavenged by the protector agent before they can interact with vital cellular components (especially DNA), the damaging effect of radiation is reduced. Cytoprotection by radioprotective compounds containing sulfhydryl –SH groups (i.e., with labile hydrogen atoms) is also formulated in terms of H•-atom donation to chemically repair DNA damage (and restore it to its initial state), which would otherwise be fixed by oxygen (VON SONNTAG, 2006; WARDMAN, 2009). In this latter case, sulfhydryl compounds exert their protective activity by efficiently competing with
oxygen in reactions with key DNA free radicals (WARD, 1983), thereby reducing DNA damage and increasing cell survival.
More specifically, we study in this report the chemical action and the radical scavenging properties of cystamine using a model system developed previously combining the well-known aerated ferrous sulfate (Fricke) dosimeter with Monte Carlo track chemistry simulations (FRICKE & HART, 1966; JAYSON & WILBRAHAM, 1968; LALITHA & MITTAL, 1971; MEESAT et al., 2009, 2012). Benefiting from the fact that cystamine is reasonably well characterized in terms of radiation chemistry, this computer model proposes reaction mechanisms and incorporates specific reactions describing the radiolysis of cystamine in aerated Fricke solutions that lead to the observable quantitative chemical yields. As we know relatively little about protection against densely ionizing radiation, our specific aim here is to assess quantitatively the radioprotective ability of this compound as a function of the quality of the radiation (i.e., the radiation type and energy), using irradiating protons, and helium and carbon ions of different energies ranging from 500 MeV to 150 keV per nucleon.
3.
R
ADIOLYSIS OF WATERWater radiolysis is the dissociation of water molecules by ionizing radiation. The complex events that accompany the absorption of energetic radiations by water can usually be divided into three, more or less clearly demarcated, consecutive, temporal stages: physical, physicochemical, and chemical (PLATZMAN, 1958; KUPPERMANN, 1959; TIPPAYAMONTRI et al., 2009; MEESUNGNOEN & JAY-GERIN, 2011). During the first or “physical” stage, the energy deposition results in both ionizations and excitations leading to extremely unstable species that undergo fast reorganisation in the second or “physicochemical” stage. These processes produce free radical and molecular products of radiolysis that are distributed in a highly nonhomogeneous track structure, which depends on the type and energy of the radiation used. Secondary electrons slow down to sub-excitation energies and following thermalization, they become trapped (e
tr)
and hydrated (e
aq) (~10-12 s). The third or “chemical” stage consists of diffusion and
reactions of the reactive species (e
aq, H•, H2, •OH, H2O2, H+, OH, O2• (or its protonated
form HO2• depending on the pH; pKa = 4.8 in water at 25 °C, etc.) present at the end of
the physicochemical stage. We usually divide this stage into two parts. The first part corresponds to the stage of “nonhomogeneous chemistry” during which tracks develop in time (PLANTE et al., 2005; MUROYA et al., 2006). A number of radicals will combine to form the molecular products H2 and H2O2 and to re-form water, while the remainder
will diffuse out into the bulk solution. At room temperature, all intra-track reactions are essentially complete by ~10-7-10-6 s (BUXTON, 1987; SANGUANMITH et al., 2012). At this time, the species that have escaped from track reactions become homogeneously distributed throughout the bulk of the solution (i.e., the system at large). This is the second part of the chemical stage, the so-called stage of “homogeneous chemistry” that takes place beyond a few microseconds. The radical and molecular products that emerge from the tracks are then available for reaction with dissolved solutes (if any) present (in low or moderate concentrations) at the time of irradiation.
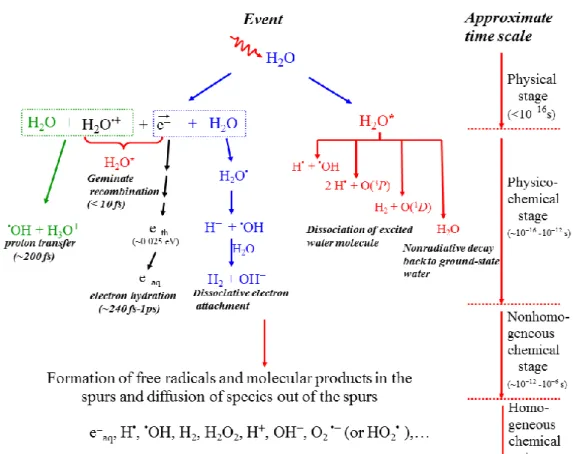
Figure 3.1 illustrates the time scale of the different stages of pure deaerated water radiolysis.
Figure 3.1 – Time scale of events that occur in the radiolysis of pure, deaerated water (MEESUNGNOEN & JAY-GERIN, 2011). As a guide to the eyes, we use different colors in the figure in order to contrast the individual processes occurring during the radiolysis of water.
In air-saturated solutions (where the concentration of dissolved oxygen in the water is ~0.25 mM at 25 °C), e
aq and H• atoms are rapidly converted (on a time scale of a
few tenths of a microsecond) to superoxide radical anion (O2•)/hydroperoxyl (HO2•)
radicals, according to: e
aq + O2 O2• k1 = 2.3 1010 M-1 s-1 1
H• + O2 HO2• k2 = 1.3 1010 M-1 s-1 2
where k1 and k2 are the rate constants for the two individual reactions (ELLIOT &
species at homogeneity include O2•, •OH, and H2O2. The other molecular product, H2, is
relatively inert and normally plays only a limited role in the radiolysis of aqueous solutions, most of it escaping from solution (SPINKS & WOODS, 1990).
Finally, in a physiologic system, there follows a “biological” stage in which the cells respond to the damage resulting from the products formed in the preceding stages (for a review on the subject, see: AZZAM et al., 2012).
3.1 The “physical” stage
The physical stage consists of the phenomena by which energy is transferred from the incident high-energy radiation to the water. Its duration is less than ~10-16 s. The result of this energy absorption is the production, along the path of the radiation, of a large number of ionized and electronically excited water molecules, denoted H2O•+ and
H2O*, respectively:
H2O H2O•+ + e (ionization) 3
H2O H2O* (excitation) 4
During this deposition of energy, ionization is the dominant scattering process. Note also that H2O* represents here many excited states, including the so-called
“superexcited” states (PLATZMAN, 1962a) and the excitations of collective electronic oscillations of the “plasmon” type (HELLER et al., 1974; KAPLAN & MITEREV, 1987; LAVERNE & MOZUMDER, 1993; WILSON et al., 2001).
Generally, the electron ejected in the ionization event has sufficient energy either to ionize or excite one or more other water molecules in the vicinity; this leads to the formation of track entities that contain the products of the events (see below).
The so-called “track structure” is determined by the distribution of the physical energy deposition events and their geometrical dispositions, or, in other words, by the radiation type and energy, a measure of which is given by the “linear energy transfer” or LET (ICRU REPORT 16, 1970). Two different radiation track structures are generally considered as a function of LET:
i) Low-LET radiation tracks
Ionizing radiations such as fast electrons generated from - or X-ray beams have high energy and low LET. For example, the average LET of a 1-MeV Compton recoil electron produced by a 60Co -ray source in liquid water at room temperature is ~0.3 keV/µm. The track-averaged mean energy loss per collision event by such an electron, as obtained from Monte Carlo simulations, is in the range ~47-56.8 eV (LAVERNE & PIMBLOTT, 1995; COBUT et al., 1998; MIRSALEH KOHAN et al., 2013). This means that the energy-loss events are, on the average, separated by distances of 200 nm. This nonhomogeneous distribution of energy deposition events in space gives rise to the “spur” theory for low-LET track structure (ALLEN, 1948; MAGEE, 1953; MOZUMDER & MAGEE, 1966a,b), according to which the entire track is to be viewed as a random succession of (more or less spherical) spurs. The few tens of electron-volts deposited in a spur may cause one (or more) secondary electron to be ejected from a molecule. As the ejected electron moves away, it undergoes collisions with surrounding water molecules, loses its excess energy, and becomes thermalized (~0.025 eV at 25 °C) within 8-12 nm of its geminate positive ion (GOULET et al., 1990, 1996; PIMBLOTT & MOZUMDER, 2004; MEESUNGNOEN et al., 2002a; UEHARA & NIKJOO, 2006). This average “electron thermalization distance” or “penetration range” can be viewed as an estimate of the spur’s initial radius, prior to spur expansion. Thus, under ordinary irradiation conditions, the individual spurs produced by a low-LET radiation are so far apart along the track that they are not initially overlapping.
In their pioneering work to model the radiation-chemical consequences of different energy-loss processes, MOZUMDER & MAGEE (1966a,b) considered, somewhat arbitrarily, a low-LET track as composed of a random sequence of three types of essentially non-overlapping entities: “spurs, blobs, and short tracks” (Fig. 3.2). The spur category contains all track entities created by the energy losses between the lowest excitation energy of water and 100 eV. Blobs are defined as track entities with energy transfers between 100-500 eV, and short tracks as those with energy transfers between 500 eV and 5 keV. Secondary electrons produced in energy transfers above 5 keV were
considered as “branch tracks”. Short and branch tracks are described collectively as -rays. This old concept of track entities proved to be very helpful in greatly facilitating the visualization of track processes and in modeling radiation-chemical kinetics. It is still a useful approach for the classification of track structures, since it takes into account the spatial arrangements of initial species, which affect their subsequent reactions.
Figure 3.2 – Classification of energy deposition events in water by track structure entities so-called spurs (spherical entities, up to 100 eV), blobs (spherical or ellipsoidal, 100-500 eV), and short tracks (cylindrical, 500 eV-5 keV) for a primary high-energy electron (not to scale). Short and branch tracks are described as -rays. From BURTON (1969), with permission.
Figure 3.3 shows typical two-dimensional representations of the track segments for 300-MeV and 150-keV irradiating protons (LET 0.3 and 70 keV/m, respectively) in liquid water at 25 °C, calculated using Monte Carlo simulations (KANIKE et al., 2015). It illustrates the nonhomogeneity of the energy deposition on a sub-microscopic scale. At the lowest LET (Fig. 3.3a), tracks are formed initially by well-separated “spurs” (more or less spherical in shape) that develop independently in time (without interference from the neighbouring spurs). As LET increases, the mean separation distance between the spurs decreases and the isolated spur structure changes to a situation in which the spurs overlap and form a dense continuous column (cylindrical shape) (Fig. 3.3b).
ii) High-LET radiation tracks
The column of species defined initially by the overlapping spurs along the path of a high-LET particle makes up what is referred to as the track “core”. It is surrounded by
a coaxial region traversed by large numbers of emergent, comparatively low-LET secondary electrons (-rays), called the “penumbra” (for example, see: PUCHEAULT, 1961; MOZUMDER et al., 1968; CHATTERJEE & SCHAEFER, 1976; FERRADINI, 1979; MAGEE and CHATTERJEE, 1980, 1987; PARETZKE, 1987; MOZUMDER, 1999; LAVERNE, 2000, 2004). Such a “high-LET” radiation track structure can actually be seen in heavy-ion irradiations (PLANTE et al., 2005; MUROYA et al., 2006). It is illustrated schematically in Figs. 3.4 and 3.5.
Figure 3.3 – Projections into the XY-plane of figure of track segments of 300 (a) and 0.15 (b) MeV protons (LET ~ 0.3 and 70 keV/m, respectively) incident on liquid water at 25 °C (KANIKE et al., 2015). The two irradiating protons are generated at the origin and start moving along the Y axis. Dots represent the energy deposited at points where an interaction occurred.
Figure 3.4 – Primary energy-loss events in high-LET radiation tracks (FERRADINI, 1979).
Figure 3.5 – Projections over the XY-plane of track segments calculated (at ~10-13 s)
using Monte Carlo simulations for (a) H+ (0.15 MeV), (b) 4He2+ (1.75 MeV/nucleon), (c) 12C6+ (25.5 MeV/nucleon), and (d) 20Ne10+ (97.5 MeV/nucleon) impacting ions. Ions are generated at the origin and along the Y axis in liquid water under identical LET conditions (~70 keV/μm). Dots represent the energy deposited at points where an interaction occurred. From MUROYA et al. (2006), with permission.
Figure 3.5 illustrates typical two-dimensional representations of short (1-5 m) track segments of H+, 4He2+, 12C6+, and 20Ne10+ ions, calculated with Monte Carlo simulations under the same LET conditions (namely, 70 keV/m) (MUROYA et al., 2006). As one can see, these tracks can be considered as straight lines with the ejected high-energy secondary electrons travelling to a greater average distance away from the track core as the velocity of the incident ion increases, from protons to neon ions. In other words, even though all those particles are depositing the same amount of energy per unit path length, that energy is lost in a volume that increases in the order H+ < 4He2+ <
12C6+ < 20Ne10+. This indicates that the higher-Z particles (where Z is the ion charge
number) have the lower mean density of reactive species (MUROYA et al., 2006; MEESUNGNOEN & JAY-GERIN, 2011). The fact that tracks of different ions with the
same LET have different radial distributions of energy deposited by -rays therefore indicates that the LET is not a unique descriptor of the radiation chemical effects within heavy-charged particle tracks (SCHULER & ALLEN, 1957; SAUER et al., 1977; LAVERNE & SCHULER, 1987; KAPLAN & MITEREV, 1987; FERRADINI, 1990; FERRADINI & JAY-GERIN, 1999; LAVERNE, 2000, 2004) (see the Discussion Chapter 7, Sect. 7.1). Attempts have been made to introduce other comparative characteristics of radiation track effects to replace the LET. Let us mention, for example, the (Z*/)2 factor (where Z* is an energy-dependent effective charge of the ion and is
the ratio of its velocity to that of light) (KATZ, 1970; WALIGÓRSKI et al., 1986; YAMASHITA et al., 2008) or yet the parameter MZ2/E (where M is the ion mass and E =
½MV2 its kinetic energy) (LAVERNE, 2004). Several sets of radiation chemical data appear to be better unified using these phenomenological parameters instead of the LET, others do not. Following PIMBLOTT & LAVERNE (2002), it should be recognized, however, that no deterministic parameterization can realistically represent a phenomenon that is stochastic in nature. Nevertheless, despite its limitations, the LET still remains the most useful single parameter in the radiation chemistry of heavy ions.
3.2 The “physicochemical” stage
The ions and excited-state water molecules formed during the physical stage are extremely unstable and undergo fast reorganization in this second or physicochemical stage, which lasts not more than 10-12 s after the initial energy deposition. These
processes produce radical and molecular products of the radiolysis that are distributed in a highly nonhomogeneous track structure.
In the time scale of 40-200 fs (MARSALEK et al., 2011; LI et al., 2013), the positive ion (also called cationic “hole”) H2O•+ decomposes to form an •OH radical by
transferring a proton to a neighboring water molecule:
H2O•+ + H2O H3O+ + •OH , [5]
where H3O+ represents the hydrated proton. However, before reaction [5] occurs, H2O•+
the average) from neighboring water molecules to the H2O•+ hole (or electron-loss center)
(OGURA & HAMILL, 1973; MOZUMDER & MAGEE, 1975). The ranges of a migrating hole are a few molecular diameters (COBUT et al., 1998).
The secondary (“dry”) electron ejected from an ionized water molecule undergoes scattering as it moves away from its parent cation. It can cause further ionization and excitation to occur if it has sufficient kinetic energy. Eventually, its energy falls below the first electronic excitation threshold of water (~7.3 eV), forming the so-called “subexcitation electron” (e
sub) (PLATZMAN, 1955). The latter loses the rest of its
energy relatively slowly by exciting vibrational and rotational modes of water molecules. Once it is thermalized (e
th) (after 10-40 fs at 25 °C; see: GOULET et al., 1990, 1996;
MEESUNGNOEN et al., 2002b), it can readily become localized or “trapped” in a pre-existing potential energy well of appropriate depth in the liquid. It then forms the so-called “wet” electron whose exact physicochemical nature is still the subject of investigation, before reaching a fully relaxed, hydrated state (e
aq) as the dipoles of the
surrounding molecules orient in response to the negative charge of the electron. In liquid water at room temperature, thermalization, trapping, and hydration can then follow in quick succession on the time scale of ~240 fs-1 ps, as revealed from time-resolved femtosecond laser spectroscopic studies (MOZUMDER, 1999; MEESUNGNOEN & JAY-GERIN, 2011):
e e
sub eth etr eaq . [6]
In the course of its thermalization, the slowing-down electron can be recaptured by its parent cation (prior to the occurrence of reaction [5]) due to the Coulomb attraction of the latter which tends to draw them back together to undergo electron-cation geminate recombination:
e
aq + H2O•+ H2O*. [7]
As the electron is recaptured, the parent ion is transformed into an excited neutral molecule.
In the course of its thermalization, the ejected electron can also be temporarily captured resonantly by a water molecule to form a transient molecular anion:
e + H
2O H2O• . [8]
This anion then undergoes dissociation mainly into H and •OH according to
H2O• H + •OH , [9]
followed by the reaction of the hydride anion (H) with another water molecule through a fast proton transfer reaction:
H + H2O H2 + OH [10]
Reactions [8]-10] correspond to the so-called “dissociative electron attachment” or DEA process, which has been observed in amorphous solid water at ~20 K for electron energies between about 5 and 12 eV (ROWNTREE et al., 1991). DEA was suggested to be responsible, at least in part, for the yield of “nonscavengeable” molecular hydrogen observed experimentally in the radiolysis of liquid water at early times (PLATZMAN, 1962b; FARAGGI & DÉSALOS, 1969; GOULET & JAY-GERIN, 1989; KIMMEL et al., 1994; COBUT et al., 1996; MEESUNGNOEN et al., 2015). Experiments by PASTINA et al. (1999) have sustained this proposed mechanism for the production of H2,
by showing that the previously accepted nonscavengeable yield of H2 is due to the
precursors to e
aq (i.e., electrons prior to their hydration) and it can be lowered with
suitable pre-hydrated electron scavengers in sufficiently high concentrations. Most recently, however, this mechanism has been challenged by STERNICZUK & BARTELS (2016) whose experiments have allowed them to suggest that the formation of H2 in the
subpicosecond physicochemical stage of track evolution is dominated by electron-hole charge recombination events of nearly thermalized, not yet trapped electrons ( e
th) (see
reactions 7 and 11b) rather than by DEA. In view of the fact that this subject has been controversial for so many years, further experiments are needed to confirm this conclusion.
Excited water molecules can be produced either directly in an initial act (reaction [4]) or by electron-cation geminate recombination (reaction [7]). Very little is known about the decay channels for an electronically/vibrationally excited water molecule in the liquid phase and the branching ratios associated with each of them. Fortunately, the contribution of the water excited states to the primary radical and molecular products in
water radiolysis is of relatively minor importance in comparison with that of the ionization processes, so that the lack of information about their decomposition has only limited consequences. Hence, the competing de-excitation mechanisms of H2O* are
generally assumed to be essentially the same as those reported for an isolated water molecule, namely (for example, see: SWIATLA-WOJCIK & BUXTON, 1995; COBUT et al., 1998; MEESUNGNOEN & JAY-GERIN, 2005; SANGUANMITH et al., 2011):
H2O* H• + •OH [11a]
H2O* H2 + O(1D) [11b]
H2O* 2H• + •O•(3P) [11c]
H2O* H2O + release of thermal energy , [11d]
where O(1D) and •O•(3P) represent the oxygen atom in its singlet 1D first excited state and triplet 3P ground state, respectively (see Fig. 3.1). Specific to the liquid phase, the following dissociation reaction:
H2O* eaq + H2O•+ [11e]
also needs to be considered in the menu of possibilities that can lead to the decay of H2O*. Its threshold is at ~6.5 eV (NIKOGOSYAN et al., 1983; MIGUS et al., 1987;
BERNAS et al., 1997).
It is believed that reaction [11a] is the main source of the “initial” (i.e., at ~10-12 s, prior to spur/track expansion) yield of hydrogen atoms. Note also that the O(1D) atoms produced in reaction [11b] react very efficiently with water to form H2O2 (or probably
also 2•OH) (TAUBE, 1957; BIEDENKAPP et al., 1970). By contrast, the ground-state
•O•(3P) atoms in aqueous solution are rather inert to water but react with most additives
(AMICHAI & TREININ, 1969). As for the values of the branching ratios (or decay probabilities) used for the different decay channels [11a-e], they are chosen in such a way that the calculated yields consistently match the observed picosecond G-values of the various spur species (MUROYA et al., 2002; MEESUNGNOEN & JAY-GERIN, 2005).
By ~1 ps following the passage of the radiation, the various initial radiolysis products are: e
aq, H•, H2, •OH, H2O2, H+ (or H3O+), OH, O2• (or HO2•, depending on the