OATAO is an open access repository that collects the work of Toulouse
researchers and makes it freely available over the web where possible
Any correspondence concerning this service should be sent
to the repository administrator:
[email protected]
This is a Publisher’s version published in:
http://oatao.univ-toulouse.fr/24462
To cite this version:
Dinh, Thi Mai Thanh and Nguyen, Thi Thom and Pham, Thi Nam and Nguyen,
Thu Phuong and Nguyen, Thi Thu Trang and Hoang, Thai and Grossin,
David
and Bertrand, Ghislaine
and Drouet, Christophe
Electrodeposition of HAp coatings on Ti6Al4V alloy and its electrochemical
behavior in simulated body fluid solution. (2016) Advances in Natural
Sciences: Nanoscience and Nanotechnology, 7 (2). 1-8. ISSN 2043-6254
Electrodeposition of HAp coatings on
Ti6Al4V alloy and its electrochemical
behavior in simulated body
fluid solution
Thi Mai Thanh Dinh
1, Thi Thom Nguyen
1, Thi Nam Pham
1,
Thu Phuong Nguyen
1, Thi Thu Trang Nguyen
1, Thai Hoang
1,
David Grossin
2, Ghislaine Bertrand
2and Christophe Drouet
21
Institute for Tropical Technology, Vietnam Academy of Science and Technology, 18 Hoang Quoc Viet Street, Cau Giay, Hanoi, Vietnam
2CIRIMAT Carnot Institute, UMR CNRS/UPS/INPT 5085, University of Toulouse, ENSIACET, 4 allée
Emile Monso, F-31030 Toulouse cedex 4, France E-mail:[email protected]
Received 28 January 2016
Accepted for publication 24 March 2016 Published 22 April 2016
Abstract
Hydroxyapatite(HAp) coatings were prepared on Ti6Al4V substrate by electrodeposition method from electrolyte solution containing Ca(NO3)2, NH4H2PO4and NaNO3. The results
show that the HAp coatings were single phase crystals of HAp. Scanning electron microscope (SEM) images present that HAp/Ti6Al4V have flake shapes which arrange to form like-coral agglomerates. In vitro test of the Ti6Al4V and HAp/Ti6Al4V in simulated body fluid (SBF) solution was investigated with different immersion times. pH of SBF solution decreased and the mass of materials increased. SEM images prove the formation of apatite on the surface of Ti6Al4V and HAp/Ti6Al4V. The corrosion current density during immersion time of substrate is always higher than the one of HAp/Ti6Al4V because the deposited HAp can protect well for the substrate.
Keywords: Ti6Al4V, electrodeposition, HAp, SBF Classification numbers: 2.03, 4.02
1. Introduction
In humans and mammals, hydroxyapatite (HAp, Ca10(PO4)6(OH)2) is the main component of bone and teeth.
Synthetic HAp has similar chemical composition, crystal structure and high biocompatibility as the natural bone tissue [1,2]. It has bioactive and high biocompatibility with cells,
tissues and can create direct bonding with immature bone. The result is the quick regeneration of bone. Thus HAp is used as a popular material for bone and tooth implants in the biomaterialfield. However, the mechanical strength of HAp is too low to be used in any load-bearing applications. For
exploiting the biocompatibility of HAp in the fabrication of bone and tooth implants it was coated on metal or alloy: Ti, 316L stainless steel, CoCrMoNi, TiN, TiO2, Ti6Al4V etc.
HAp coatings can be synthesized by many different methods such as: electrophoretic deposition [3, 4], plasma spraying
[5,6], sol-gel [7,8], biomimetic deposition [9] and
electro-deposition [1, 9, 10]. Among the above methods,
electro-deposition is one of the most promising methods to synthesize thin HAp coatings.
Ti6Al4V is a common metallic alloy which has found many uses as biomaterials in the human body. It has been increasingly preferred in the biomedical arena with cardio-vascular, dental and orthopedic applications because of their properties. Titanium(Ti) and its alloy (Ti6Al4V) are metallic materials commonly employed as orthopedic implants because of their high strength (compared with polymeric materials) and high toughness (compared with ceramic |Vietnam Academy of Science and Technology Advances in Natural Sciences: Nanoscience and Nanotechnology
Adv. Nat. Sci.: Nanosci. Nanotechnol. 7(2016) 025008 (8pp) doi:10.1088/2043-6262/7/2/025008
Original content from this work may be used under the terms of the Creative Commons Attribution 3.0 licence. Any further distribution of this work must maintain attribution to the author(s) and the title of the work, journal citation and DOI.
materials) [11]. However, metallic materials are susceptible to
corrosive attack by bodyfluids. Problems such as release of inflammatory mediators might cause adverse effects to the surrounding tissues [12]. Moreover, metallic surfaces are in
general not adequately bioactive. Therefore, to improve osteo-integration with bone tissues, many researchers syn-thesized HAp coatings on the surface of metals or alloys. Some studies indicated that HAp coatings on substrates have good biocompatibility when they were immersed in simulated bodyfluid(SBF) solution and HAp coatings on substrates are bioactive materials for biomedical applications[13–16].
In this work we electrodeposited HAp coatings on Ti6Al4V with the variation of scanning potential range and scan number. Then electrochemical behaviors of Ti6Al4V and HAp/Ti6Al4V materials were investigated in SBF solution.
2. Materials and methods
2.1. Materials
The HAp coatings were electrodeposited on Ti6Al4V bio-metallic alloy with the elemental compositions given in table1. A coupon of Ti6Al4V(1.5×1×0.2 cm3) was used as a cathode(working electrode) for the experiments. Prior to electrodeposition, the cathode was polished with SiC papers (ranging from P320 to P1200 grit), followed by ultrasonic rinsing in distilled water for 15 min and then dried at room temperature. The electrode working area was 1 cm2.
The chemicals were used for the experiments: calcium nitrate tetrahydrate(Ca(NO3)2·4H2O, M=236.15 g mol−1,
99% pure), ammonium dihydrogen phosphate (NH4H2PO4,
M=115.03 g mol−1, pure 99%) and sodium nitrate (NaNO3,
M=84.99 g mol−1, 99% pure) were imported from China.
2.2. Electrodeposition
The electrolyte solution contained 30 mM Ca(NO3)2, 18 mM
NH4H2PO4and 60 mM NaNO3with the ratio of Ca/P being
1.67 dissolved in distilled water. The presence of NaNO3in
the electrolyte solution increases the ionic strength of the electrolyte and for potentially exploiting the electrochemical reduction ofNO3- ions which contributes to generate OH− [17,18]. The pH of the electrolyte solution was 4.4.
HAp coatings were synthesized in a cell containing 80 ml of the above electrolyte solution with three electrodes: the working electrode was a Ti6Al4V sheet; a Pt foil was used as counter electrode (anode) and a Hg/Hg2Cl2/KCl (SCE)
electrode was used as reference. The deposition temperature was adjusted at 50°C by a thermostat (VELP, Italia).
The electrodeposition was carried out using an Autolab with different synthesis conditions: scanning potential ranges: 0 to−1.8; 0 to −1.9; 0 to −2.0; 0 to −2.2 and 0 to −2.5 V/ SCE; scan numbers: 1, 3, 5, 7 and 10 scans. HAp coatings were lightly rinsed by distilled water. Then they were dried at the room temperature.
2.3. Coating characterization
Molecular structure of HAp coating was determined by Fourier transform infrared spectroscopy(FTIR 6700, Nicolet) using KBr pellet technique at room temperature, in the range from 400 to 4000 cm−1with 16 cm−1resolution and 16 scans signal average. HAp coatings were lightly separated from the substrate and the phase structure of HAp coatings were characterized by x-ray diffraction (XRD) (Siemen D5005 Bruker-Germany, Cu-Kα radiation (λ=1.5406 Å)), operated at 40 kV and 30 mA, with step angle of 0.030° s−1and in a 2θ degree range of 20°–50°. The average crystallite size along c-direction of electrodeposited HAp was calculated from(002) reflection in XRD pattern, using Scherrer’s equation:
l q = D B 0.9 cos , ( )1
where D(nm) is crystallite size, λ (nm) is the wavelength of the radiation,θ (rad) is the diffraction angle and B is the full-width at half-maximum of the peak along (002) direction
Surface morphology of HAp coatings before and after immersion in the SBF solution were examined using a Hitachi S-4800 scanning electron microscope (SEM). HAp coating thickness was determined following ISO 4288-1998 standard by the Alpha-Step IQ equipment (KLA-Tencor-USA). The coating thickness is the average value offive measurements.
2.4. In vitro test
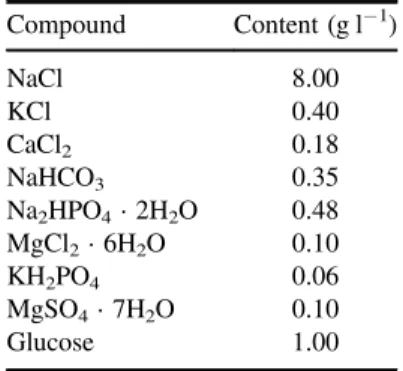
A liter of the SBF solution was prepared by dissolution of chemicals in distilled water (table 2). The pH of the SBF
solution was adjusted to 7.4 by 1 M HCl solution and the temperature was maintained at 37°C by water bath [19–21].
Ti6Al4V and HAp/Ti6Al4V materials were limited to 1 cm2of active area and they were immersed in Falcon tubes containing 40 ml of the SBF solution at 37°C in a water bath for 1, 5, 7, 11, 14 and 21 days. The electrochemical behavior of the materials was tested by Autolab equipment with a three Table 1.Elemental content of Ti6Al4V alloy.
Element Ti Al V C Fe
Content(%) 89.63 6.04 4.11 0.05 0.17
Table 2.Chemical composition of the SBF solution.
Compound Content(g l−1) NaCl 8.00 KCl 0.40 CaCl2 0.18 NaHCO3 0.35 Na2HPO4·2H2O 0.48 MgCl2·6H2O 0.10 KH2PO4 0.06 MgSO4·7H2O 0.10 Glucose 1.00 2
electrodes cell. The above materials were used as working electrode, a saturated calomel electrode(SCE) as a reference electrode and Pt foil as a counter electrode.
The working electrode was polarized in the potential range of±10 mV around its open circuit potential (OCP) with a scan rate of 1 mV s−1. From polarization curves ΔE, ΔI values were determined. The polarization resistance Rp and
the corrosion current density icorr were calculated from
equations = D D R E i , 2 p ( ) = i B R , 3 corr p ( ) the B values were determined from the Tafel slopes of i–E curves in the potential range OCP±100 mV with a scan rate of 1 mV s−1 by using equation = + B b b b b 2.3 , 4 a c a c | | ( | |) ( )
where bais the value of the anodic Tafel slope and|bc| is the
absolute value of the cathodic Tafel slope. We obtain B=0.014 26 and 0.0119 corresponding to Ti6Al4V and HAp/Ti6Al4V.
3. Results and discussions
3.1. The cathodic polarization curve of Ti6Al4V
Figure1 shows the cathodic polarization curve of Ti6Al4V substrate in the above electrolyte at the scanning potential range from 0 to−2.5 V/SCE with a scan rate of 5 mV s−1at 50°C. The cathodic polarization curve has similar shape and consistent with the reported results[16,21]. In this scanning
range there is reduction of O2,H PO ,2 4- HPO42-and H2O to
createPO43-and OH−. The OH−andPO43-react with Ca2+
ions to form HAp coatings on the cathode according to the
chemical reaction
+ +
+ -
-10Ca2 6PO 2OH Ca PO OH . 5 4
3
10( 4 6) ( )2 ( ) Beside, different compounds of Ca and P are results of following reactions:
+ + +
⋅
+ -
-4Ca HPO 2PO 2.5H O Ca H PO 2.5H O, octacalcium phosphate, OCP ,
6 2 4 2 4 3 2 4 4 3 2 ( ) ( ) ( ) + + ⋅ + -Ca HPO 2.5H O CaHPO 2.5H O, dicalcium dihydrogen phosphate, DCPD . 7 2
4 2
2 4 2
( ) ( )
3.2. Effect of scanning potential range
Based on the analysis of the cathodic polarization curve, HAp coating was electrodeposited in the electrolyte solution (pH=4.4) with different scanning potential ranges: from 0 to −1.8; 0 to −1.9; 0 to −2.0; 0 to −2.2 and 0 to −2.5 V/SCE during 5 scans with a scan rate of 5 mV s−1, at 50°C.
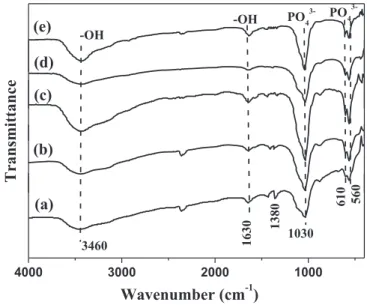
FTIR spectra of HAp synthesized on the surface of Ti6Al4V with different scanning potential ranges are pre-sented infigure2. All of the spectra show the characteristic bands ofPO43-group(asymmetric stretching vibration of P– O bond at 1030 cm−1; asymmetric O–P–O bending mode at 560 cm−1). Absorption peaks at 3460 and 610 cm−1 usually assigned to the O–H stretching vibration in hydroxyapatite were not clearly distinguished on these spectra. This can be explained by the non-stoichiometry of the apatite phase, with a deficiency in calcium and hydroxide groups. Water bands were visible by a large band in the range 3460 cm−1 (O–H stretching from water molecules) and by the H–O–H bending band at 1630 cm−1. Beside, the presence of peak in the region around 1380 cm−1can be assigned to the vibration modes of Figure 1.The cathodic polarization curve of Ti6Al4V electrode in
the electrolyte solution: 30 mM Ca(NO3)2, 18 mM NH4H2PO4and
60 mM NaNO3. Figure 2.FTIR spectra of HAp synthesized on Ti6Al4V with the
different scanning potential ranges(a) 0 to −1.8 (b) 0 to −1.9 (c) 0 to−2.0 (d) 0 to −2.2 and (e) 0 to −2.5.
-CO32 .The occurrence ofCO32-may be due to the reaction of atmospheric CO2 with OH− ions, hence the content of
-CO32 ions is rather low[16].
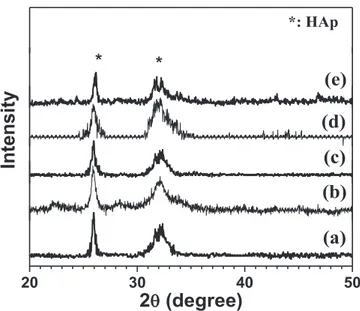
Figure3 presents the XRD diffraction patterns of HAp synthesized on the surface of Ti6Al4V in 2θ of 20°–50°. The XRD patterns only exhibit the hydroxyapatite phase(denoted
*infigure3). The typical peaks are found at 2θ≈26° and
32° corresponding to (002) and (211) planes.
The HAp crystal diameter calculated from the Scherrer equation shows that the crystals have nano-size(89–106 nm). The crystal diameter changes not much when the potential range changes from 0 to −1.8 V/SCE to 0 to −2.0 V/SCE. However, with the larger potential range the crystal diameter increases significantly (table 3). It can be explained as
fol-lowing: with the large potential range, much OH−, PO43 -ions were generated leading to the large formation of HAp; the HAp particles concentrated to form larger particles.
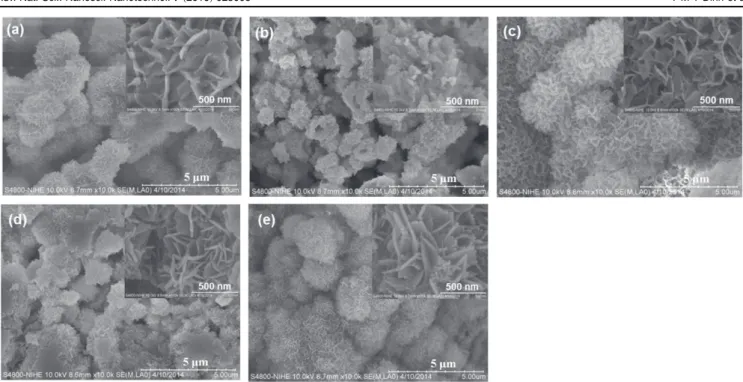
The SEM images of HAp coatings on Ti6Al4V were shown in figure 4. The results show that with the different potential ranges, the surface morphology does not change. All of the samples, the substrates were covered completely by HAp coatings. At low magnification the crystals of HAp have coral-like shape. At high magnification, SEM images clearly show that HAp crystals haveflake-like shape to form coarse granular agglomerates.
Table4 showed the thickness of HAp coatings synthe-sized with different potential ranges. The coating thickness increases and reaches a maximum value at 7.91μm (the potential range 0 to −2.0 V/SCE, respectively). When the potential range was larger, the thickness of HAp coatings
decreases. The coating thickness is 4.68μm with the potential range from 0 to −2.5 V/SCE. The decrease of the coating thickness can be explained as following: with the large scanning potential range, the further increase in the amount of OH−andPO43-ions on the electrode surface, leading to their diffusion from the electrode surface into the solution and these ions combined with Ca2+to form HAp in the solution. Simultaneously, with the large cathode potential, the reduc-tion of water is promoted, thus the hydrogen bubbles are created on the electrode surface that may reduce adhesion ability of HAp coatings with Ti6Al4V substrate. So the sui-table potential range is 0 to−2.0 V/SCE.
3.3. Effect of scan number
Deposition time affects the thickness and surface morphology of HAp coatings. We electrodeposited HAp coatings in the potential range 0 to −2.0 V/SCE with the change of scan number: 1, 3, 5, 7 and 10 scans with constant scan rate (5 mV s−1). SEM images of the HAp coatings on the surface
of Ti6Al4V are shown infigure5. With different scan num-ber, the morphology of HAp coatings is various. It is explained as following: with change of scan number, OH−,
-PO43 ions are differently formed and they affect the for-mation and crystallization of HAp.
Table5 presents the HAp coating thickness synthesized with the different scan numbers. The coating thickness increases and reaches the maximum value after 5 scans. The scan number increases continually, the thickness of HAp coatings decreases due to peeling of HAp coatings. Therefore, 5 scans was chosen to synthesize HAp coatings on Ti6Al4V by electrodeposition method. In the next parts, we synthesized HAp/Ti6Al4V at condition: the potential range from 0 to −2.0 V/SCE; 5 scans; 5 mV s−1 at 50°C to investigate
in vitro test.
3.4. In vitro test
The electrochemical behaviors of Ti6Al4V and HAp/ Ti6Al4V materials in the SBF solution were also investigated.
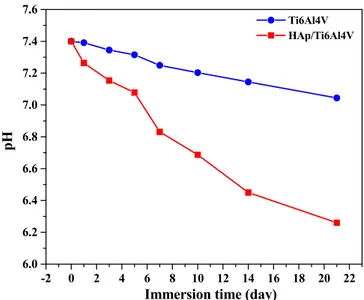
3.4.1. The variation of pH solution. Figure 6 shows the pH values of the SBF solutions containing Ti6Al4V and HAp/Ti6Al4V materials with different immersion times at 37°C. The pH value of the SBF solution before soaking is 7.4. The pH of the SBF solutions decreased during the immersion time. Moreover, the pH of SBF solution containing HAp/Ti6Al4V decreases more strongly in comparison with Ti6Al4V substrate. It can be hypothesized that HAp as nucleation promotes the formation of apatite. The formation of apatite consumed OH-leading to the reduction of pH solution, the pH solution Figure 3.XRD patterns of HAp synthesized on Ti6Al4V with the
different scanning potential ranges(a) 0 to −1.8 (b) 0 to −1.9 (c) 0 to−2.0 (d) 0 to −2.2 and (e) 0 to −2.5.
Table 3.The crystal diameter of HAp electrodeposited with the different potential ranges. Potential range(V/SCE) 0 to−1.8 0 to−1.9 0 to−2.0 0 to−2.2 0 to−2.5
Crystal diameter(nm) 89 89 90 106 106
4
Figure 4.SEM images of HAp/Ti6Al4V synthesized with the different potential ranges: (a) 0 to −1.8, (b) 0 to −1.9, (c) 0 to −2.0, (d) 0 to
−2.2 and (e) 0 to −2.5 V/SCE.
Table 4.The thickness of HAp coatings synthesized with the different potential ranges. The potential range(V/SCE) 0 to−1.8 0 to−1.9 0 to−2.0 0 to−2.2 0 to−2.5
The thickness(μm) 4.9±0.3 6.0±0.2 7.9±0.2 5.98±0.3 4.7±0.4
Figure 5.SEM images of HAp coatings with the different scan numbers:(a) 1; (b) 3; (c) 5; (d) 7 and (e) 10 scans.
Table 5.The thickness of HAp coatings synthesized with the different scan numbers.
The scan number 1 3 5 7 10
containing HAp/Ti6Al4V decreases strongly during immersion time. This result shows that the formation of apatite was significant. After 21 immersion days in the SBF
solution, the pH value of the solution immersed HAp/ Ti6Al4V was 6.16.
3.4.2. Variation of mass. The mass variation of Ti6Al4V and HAp/Ti6Al4V materials with different immersion times is displayed infigure7. The mass of Ti6Al4V substrate during immersion time changed not much. After 21 immersion days in the SBF solution, the mass of Ti6Al4V is 0.08 mg cm−2. With HAp/Ti6Al4V, the mass of material increased during the immersion process. After 21 immersion days the mass variation of HAp/Ti6Al4V is 1.99 mg cm−2. It is clear that the formation of apatite crystals on the surface of material increased significantly. These results are confirmed by the SEM images (figures8and 9).
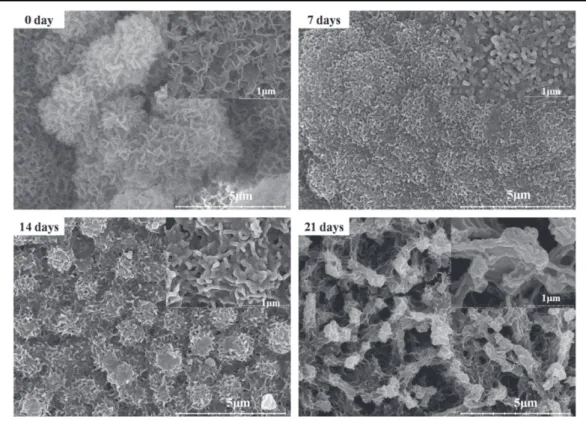
3.4.3. The SEM images. Figures 8 and 9 display SEM
images of Ti6Al4V and HAp/Ti6Al4V materials before and after immersion in the SBF solution with different times. The SEM image of the Ti6Al4V sample after 21 immersion days in the SBF solution observed the formation of apatite crystals. However apatite crystals do not cover substrate fully(figure8).
HAp coatings on Ti6Al4V haveflake-like shape to form coarse granular agglomerates before immersed in the SBF solution. After immersion in SBF solution, morphology has clear change. It shows the formation of apatite crystals on the surface of HAp/Ti6Al4V. The apatite crystals are observed with cylinder shape and clump to form groups with cactus shape. Specially, with the sample immersed during 21 days in the SBF solution, apatite crystals grew up to form a thicker block on the surface of material. The results about the formation of apatite crystals are suitable with decrease of pH and increase of sample mass in the immersion process. These materials exhibit good biocompatibility in the SBF solution.
3.4.4. Polarization measurements. Variation of parameters Ecorr, icorr, Rp according to immersion time was calculated
from polarization potential measurements results of Ti6Al4V and HAp/Ti6Al4V materials in the SBF solution (table 6).
The variation of icorr as well as Rp is not following a rule,
these values fluctuate at different immersion times. After 1 immersed day in SBF solution, polarization resistance Rpof
HAp/Ti6Al4V is much higher than that of Ti6Al4V (60.7 Figure 6.The pH value of SBF solution immersed Ti6Al4V and
HAp/Ti6Al4V materials versus different immersion times at 37o
C.
Figure 7.The mass variation of Ti6Al4V and HAp/Ti6Al4V versus
different immersion times in the SBF solution.
Figure 8.SEM images of Ti6Al4V before and after 21 immersion days in the SBF solution.
6
and 11.4 kΩ, respectively). This result shows that HAp coatings are capable to protect the substrate. The increase or the decrease of Rpshows the formation or the dissolution of
HAp in the SBF solution. Generally, during immersion times the corrosion current density of substrate is higher than the one of sample covered by HAp coatings. The polarization resistance of substrate is lower than that of substrate covered by HAp. These results could indicate that the HAp coatings protect the substrate.
4. Conclusion
HAp coatings have been successfully synthesized on the sur-face of Ti6Al4V by the electrodeposition method via a simple technique. The analysis results show that the HAp coatings were single phase crystals of HAp. HAp coatings have
flake-like shape to form coarse granular agglomerates. The in vitro test with Ti6Al4V and HAp/Ti6Al4V in the SBF solution were realized with different immersion times. SEM images showed the formation of apatite on the surface of Ti6Al4V and HAp/Ti6Al4V during the immersion time in the SBF solution. The apatite crystals had a cactus-like shape and covered fully the surface of HAp/Ti6Al4V material after 21 immersion days. The electrochemical behavior of Ti6Al4V and HAp/Ti6Al4V in the SBF solution shows the formation of apatite and HAp coatings behave as substrate protective layer.
Acknowledgments
This work was supported by Vietnam Academy of Science and Technology(under grant no. VAST. HTQT. FRANCE. 03/15-16) and was conducted within the context of the International Associated Laboratory‘Functional Composite Materials’ (LIA-FOCOMAT) created between the ITT (Vietnam)-VAST and the CIRIMAT(France)-CNRS institutes.
References
[1] Vasilescu C, Drob P, Vasilescu E, Demetrescu I, Ionita D, Prodana M and Drob S I 2011 Corros. Sci.53 992 [2] Popa M V, Moreno J M C, Popa M, Vasilescu E, Drob P,
Vasilescu C and Drob S I 2011 Surf. Coat. Technol.
205 4776
[3] Albayrak O, El-Atwani O and Altintas S 2008 Surf. Coat. Technol.202 2482
[4] Kumar R M, Kishor K K, Sanjay S, Pallavi G, Bharat B, Gopinath P and Debrupa L 2016 Surf. Coat. Technol.287 82
Figure 9.SEM images of HAp/Ti6Al4V samples before and after different immersion times in the SBF solution. Table 6.Variation of Ecorr, icorr, Rpof Ti6Al4V and HAp/Ti6Al4V
in the SBF solution versus the immersion times.
Ti6Al4V HAp/Ti6Al4V Time (day) Ecorr (V/ SCE) icorr (μA) Rp(kΩ) Ecorr (V/ SCE) icorr (μA) Rp(kΩ) 1 −0.136 1.25 11.4 −0.187 0.19 60.7 5 −0.107 0.64 22.4 −0.183 0.33 36.0 7 −0.121 0.76 18.8 −0.164 0.39 30.7 11 −0.125 1.19 12.0 −0.094 0.56 21.4 14 −0.137 0.99 14.4 −0.096 0.70 17.1 21 −0.153 0.90 15.9 −0.169 0.23 51.1
[5] Morks M F and Kobayashi A 2007 Appl. Surf. Sci.253 7136
[6] Yung C Y and Chyun Y Y 2013 Ceram. Int.39 6509
[7] Weng W and Baptista J L 1999 J. Am. Ceram. Soc.82 27
[8] Balamurugan A, Kannan S and Rajeswari S 2002 Trends Biomater. Artif. Organ.16 18
[9] Yang G L, He F M, Hu J A, Wang X X and Zhao S F 2009 Oral Surg. Oral Med. Oral Pathol. Oral Radiol. Endod.107 782 [10] Gopi D, El-Sayed M S, Rajeswari D, Kavitha L, Pramod R, Jishnu D and Polaki S R 2014 J. Alloys Compd.616 498 [11] Mrksich M and Whitesides G M 1996 Annu. Rev. Biophys.
Biomol. Struct.25 55
[12] Hallab N J, Mikecz K, Vermes C, Skipor A and Jacobs J J 2001 J. Biomed. Mater. Res.56 427
[13] Zhao X, Yang L, Zuo Y and Xiong J 2009 Chin. J. Chem. Eng.
17 667
[14] Ugur T and Mustafa G 2010 Ceram. Inter.36 1805
[15] Thanh D T M, Nam P T, Phuong N T, Que L X, Anh N V, Hoang T and Lam T D 2013 Mater. Sci. Eng. C33 2037
[16] Xin F, Jian C, Jian-peng Z, QianW, Zhong-cheng Z and Jian-ming R 2009 Trans. Nonferr. Met. Soc. China
19 347
[17] Lin D Y and Wang X X 2010 Surf. Coat. Technol.204 3205
[18] Myriam N, Olivier D, Oscar R M and Bernard T 2007 J. Electroanal. Chem.600 87
[19] Alves V A, Reis R Q, Santos I C B, Souza D G,
Goncalves T F, Pereira da Silva M A, Rossi A and Silva L A 2009 Corros. Sci.51 2473
[20] Nath S, Tu R and Goto T 2011 Surf. Coat. Technol.206 172
[21] Fleet M E 2009 Biomaterials30 1473
8