Département de génie électrique et de génie informatique
DÉVELOPPEMENT D’UN MICROSCOPE À GUIDE
D’ONDE À GAINE MÉTALLIQUE COMBINÉ AVEC
FLUORESCENCE P L’IMAGERIE DE CELLULES
VIVANTES
DEVELOPMENT OF A COMBINED METAL CLAD
WAVEGUIDE AND SURFACE ENHANCED
FLUORESCENCE MICROSCOPE FOR LIVE CELL
IMAGING
Thèse de doctorat Spécialité : génie électriqueThomas SÖLLRADL
Jury : Paul CHARETTE (directeur) Michel GRANDBOIS (directeur)
Michael CANVA Serge Charlebois Jean-François Masson
To my parents, who gave me roots to grow wings so I can fly. I will be forever grateful for your unconditional love and support!
i
RÉSUMÉ
Il y a un intérêt grandissant dans les domaines de la biologie cellulaire et de la pharmacologie pour la détection fiable d’interactions cellule-cellule et d’activités résultantes de l’interaction cellulaire avec l’environnement physique et biochimique. Les techniques de détection sans marquage, telles que celles basées sur la résonance plasmonique de surface, les réseaux de diffraction ou la spectroscopie d’impédance électrique, sont désormais utilisées de façon routinière. Celles-ci permettent de mesurer, entre autres, les signaux cellulaires sous-jacents et l’activité fonctionnelle des cellules exposées à des hormones, des agents pharmacologiques ou encore, des toxines.
Lors de ces tests, le signal mesuré est issu de plusieurs cellules. Il est généralement supposé que le profil de réponse cellulaire est homogène parmi la population de cellules testées. Or, de plus en plus de publications tendent à mettre en évidence un haut niveau d’hétérogénéité au sein d’une population de cellules. Bien que pourvues d’une grande sensibilité, les techniques précédemment mentionnées ont des lacunes en termes de résolution spatiale et de profondeur de sondage, ce qui rend impossible la détection d’activité cellulaire individuelle. Le niveau de complexité augmente lorsque l’on considère que les profils de réponses cellulaires résultent d’un amalgame de divers événements de signalisation cellulaire individuels, ce qui rend difficile l’extraction de la contribution d’une composante précise du signal global mesuré.
Dans cette thèse, une plate-forme d’imagerie a été développée en combinant deux méthodes, l’une sans et l’autre avec marquage. Ces méthodes sont respectivement les guides d’ondes à gaine métallique (MCWG, metal clad waveguide) et la fluorescence exaltée en surface (SEF, surface enhanced fluorescence). L’objectif est de simultanément visualiser et quantifier les signalisations et activités fonctionnelles des cellules individuelles. Des simulations numériques sont présentées qui illustrent les performances attendues du système. Le système a été testé expérimentalement sur une combinaison d’échantillons synthétiques bien définis et de nombreuses cellules vivantes génériques, de nature variée. Nous avons montré que la plateforme MCWG proposée peut atteindre une grande profondeur de mesure (>600 nm) tout en maintenant une bonne résolution latérale (5 μm), permettant ainsi l’observation de cellules individuelles. Contrairement à l’imagerie MCWG, le signal obtenu en SEF ne dépend pas d’un mode de propagation et sa résolution est limitée seulement par la diffraction.
Il a été possible de montrer le caractère hétérogène d’une petite population de cellules en mesurant, sans employer de marqueur, les variations de signalisations et de la morphologie cellulaire. Le caractère unique de chaque cellule en lien avec son profil de réponse a été détecté et quantifié par la mesure de l’activité intracellulaire de cellules endothéliales en état d’apoptose induite. Dans une seconde série d’expériences, le système a été employé pour étudier les changements dans l’intégrité d’un film de cellules confluentes exposé à des stimuli biochimiques. L’utilisation du mode d’imagerie MCWG a permis d’illustrer le lien direct entre le signal mesuré et la formation d’interstices intercellulaires dans la monocouche de cellules. Les avantages d’un système combiné exploitant des approches avec et sans marqueurs ont été montrés. Ceci a été réalisé par l’emploi de marqueurs fluorescents afin d’associer les variations dans les composantes moléculaires et structurelles des cellules au signal MCWG mesuré. Plus
ii
de mesurer l’activité des signaux médiés par les récepteurs. L’analyse simultanée du signal MCWG, lequel n’emploie pas de marqueur, et du signal calcique associé à l’activation du récepteur de l’angiotensine 1 a permis d’identifier certains éléments caractéristiques du signal obtenu sans marqueur. De plus, en utilisant des inhibiteurs pharmacologiques, il a été possible d’isoler certains chemins de signalisations dans l’activité cellulaire observée.
Mots-clés : Microscopie sans marqueurs, microscopie par fluorescence, biodétection cellulaire,
i
ABSTRACT
There is a sustained interest in the field of cell biology and pharmacology to reliably detect cell-cell interaction or their signaling and functional activities resulting from their interactions with the physical and biochemical environments. Label-free sensing techniques based on surface plasmon resonance, diffraction grating and electrical impedance spectroscopy are now routinely used for monitoring the underlying cell signaling and functional activity when exposed to hormones, pharmacological agents and toxins.
In these assays, the measured signal derives from the summation of many cells, thereby assuming that the underlying cell response profile is homogeneous within the tested cell population. There is, however, an increasing body of evidence demonstrating a high level of cell-to-cell heterogeneity within a cell population. While highly sensitive, these techniques often lack the spatial resolution and probing depth to detect individual cell signaling activity, thereby hindering the detection heterogeneous cellular activity. Further complexity arises from the fact that cellular response profiles are an integration of complex intracellular signaling events which makes it challenging to precisely delineate the contribution of the underlying intracellular components on the obtained signal profiles.
In this thesis, an imaging platform was developed combining a label-free and label based imaging modality, namely metal clad waveguide (MCWG) and surface enhanced fluorescence (SEF), for the simultaneous visualization and quantification of individual cell signaling and functional activity. Numerical simulations are presented, demonstrating the expected performance of the system and the developed system was experimentally characterized with a combination of well-defined synthetic samples and various live cells models. We have shown that the proposed MCWG imaging platform can achieve a deep probing depth (> 600 nm) while maintaining a lateral resolution (5 μm) allowing the resolution of individual cells. Unlike MCWG imaging, the SEF signal is not dependent on a propagating mode and diffraction limited resolution was achievable.
The label-free detection of cell-to-cell heterogeneity was demonstrated by the real-time monitoring of cell signaling activity and morphological changes in a small population of cells. Heterogeneity in individual cell response profiles was successfully detected and quantified within apoptosis-induced intracellular activity in an endothelial cells model. In a second set of experiments, the system was used to assess changes in the integrity of a confluent cell layer exposes to biochemical stimuli. In this experiment, MCWG imaging modality has allowed to establish a direct link between the obtained sensor signal and the formation of intercellular gaps in the cell monolayer.
The advantages of a combined label-free and label based imaging approach were demonstrated by using fluorescent markers to detect underlying molecular and structural cellular components associated with the MCWG signal. The imaging system was used for the visualization of actin cytoskeleton within vascular smooth muscle cells. Finally, the imaging platform was applied to monitor receptor-mediated signaling activity. The simultaneous analysis of the MCWG label-free signal and the SEF intracellular calcium signal from angiotensin 1 receptor activation
ii
Keywords : label-free microscopy; fluorescence microscopy, cell-based biosensing;
iii
TABLE OF CONTENTS
RÉSUMÉ ... i
ABSTRACT ... i
TABLE OF CONTENTS ... iii
TABLE OF FIGURES ... vii
LIST OF ACRONYMS ... ix
CHAPTER 1 Introduction ... 11
1.1 Context and Research Problem ... 11
1.2 Research Question and Objectives ... 13
1.3 Thesis Organization ... 14
CHAPTER 2 State of the Art ... 17
2.1 Integrated Optics ... 17
2.1.1 Refraction, Reflection and Polarization of Light ... 17
2.1.2 Total Internal Reflection and the Evanescent Field ... 20
2.1.3 Dielectric Slab Waveguides ... 23
2.2 Surface Plasmon Resonance (SPR) ... 25
2.2.1 Definition of Surface Plasmons ... 26
2.2.2 Excitation of Surface Plasmon Resonance ... 27
2.2.3 Surface Plasmon Resonance Biosensing ... 29
2.2.4 Living Cell-Based Surface Plasmon Resonance Biosensing ... 30
2.3 Metal Clad Waveguides (MCWGs) ... 31
2.3.1 Definition of Metal Clad Waveguides ... 32
2.3.2 Characteristics of MCWG Sensor Chips ... 33
2.3.3 Cell Based Biosensing with Metal Clad Waveguides ... 38
2.4 Evanescent Wave Microscopy ... 39
2.4.1 Principle and Concepts ... 39
2.4.2 Lateral Resolution and Penetration Depth ... 41
2.4.3 Surface Plasmon Resonance Microscopy of Living Cells ... 45
2.5 Other Label Free Cell Based Biosensors ... 48
2.5.1 Refractive Waveguide Grating (RWG) ... 48
2.5.2 Electric Cell-Substrate Impedance Sensing (ECIS) ... 50
2.6 Surface Plasmon Enhanced Fluorescence (SPEF) ... 53
2.6.1 Energy Transfer and Quenching Mechanisms in SPEF ... 56
2.6.2 Surface Enhanced Fluorescence of Living Cells ... 57
2.7 Summery ... 59
CHAPTER 3 Metal Clad Waveguide (MCWG) Based Imaging using a High Numerical Aperture Microscope Objective ... 61
3.1 Overview of Article ... 61
3.3 Abstract (French) ... 63
3.4 Abstract (English) ... 63
3.5 Introduction ... 64
3.6 Metal-clad vs plasmonics waveguide modes: numerical simulations... 66
3.7 Instrumentation setup ... 74
3.8 Experimental Results and Discussion ... 76
3.8.1 Lateral imaging resolution ... 76
3.8.2 Imaging depth ... 78
3.8.3 Imaging of living cells ... 80
3.9 Conclusion ... 82
3.10 Acknowledgments ... 82
CHAPTER 4 Label-free visualization and quantification of single cell activity using metal-clad waveguide (MCWG)-based microscopy... 83
4.1 Overview of Article... 83
4.2 French Title: ... 85
4.3 Abstract (French) ... 85
4.4 Abstract (English) ... 85
4.5 Introduction ... 86
4.6 Materials and Methods ... 88
4.6.1 Imaging instrumentation and sensor chip design ... 88
4.6.2 Cell culture and reagents... 91
4.6.3 Image analysis... 92
4.6.4 Statistics ... 93
4.7 Results and discussion ... 93
4.7.1 Monitoring of cell response heterogeneity to an extrinsic apoptotic stimulus ... 93
4.7.2 Spatially-resolved monitoring of confluent endothelial cell monolayer integrity ... 98
4.8 Conclusion ... 101
4.9 Acknowledgements ... 102
CHAPTER 5 Monitoring Individual Cell Signaling Activity Using Combined Metal-Clad Waveguide and Surface Enhanced Fluorescence Imaging ... 103
5.1 Overview of Article... 103
5.2 French Title: ... 105
5.3 Abstract (French) ... 105
5.4 Abstract (English) ... 106
5.5 Introduction ... 107
5.6 Material and Methods ... 109
5.6.1 MCWG-SEF microscopy platform ... 109
5.6.2 Cell culture and fluorescence staining ... 111
5.7 Results and Discussion ... 112
5.7.1 Actin cytoskeleton imaging by MCWG-SEF microscopy ... 112
5.7.2 AT1-induced cell activity analyzed by MCWG-SEF microscopy ... 114
5.7.3 Role of ROCK and G12/13 during AT1 signaling and its link to cellular activity ... 117
5.8 Conclusion ... 119
5.9 Acknowledgements ... 120
CHAPTER 6 Discussion ... 121
6.1 MCWG and SEF Microscopy ... 122
6.2 Individual Cell-Based Biosensing ... 123
6.2.1 Multimodal Sensing for Selective Structural Imaging ... 124
6.2.2 Extracting Heterogeneity Within a Larger Cell Population ... 124
CHAPTER 7 Conclusion (French) ... 125
CHAPTER 8 Conclusion ... 127
8.1 Summary and Overview of Achieved Goals ... 127
8.2 Contribution of this Work ... 129
8.3 Outlook ... 130
vii
TABLE OF FIGURES
Figure 2.1: Refraction and reflection at an interface ... 18
Figure 2.2: Polarization of light ... 19
Figure 2.3: Simulated reflected and transmitted light intensity... 21
Figure 2.4: Simulated electric field intensity profile for a glass water interface... 22
Figure 2.5: Schematic of a dielectric slab waveguide. ... 23
Figure 2.6: Simulated E-Field profile for a dielectric slab waveguide. ... 25
Figure 2.7: SPs at a metal/dielectric interface ... 26
Figure 2.8: Excitation of SPR using ATR coupling technique ... 28
Figure 2.9: Impact of refractive index changes in close proximity to the metal surface ... 29
Figure 2.10: Spectrum of measurable cell responses by SPR ... 30
Figure 2.11: Schematic of a MCWG. ... 32
Figure 2.12: Guided modes effective index for a MCWG as a function of core thickness. ... 33
Figure 2.13: Simulated reflected light intensity ... 35
Figure 2.14: Change in reflectance for Δnc = 0.001. ... 36
Figure 2.15: Simulated E and H-Field profiles through the MCWG structure. ... 37
Figure 2.16: Principle of evanescent based microscopes ... 40
Figure 2.17: Imaging setups of evanescent based microscopes ... 40
Figure 2.18: Impact of the finite propagation distance in evanescent based microscopy. ... 42
Figure 2.19: Tradeoff between penetration depth and attenuation length for MCWG, SPR and LR-SPR. ... 44
Figure 2.20: Surface plasmon microscopy of a goldfish glial cell. ... 45
Figure 2.21: Cell-substrate interface imaged by SPRI ellipsometry ... 46
Figure 2.22: Wide field SPRI of HaCaT cells ... 47
Figure 2.23:Basic principle of refractive waveguide grating (RWG). ... 49
Figure 2.24:Schematic of a ECIS setup. ... 50
Figure 2.25:Comparison of ECIS to SPR cell based assays. ... 51
Figure 2.26: Basic Jablonski Diagram (A) and excitation and emission spectra for TRITC (B). ... 54
Figure 2.27: Reflectivity and relative surface field intensity in TIR (A) and SPEF (B). ... 55
Figure 2.28: Modified Jablonski diagram for SPEF (A) and schematic of different coupling regimes (B). ... 57
Figure 3.1: Mode attenuation distance (imaging spatial resolution) vs penetration depth in the dielectric ... 68
Figure 3.2: MCWG modal characteristics at λ = 0.470 nm as a function of core thickness and mode order ... 71
Figure 3.3: Electric (LEFT) and magnetic (RIGHT) field intensity profiles ... 73
Figure 3.4: Schematic diagram of the imaging system based on a high numerical aperture objective ... 75
Figure 3.5: Typical pair of reflectivity images acquired with the microscope from two orthogonal directions ... 77
Figure 3.6: Images of 10 um diameter polystyrene microbeads... 79
Figure 3.7: Simultaneous brightfield and MCWG-based imaging of live HEK-293 cells... 81
Figure 4.2: MCWG images of cell response heterogeneity to an extrinsic apoptotic stimulus (TRAIL) ... 95 Figure 4.3: Apoptosis kinetics – mean reflectance variation time series ... 96 Figure 4.4: Apoptosis kinetics – mean absolute value of reflectance variation time series ... 98 Figure 4.5: Spatially-resolved monitoring of confluent endothelial cell monolayer disruption ... 100 Figure 5.1: Combined MCWG and SEF imaging platform. ... 111 Figure 5.2: Vascular smooth muscle cell simultaneously imaged by MCWG and SEF. ... 113 Figure 5.3: Simultaneous monitoring of intracellular calcium by SEF imaging and cellular morphological response by MCWG imaging ... 115 Figure 5.4: Impact on ROCK inhibition during AT1 analyzed by MCWG and SEF microscopy. ... 118
ix
LIST OF ACRONYMS
Acronym Definition
AngII Angiotensin II
AT1R Angiotensin 1 Receptor
ATR Attenuated Total Reflection
CBB Cell-Based Biosensor
CBA Cell-Based Assays
CCD Charge Coupled Device
DNA Deoxyribonucleic Acid
FOV Field of View
GFP Green Fluorescent Protein
GPCR G-Protein Coupled Receptor
HEK293 Human Endothelial Kidney Cells
LOD Limit of Detection
LR-SPR Long-Range SPR
MCWG Metal Clad Waveguide
MCWGI Metal Clad Waveguide Imaging
NA Numerical Aperture
RI Refractive Index
ROCK Rho-Associated Protein Kinase
RWG Refractive Waveguide Grating
PAR1 Proteinase-Activated Receptor 1
SPR Surface Plasmon Resonance
SPRI Surface Plasmon Resonance
Imaging
SNR Signal-to-Noise Ratio
SP Surface Plasmon
SPEF Surface Plasmon Enhanced
TE Transverse Electric
TIRF Total Internal Reflection
Fluorescence
TRAIL Tumor Necrosis Factor-Related
Apoptosis-Inducing Ligand
TM Transverse Magnetic
11
CHAPTER 1
Introduction
1.1 Context and Research Problem
Recent developments in the fields of cell biology and pharmacology lead to an increased understanding of how cells sense and interact with their microenvironment and how intracellular signaling events play a major role in maintaining and regulating their functions. This knowledge triggered the development of whole new research fields such as synthetic biology, making it possible to genetically design novel organisms acting as living sensors systems [Levskaya et al., 2005], for therapeutic applications such as cancer therapy [Anderson et al., 2006] or for the commercial production of drugs [Paddon et al., 2013]. These systems, however, require a reliable detection technique (transducer) converting the changes in cellular activity triggered by external stimuli into quantifiable and measurable signals. Different transducer technologies have been developed, with the most widely used approach being the generation of fluorescent dyes (e.g. green fluorescent protein (GFP)) to detect specific signaling events or observe gene transcription [Tsien, 1998]. While highly sensitive to specific hallmarks during intracellular signaling, the use of gene transcription and synthesis of these dyes render such secondary readout mechanisms rather slow, putting the response time in the range of hours. Further, these markers have been reported to sometimes interfere with the cell response itself [Aizawa et al., 1997] and the signal reflects only a small aspect in a larger, more complex signaling cascade leading to the integrated functional response of the cell.
More recently label-free transducer technologies such as electrical impedance spectroscopy [Tiruppathi et al., 1992] and evanescent based technologies such as refractive waveguide grating (RWG) [Fang et al., 2006] and surface plasmon resonance (SPR) [Chabot et al., 2009] have successfully been applied to detect minute changes in cellular activity, providing insight in endothelial function [Benson et al., 2013], apoptosis [Arndt et al., 2004; Maltais et al., 2012] and G-protein coupled receptor (GPCR) signaling [Schröder et al., 2010; Scott & Peters, 2010]. These label-free platforms provide signals similar to classical approaches without the need of exogenous labels and allow for real-time quantification of cellular activity and function.
While highly sensitive, sensor signals of most label-free assays originate form a large number of cells (typically ranging from 100 to 4000). While cell populations are commonly assumed to behave homogeneously within a population, and there is an increasing body of evidence showing that even among genetically identical cells, distinct phenotypical sub-groups exist within a given population [Samadani et al., 2006; Slack et al., 2008]. Such phenotypical heterogeneity is involved in various physiological processes during development [Bahar et al., 2006; Colman-Lerner et al., 2005] or in pathological processes such as tumor heterogeneity [Campbell & Polyak, 2007]. However, label-free sensing technologies lack of a sufficiently high spatial resolution down to a single cell level. This hinders the detection of such heterogeneity and therefore these systems cannot detect phenotypical heterogeneity within a cell population. Evanescent field based sensing platforms such as RWG and SPR natively support imaging and have the potential to overcome this limitation. These methods have been applied to study receptor-ligand binding kinetics, detecting binding events happening at the very proximity of the sensor’s surface [Homola, 2003]. For example, most common SPR systems operated in the visible spectral range offer probing depths (defined as the distance at which the evanescent field amplitude decays to 1/e of its surface value) in the range up to 200 nm [Homola, 2003]. However, when probing microscopic sized objects such as cells, common structures of interest may be located higher up in the cell body (i.e. actin-cytoskeletal components > 100 nm; intracellular organelles > 200 nm). Thus, a system offering a deeper probing depth (> 200 nm) while maintaining individual cell resolution (< 10 μm) is desirable when one wants to reliably extract individual cell signaling activity.
Further complexity arises from the fact that label-free technologies rely on probing a certain physical property such as the refractive index in the case of evanescent field based assays. The measured cellular structures and organelles have distinct optical properties depending on their molecular density and distance within the probed volume, thereby contributing to varying degrees to the measured sensor signal. Thus, the obtained signal represents multiple intracellular structures, thus to delineate the contribution of individual signaling events and structural components within the signal can often be challenging. To overcome this challenge, evanescent field based methods offer another advantage due to their native support for fluorescence excitation similar to conventional total internal reflectance fluorescence (TIRF) microscopy. For
SPR this technique is termed surface plasmon enhanced fluorescence (SPEF) spectroscopy [Liebermann & Knoll, 2000]. Such a combined label-free and labeled based approach has been used to enhance the detection limits and specificity of biomolecular binding assays [Yao et al., 2004]. More recently, SPEF was also successfully applied to living cells, thereby visualizing the underlying structural components associated with the sensor’s signal within a large population of cells [Chabot et al., 2013; He et al., 2006, 2009]. While these studies demonstrate the feasibility of such a combined approach, the lack of high resolution imaging as well as the shallow probing depth limited these studies to structures in the very basal section of the cell and to large populations of cells.
1.2 Research Question and Objectives
To overcome these limitations, the central goal of this work was to develop a deep probing
depth evanescent field based imaging platform for simultaneous label-free and labeled based characterization of individual cell activity. The advantages of such a combined
approach were demonstrated by the visualization and quantification of individual cell activity for different cell types and applications. Such integral assessment of cellular activity ultimately allows one to monitor specific intracellular signaling events and structures, thereby delineating their impact on the obtained label-free sensor signal.
This goal was achieved by completing the following objectives:
1) Development of a high magnification imaging platform capable of discriminating individual cellular activity in both label-free and labeled based imaging modalities.
2) Optimize, fabricate and characterize deep-probe evanescent field based sensor chips. Such sensor chips must be operated at visible wavelengths for fluorescence excitation while maintaining a deep sensing depth and a high resolution to discriminate individual cells.
3) Detect heterogeneity within a cell population and demonstrate the systems’ sensing capabilities. Quantify cell-cell heterogeneity and characterize the impact of cellular features on the measured sensor’s signal.
4) Demonstrate the benefits of a combined label-free and labeled based sensing approach for simultaneous visualization and quantification of cellular activity, in order to delineate the specific underlying signaling events and structure leading to the sensor’s signal detected at a single cell level.
1.3 Thesis Organization
The document is structured in six chapters. After the introduction (Chapter 1), different fundamental concepts from the field of integrated optics form the basis for an overview on different label-free sensing technologies with a focus on evanescent field based sensing (Chapter 2). Further, the different design parameters are discussed in order to optimize the sensor chip and achieve deeper probing depth while maintaining a high spatial resolution using a special class of waveguides, namely metal clad waveguides (MCWGs).
Chapter 3 provides details on the developed imaging platform and the underlying optimization of MCWG based sensor chips. Simulation results are presented, showing how an informed choice was made to obtain the optimal sensor structure that allows for high resolution, deep penetration depth imaging. Further, experimental results are shown demonstrating the system’s imaging capabilities on both synthetic and biological samples. This chapter is presented as a scientific article which was published in Optics Express with the title of “Metal Clad Waveguide (MCWG) Based Imaging using a High Numerical Aperture Microscope Objective”.
Chapter 4 presents the application of the developed system on live cell sensing using the label-free sensing modality. Two applications are demonstrated with one focusing on intracellular events following the apoptotic response within an endothelial cell population. The second application shows how the additional information from the label-free imaging platform can be used to monitor cell monolayer integrity. This chapter is based on the scientific article published in Biosensors & Bioelectronics under the title “Label-free visualization and quantification of single cell activity using metal-clad waveguide (MCWG)-based microscopy”.
Chapter 5 combines both the label-free and labeled based imaging modalities for integrated visualization and quantification of individual cellular signaling activity. The capabilities of the system are demonstrated by visualizing the actin cytoskeleton within vascular smooth muscle cells. Individual cell signaling activity is quantified in HEK293-AT1R by following intracellular calcium levels using the fluorescent dye Fluo-8 upon activation of the Angiotensin 1 receptor by its ligand Angiotensin II. The involvement of different intracellular signaling cascades is probed and the advantages of such integral cell assessment are demonstrated. This chapter is based on the draft of a scientific article to be submitted to Biosensors & Bioelectronics under the title “Monitoring Individual Cell Signaling Activity using Combined Metal Clad Waveguide and Surface Enhanced Fluorescence Microscopy”.
The chapters 6 and 7 present a general discussion and conclusion of the different aspects realized during this work along with an outlook for potential further investigations.
17
CHAPTER 2
State of the Art
This chapter will introduce different concepts and topics to understand evanescent field based biosensors and their application to cell based biosensing. Initially, the field of integrated optics will be introduced with a focus given on dielectric slab waveguides. This section is followed by surface plasmon resonance (SPR), one of the most widely applied biosensing techniques nowadays. After SPR, a special class of waveguides, namely metal clad waveguides (MCWG), will be discussed. For both SPR as well as the MCWG, an overview of their current applications in biosensing, and in particular cell-based biosensing is given. Besides these two evanescent field based biosensing technologies, two other technologies have emerged for the label-free study of cell activity and behavior which will be briefly discussed following the MCWG section. Evanescent field based sensing technologies natively support microscopy and different imaging concepts have been proposed. These systems along with their application to cellular imaging will be discussed towards the end of this chapter. The chapter concludes by a brief description of how the evanescent field can be used to excite fluorophores and how a combination of label free and label based sensing complement each other in the assessment of cell activity.
2.1 Integrated Optics
The field of integrated optics is concerned with the phenomena of light guided along a thin dielectric film or strip. Since nearly all evanescent based sensor concepts involve some sort of guided light along various waveguide structures, it is important to introduce the underlying concepts of this field to understand the different aspects and behaviors of these sensing technologies.
2.1.1 Refraction, Reflection and Polarization of Light
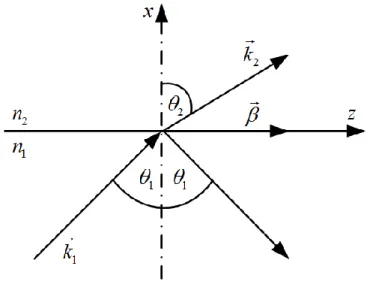
Let us consider an interface separating two lossless, isotropic, homogeneous dielectric materials with refractive index n1 and n2, respectively (Figure 2.1). Light travelling within one of the media undergoes repetitive scattering and re-scattering due to interaction with the medium itself. As such the medium induces repetitive phase shifts of the light which becomes apparent as the phase velocity of the light beam within the media changes compared to the speed of light in
vacuum. This change is expressed as the refractive index n of the media representing the ratio of the phase velocity (υ) inside the media compared to the speed of light (c):
r r
c
n and n
(0.1)
with εr being the relative permittivity and μr the relative permeability of the material. Note that most natural materials are non-magnetic at optical frequencies and thus μr ≈ 1 and n r [Hecht, 2002]. If the media is not vacuum and interacting with the light (n > 1) the result is a decreased wave speed. Certain materials (such as metals) do, however, not only alter the speed the wave travels within the media but also its amplitude (i.e. absorption). These materials therefore have a complex refractive index which can be expressed as:
2 2' "
r r i r n n ik
(0.2)
For such materials, the real part of the refractive index (n) represents the ratio of the speed light travelling inside the media with that of vacuum (0.1) while the imaginary part (k) provides information about the decay rate of the wave amplitude inside the media.
As shown in Figure 2.1 a light wave, with propagation direction indicated by its wave vector k1 , perpendicular to the wave fronts of a uniform, monochromatic plane wave with wavelength λ is incident at an angle θ1 to the interface (n1 > n2).
The amplitude of k is given as:
2
k
(0.3)
The light wave will be partially refracted and reflected at the interface and its exit angle θ2 is given by Snell’s Law:
1sin 1 2sin 2
n n (0.4)
1 sin( )1 k sin( )2 2
k (0.5)
While Snell’s Law provides the direction of the reflected and transmitted waves, it does not describe the amplitudes of these components. The amplitudes are dependent on the angle of incidence and the polarization of the light and is given by the Fresnel formulas. The polarization of the light gives the orientation of the electric and magnetic fields of the wave with respect to the plane of incidence (Figure 2.2). If the electric field is in the plane of incidence, the light polarization is transverse magnetic (TM). On the other hand, if the electric field is perpendicular to the plane of incidence, it’s polarization is transverse electric (TE). The Fresnel Equations yield the complex reflection and transmission coefficients (r and t) of the wave components and are dependent on their polarization:
Figure 2.2: Polarization of light. The direction of the electric field with respect to the plane of incidence (x,z) determines the polarization of the light. If the E-Field is in the plane of incidence it is referred to as transverse magnetic (TM). If it is perpendicular to the plane of incidence it is transverse electric (TE).
1 1 2 2 1 1 12 12 1 1 2 2 1 1 2 2 2 1 1 2 1 1 12 12 2 1 1 2 2 1 1 2
n cos n cos 2 cos
: r
n cos n cos n cos n cos
n cos n cos 2 cos
: r
n cos n cos n cos n cos
n TE and t n TM and t (0.6)
These equations describe the reflection and transmission coefficients at an interface as shown in Figure 2.1. These equations can be coupled to describe the reflectivity of a multi-layer stack based on the Abeles matrix method [Abelès, 1950]. Dr. Pierre-Jean Zermatten together with Dr. Vincent Chabot developed a MatLab program in the Biophotonics group of the University of Sherbrooke which is based on this formalism [Yeh, 2005]. The initial version of this code was further modified throughout this thesis and reflected light simulations presented throughout this thesis are based on this code.
2.1.2 Total Internal Reflection and the Evanescent Field
Using the Fresnel Equations (0.6), the reflected and transmitted light intensities for a monochromatic incident light wave can be calculated. Figure 2.3 shows such reflected and transmitted light intensities expressed as the reflectances ( 2 2
12 12
R r and R r ) and the
transmittances ( 2 2
12 12
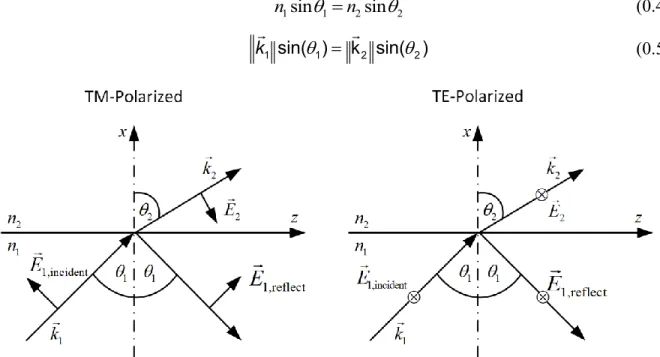
T t and T t ) for a glass/water interface (nGlass = 1.524, nWater = 1.336) for a monochromatic light wave (λ = 470 nm) as a function of the angle of incidence and polarization. While at lower angles of incidence most light gets transmitted (Figure 2.3 B) something interesting happens when θi approaches and exceeds the critical angle θc (e.g. 61.30° in this case, Figure 2.3 C). The angle of transmittance θt becomes 90° and all incident light is reflected back from the surface ( R 1), a phenomenon known as total internal reflection.
The wave in the top medium beyond the angle of TIR can be described by starting from the general expression for a plane wave with an angular frequency of 2 f :
( ) ( , , , ) ( , , ) j wt k r m E x y z t E x y z e (0.7) With ˆ ˆ ˆ ˆ ˆ ˆ x x y y z z x y z k k e k e k e r ze ye ze (0.8)
After solving Snell’s Law for the above case of TIR (complex with sin(θt) > 1), one finds that there exists a wave at the water/glass interface (E2) which can be described as [Hecht, 2002]:
2
( ,z)
2x j z m
E x
E e e
(0.9) where Em2 is the electric field amplitude, α is the decay rate of the wave along the x-axis and β is the propagation constant of the wave. Thus, an evanescent wave exists traveling parallel along the interface (along the z-axis, attributed by e j z in (0.9)) with an amplitude that exponentiallydecays away from to the interface (along the x-axis, attributed by e x in (0.9)).
Figure 2.3: Simulated reflected and transmitted light intensity as a function of the angle of incidence for a glass/water interface (nGlass = 1.524, nWater = 1.336) for a monochromatic light wave (λ = 470 nm) (A). B) For θi < θc Part of the light gets reflected back and part is transmitted into the water. C) At the critical angle θt becomes 90° and total internal reflection occurs. D) For angles above the critical angle θi = θr.
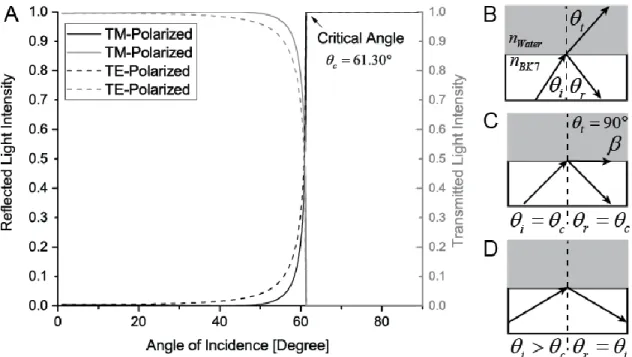
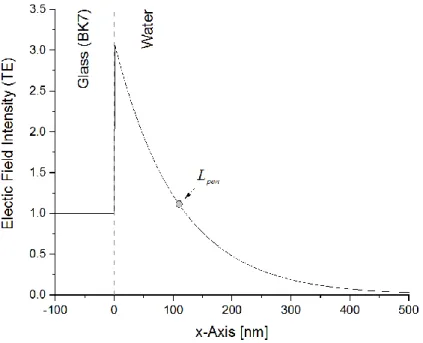
The electric field profile for such a water/glass interface is shown in Figure 2.4. Due to constructive interference of the incoming and reflected light at θc a small increase in the electric field amplitude can be seen [Liebermann & Knoll, 2000] at the interface which rapidly diminishes away from the glass surface. The depth with which the wave amplitude decays to 1/e (≈37 %) of the value at the interface is called the penetration depth, Lpen:
pen
1
L
(0.10)
where α is the decay rate of the wave amplitude along the x-axis. For the visible spectra it lies typically within hundreds of nanometers away from the interface. The evanescent wave and its penetration into the dielectric (i.e. water in the example above) is of central importance for optical sensors and will be part of deeper discussions later on.
Figure 2.4: Simulated electric field intensity profile for a glass water interface at an angle of incidence of 65° (nGlass = 1.524, nWater = 1.336) for a monochromatic light wave (λ = 470 nm). The electric field amplitude rapidly diminishes in the water. The depth where it decreased to 1/e of its value at the interface is indicated as the penetration depth (gray dot, Lpen = 109 nm)
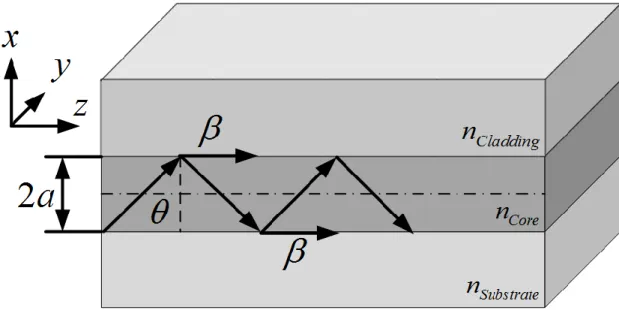
2.1.3 Dielectric Slab Waveguides
If a thin, high refractive index dielectric layer is placed on top of the glass substrate, this dielectric slab can then act as the simplest form of an optical waveguide. Figure 2.5 shows a schematic of such a dielectric slab waveguide. It consists of a thin core layer and two semi-infinite volumes surrounding the core layer namely the substrate and the cladding, respectively. For the structure to act as a waveguide the refractive index of the core must be higher than that of the substrate and the cladding (ncore > nSubstrate ≥ nCladding).
For θ < θc the light is only partially reflected (Figure 2.3 B) and a part will escape the dielectric slab through the cladding or the substrate, respectively. Such modes are also referred to as radiative modes. For the case of TIR at each interface (θ > θc) the light can be guided as shown in Figure 2.5. However, not all θ > θc, but rather a discrete set of θ will result in so called guided modes. To obtain the θ for which guided modes exists one has to have a look at the phase shifts (φ) imposed on the reflected light for each reflection at the interface [Tamir, 1975]:
2 j
Re (0.11)
The polarization dependent phase shifts are given by the Fresnel equations as:
Figure 2.5: Schematic of a dielectric slab waveguide. A thin dielectric layer of a higher refractive index (nCore) forms the core of the waveguide and is surrounded by two semi-infinite volumes having lower refractive indices (nSubstrate and nCladding).
2 2 2 ./ . 2 2 2 2 ./ . 2 ./ . sin ( ) n tan( ) cos sin ( ) n tan( ) cos Core Sub Clad TE
Core
Core Sub Clad Core
TM
Sub Clad Core
n n n n n n (0.12)
For the structure shown in Figure 2.5, a phase shift of kncore2 cos( )a for each transverse passage
(core/cladding and core/substrate) results in two phase shifts of 2Core Clad/ . and 2Core/Sub.,
respectively. For constructive interference and a guided mode to exist, the sum of these phase shifts has to be a multiple of 2π. Thus, the self-consistency condition can be expressed as [Tamir, 1975]:
4kncoreacos
2
substrate 2
core 2
(0.13) where ν is an integer (0,1,2…) and is called the mode number. From Equation (0.13) the propagation constant (β) of the guided modes for this structure can be derived and is given as:2
*sin( )
eff eff eff Core
kn n with n n
(0.14)
The effective refractive index (neff) determines the velocity of the guided light of the mode.
If, for example, a thin (2a = 500 nm) high refractive index dielectric (i.e. a photoresin such as KMPR, nCore = 1.58) is deposited in between the glass and water volumes, such a structure can act as a waveguide for a monochromatic wave (λ = 470 nm). The propagation constant of the mode can be calculated from Equation (0.14) using numerical tools or mode solvers (e.g. MatLAB or FIMMWAVE). Using this approach, the effective index for the first order modes presented in Figure 2.6 was determined to be neff,TM = 1.5502 and neff,TE = 1.5526, respectively. For a given thickness of 500 nm, only one single solution is found for each polarization and the waveguide is referred to as a single mode waveguide. Having determined the propagation constant of the modes, the electric field along the x-axis can also be calculated [Pollock & Lipson, 2003]. Figure 2.6 shows the electric field amplitude across the three layer stack (Glass/KMPR/Water). Since nSubstrate ≠ ncladding the resulting electic field profile is asymmetric, with a larger portion of the energy in the cladding with the higher refractive index (i.e. glass) and the waveguide is called an asymmetric dielectric slab waveguide. As with TIR, an electric
field penetrates in the cladding volume (water and glass) evanescently decaying along the x-axis. In the following, two biosensing techniques will be discuhat utilize this phenomenon to detect binding of biomolecules and follow cellular activity as evanescent field based biosensors.
2.2 Surface Plasmon Resonance (SPR)
Following the discovery of abnormalities in the absorption spectra of polychromatic light from a metallized diffraction grating by Wood in 1902 [Wood, 1902], it was not until 1968 that the effect of surface plasmon resonance was understood simultaneously by Otto and Kretschmann [Kretschmann & Raether, 1968; Andreas Otto, 1968]. In the early 1980s, Liedberg and Nylander were the first to demonstrate that SPR could be used for both gas and biomolecular sensing applications[Bo Liedberg et al., 1983; Nylander et al., 1982]. This lead to the launch of the first commercial SPR platform in 1990: the BIAcore [B Liedberg et al., 1995]. Over the past decades
Figure 2.6: Simulated E-Field profile for a dielectric slab waveguide. A thin high refractive index dielectric layer (KMPR, nCore = 1.58) forms the core of an asymmetric dielectric slab waveguide in between a glass substrate (BK7, nSubstrate = 1.52) and water (nCladding = 1.33).
and following the initial proofs of concept, SPR was applied to a wide range of applications as a label-free sensing approach in the fields of chemistry, engineering and biology.
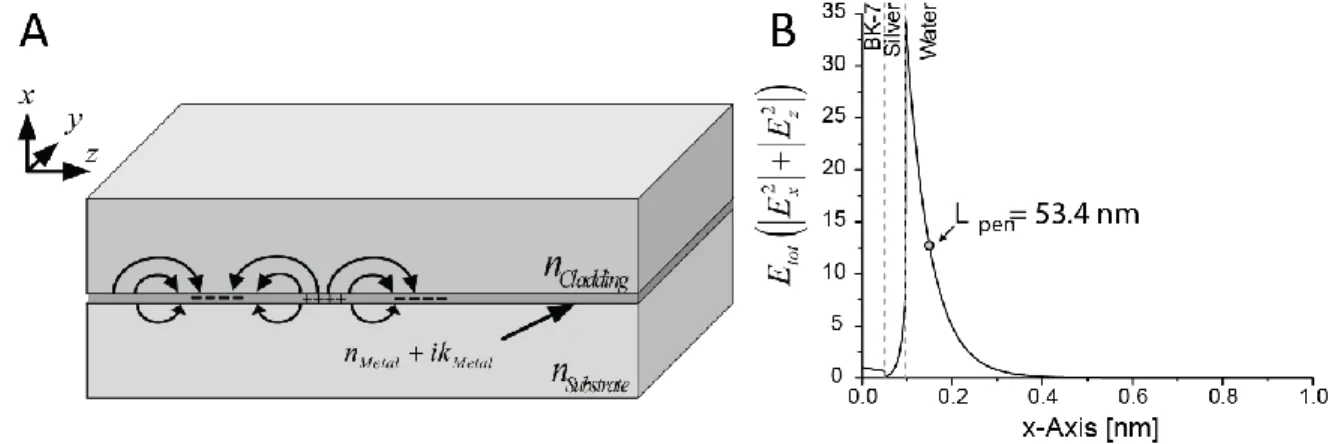
2.2.1 Definition of Surface Plasmons
A surface plasmon (SP) is a charge density oscillation at the interface between a metal film and a dielectric [Barnes et al., 2003]. Solving Maxwell’s equations with the appropriate boundary conditions yields the frequency dependence of the complex SP propagation constant [Jirí Homola, 2006] : 3/2 0 2 0 ' '' ' ' '' i k ' 2( ' ) ' M D M M D plasmon M D M M D i k (0.15)
where β’ and β’’ are the real and imaginary parts of the propagation constant, k0 represents the free space light wave vector, εM and εD are the permittivity of the metal and dielectric, respectively. For a guided mode (called the surface plasmon mode or simply surface plasmons) to exist, the real parts of the metal and the dielectric permittivity must have opposite sign for SP to occur at the interface [Jirí Homola, 2006]. Note that surface plasmons are a surface mode with exponential decay of the field on each side of the interface. Several metals meet these conditions (permittivity with negative real part) at visible wavelengths such as Au, Ag and Cu, with Au being the one most commonly used in sensing applications due to its chemical stability and sensitivity [Homola, 2003]. Note that a metal/dielectric interface only support a mode for
Figure 2.7: SPs at a metal/dielectric interface A. Surface plasmons are charged density oscillation at the metal/dielectric interface. B. Simulated total electric field profile for a BK7/46 nm Ag/Water structure exited at 470 nm. The electric field sharply diminishes in the dielectric layer (water).
TM polarized light (Figure 2.7A). The guided surface wave character of the SP leads to an electric field normal to the interface, which decays exponentially away from the interface (Figure 2.7B) [Homola, 2003]. As the propagation constant of the surface plasmon mode has a non-zero imaginary part, it exhibits attenuation. This attenuation is defined as the distance L
in direction of propagation at which the energy of the mode decays to 1/e of its steady-state value [Jirí Homola, 2006]:
1 2 ''
L
(0.16)
The finite attenuation length has great consequences for the use of surface plasmon based imaging techniques, effectively reducing the achievable lateral resolution for such systems. This will be part of a deeper discussion in Section 2.4.2.
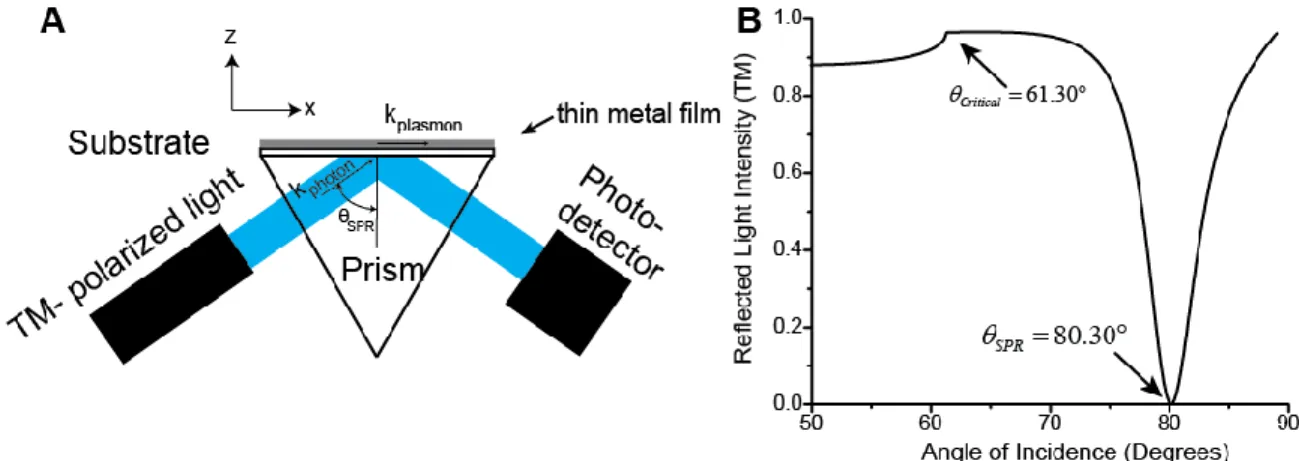
2.2.2 Excitation of Surface Plasmon Resonance
To excite surface plasmon resonance, the wave vector of the incident light has to match the SPR wave vector. The most widely used coupling technique is based on a so-called attenuated total reflection (ATR) technique first demonstrated by Kretschmann [Kretschmann & Raether, 1968]. In this configuration, the incident light is reflected at an angle superior to the critical angle at the interface between a high refractive index prism and the bottom side of a thin metal layer. Under phase-matching conditions, the light evanescently tunnels through the metal layer and the TM polarized part of the light excites SPs on the opposing metal surface. The magnitude of the wave vector component along the x-axis of the incident light is:
2 sin Photon ATR p k n (0.17)
where λ is the wavelength of the incident light, np is the refractive index of the prism and θ is the angle of incidence.
A schematic of the ATR coupling technique is shown in Figure 2.8A. TM- polarized light is reflected at an angle superior to the critical angle and the reflected light intensity is recorded by a photodetector. A simulation of the reflected light intensity for a BK7/46 nm Ag/Water stack as a function of the angle of incidence is shown in Figure 2.8B. When θ approaches θc a similar effect can be observed as in TIR and the light intensity increases reaching a maximum at θc. Unlike in TIR, for θ > θc a sharp drop in light intensity becomes visible, reaching a minimum in intensity at θSPR. At this angle kPhotonATR'Plasmon and critical coupling is achieved. From (0.15)
together with (0.17) the critical coupling angle θSPR can be written as:
2 1 2 1 sin ( M D ) SPR p M D n n n (0.18)
It is important to note that θSPR is strongly dependent on the refractive index of the dielectric (nD) above the thin metal layer. Any variation in nD will directly translate into a variation of θSPR. Since biomolecules and cells exhibit a refractive index larger than water, SPR can be used to detect changes of biomolecular contents at the metal/dielectric interface forming the underlying principle of SPR based biosensing.
Figure 2.8: Excitation of SPR using ATR coupling technique A Schematic of an ATR based SPR setup. TM-polarized light is reflected at an angle superior to the critical angle from an interface between the prism and a metal layer. The reflected light intensity is recorded by a photodetector. B Simulated reflected light intensity as a function of the angle of incidence for a BK7/46 nm Ag/Water stack exited at 470 nm. Both, the critical angle and the coupling angle for SPR are indicated.
2.2.3 Surface Plasmon Resonance Biosensing
In conventional SPR, biorecognition elements (ex: antibodies, ligands, etc.) are immobilized on the metal surface. Analyte molecules in the fluid can then specifically bind to the biorecognition elements, producing an increase in refractive index at the sensing surface, thereby generating a shift in θSPR, detectable by the system.
Binding events can be measured without the need for any labeling of the analyte molecules (Figure 2.9A). Moreover, by keeping the angle of incidence constant and following the reflected light intensity changes, the binding kinetics can be observed in real time (Figure 2.9B). Once equilibrium is reached, the shift in the dip of the SPR spectra can be converted into the analyte molecule concentration on the surface [Tumolo et al., 2004]. SPR biosensors can be tailored for the detection of any analyte if a biomolecular recognition element is available. SPR does not require fluorescent or radioactive labels. Furthermore, unbinding of an analyte can also be observed, enabling the detection of the recovery of the sensing layer, making continuous monitoring possible. These features helped SPR to become an established method to study a broad range of bimolecular interactions such as: antibody-antigen [Fägerstam et al., 1990], receptor ligand [Ward et al., 1995] nucleic acid-nucleic acid [M. Yang et al., 1998]and nucleic acid-protein [Fisher et al., 1994] and with more than 20.000 PubMed listed publications so far.
Besides the characterization of molecular interactions, more complex biorecognition elements have been used such as, artificial cell membranes [Knoll et al., 2000] and whole biological organisms such as bacteriophage [Balasubramanian et al., 2007]. In drug screening or medical Figure 2.9: Impact of refractive index changes in close proximity to the metal surface that change coupling conditions (A). When light is incident at a fixed angle of incidence and the reflected light intensity is recorded, refractive index changes can be followed in real-time (B).
diagnosis, however, single biomolecule interactions are only a small part of a complex functional process. This illustrates the necessity to shift from single biomolecule detection methods to more complex, functional biorecognition elements such as whole cells.
2.2.4 Living Cell-Based Surface Plasmon Resonance Biosensing
There is an increased interest in biosensors using living cells, since such assays can be used for functional diagnostics. A cell-based biosensor (CBB) uses living cells as a biorecognition elements. External stimuli (e.g. environmental, food or blood samples) change the cellular microenvironment and trigger distinct cellular responses (Figure 2.10) [Banerjee et al., 2008; Bernard et al., 2014; Ziegler, 2000]. These changes in the cell can be correlated to analyte composition and are used to report for example live pathogens, active toxins or cytokines [Banerjee & Bhunia, 2009]. CBB have the advantage of providing insight into physiological effects of the analyte at different levels (organelle, cellular or tissue) [Pancrazio et al., 1999]. In the past decade, different cell-based assays (CBA) have been developed to detect changes in
cellular physiology [Ziegler, 2000]. Some, for example, utilize changes in the metabolic response of cells by measuring change in oxygen or glucose consumption, while others detect the metabolic end-products such as lactic acid secreted from the cells into the media [Rawson et al., 1989; Ziegler, 2000]. While such assays rely on the detection of secondary cellular
markers, rendering their response rather slow, other CBAs follow cellular responses in real-time. Conductivity assays have been used, exploiting the electrical resistance of a cell monolayer in order to measure cell-cell and cell substrate interactions [Lo et al., 1993] which is presented in more details towards the end of this chapter. Other transducers such as quartz crystal microbalance (QCM) [Marx et al., 2001] and field effect transistors (FET) [Sakata & Sugimoto, 2011] were also proposed.
More recently, optical based transducer techniques such as optical gratings and SPR were found to be sensitive tools to follow cellular responses in real-time, without any need for labeling with exogenous markers [Chabot et al., 2009; Scott & Peters, 2010]. The high sensitivity of SPR, along with the capability for fluorescence using SPEF and the potential application for single cell imaging and endoscopic instruments make this transducer technique a valuable tool for clinical diagnosis [Yanase et al., 2014]. SPR based CBA have successfully been applied for the detection of allergens [Het al., 2002; Yanase et al., 2010] and to study the therapeutic effect of drugs [Kosaihira & Ona, 2008; Nishijima et al., 2010]. Our group further developed multiple SPR based CBA utilizing cells for the detection of pro-apoptotic factors, toxins and hormones [Chabot et al., 2009; Cuerrier et al., 2008; Maltais et al., 2012].
One potential limitation of SPR based CBA is the penetration depth which lies within the hundreds of nanometers range. This results in a relatively shallow sensing depth when it comes to measuring responses of living organisms such as cells and bacteria that are in the range of micrometers in size. It is therefore beneficial to achieve a deeper SPR penetration depth to maximize the molecular content within the evanescent field of the organism under study. To overcome these limitations, a “hybrid” structure between a dielectric slab waveguide and SPR, namely metal clad waveguides, can be used.
2.3 Metal Clad Waveguides (MCWGs)
Metal clad waveguides were first described shortly after SPR in the early 70’s [Kaminow et al., 1974; Reisinger, 1973] and were initially applied as polarizers and mode filters [Suematsu et al., 1972]. Besides the term MCWGs, multiple other terminologies have been used throughout the literature to describe essentially the same structures such as metal clad leaky waveguides
(MCLWs) [Mohammed Zourob et al., 2003; Mohammed Zourob & Goddard, 2005], coupled plasmon-waveguide resonance (CPWR) [Salamon et al., 1997; Salamon & Tollin, 2001], plasmon-waveguide resonance (PWR) sensors [Abbas et al., 2011] and guided wave surface polarizations (GWSP) [Herminghaus & Leiderer, 1989]. Throughout this work, the term MCWG will be used with respect to their sensing capabilities, MCWGs have seen less attention throughout the last decades compared to SPR, and their applications focused mainly on gas sensing [Herminghaus & Leiderer, 1989; Osterfeld et al., 1993; A. Otto & Sohler, 1971; Podgorsek et al., 1997; Podgorsek & Franke, 1998]. More recently, MCWGs were also applied in biosensing and, due to their advantages in terms of evanescent field penetration depth, applied to larger objects such as cells and bacteria [N. Skivesen et al., 2007; M Zourob et al., 2005; Mohammed Zourob et al., 2003].
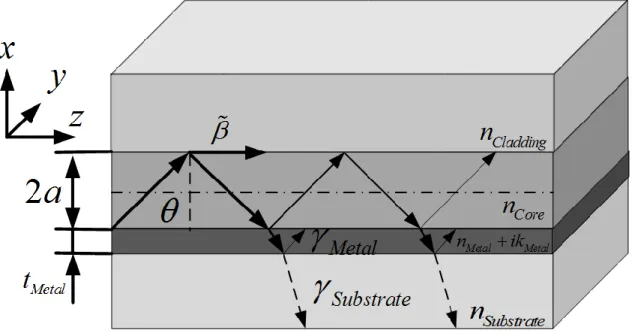
2.3.1 Definition of Metal Clad Waveguides
A MCWG is similar to a dielectric slab waveguide with the only difference being that a thin metal layer forms the lower cladding. A schematic of a MCWG is shown in Figure 2.11. As most common metals (e.g. Ag, Au, Al, Cr and Ni) have large imaginary components of their
Figure 2.11: Schematic of a MCWG. The basic setup of a MCWG sensor chip is similar to that of a classical dielectric waveguide with the only difference being a thin metal layer as the substrate. Due to the complex refractive index of the metal (nMetal+ikMetal) absorption losses (γMetal) and radiation losses (γSubstrate) render the mode lossy.
refractive index in the visible spectra [Johnson & Christy, 1972], they introduce high losses for the light propagations in such structures (γMetal, Figure 2.11). To study the propagation of waves in such structures, the same analysis as in Section 2.1.3 can be applied, just that now the complex refractive indices are used to account for the losses in the metal layer. If a high refractive index substrate is used, as it is the case with the ATR coupling technique, a small portion of the guided light back-couples into the substrate leading to additional damping losses for the guided mode (γSubstrate) [Jirí Homola, 2006]. Thus, such modes are often referred to as leaky modes. This leads to a complex propagation constant of the mode
'
i
''
, where β” accounts for the propagation losses (γMetal and γSubstrate) of the waveguide. The same discussion of the complex propagation constant for SPR is also valid for MCWGs. Using numerical tools, one can calculate
for these structures. All calculations involving the characteristics of MCWG were obtained using the FIMMWAVE (Photon Design Inc., V6.3.1 (x64)) software.2.3.2 Characteristics of MCWG Sensor Chips
MCWG based sensor chips are highly flexible in terms of their sensing characteristics and can be tailored to suit different sensing needs. Starting from the SPR structure introduced in
Figure 2.12: Guided modes effective index for a MCWG as a function of core thickness. Beyond a minimum dielectric core thickness (cutoff thickness), it is capable of supporting guided modes. With increasing thickness, the effective index of the guided mode also increases and more modes are supported by the structure.
Section 2.2.1, a high refractive index dielectric (e.g. photoresist KMPR) is deposited on top of the thin metal layer (tAg = 50 nm). Depending on the thickness of the dielectric core layer, an increasing number of guided modes is supported by the MCWG structure. Figure 2.12 shows the real part of the effective refractive index (neff) of each individual mode as a function of core thickness. The minimum core thickness, termed the cutoff thickness, (e.g. 130 nm for TE0 and 225 nm for TM0), is needed for the structure to support a single mode in TE or TM. With increasing core thickness more guided modes are supported and the structure acts as a multimode waveguide. Furthermore, the effective index of the modes gradually increases with increasing core thicknesses. The core thickness determines the sensing characteristics of the MCWG structure.
If, for example, a KMPR core layer of tKMPR = 500 nm is selected, the MCWG supports two guided modes in TM (TM0 and TM1) and one mode in TE (TE1). Using the ATR prism coupling technique as introduced in Section 2.2.2, light can be coupled into the individual modes and Figure 2.13 shows simulated reflected light intensities for the MCWG and compares them to the SPR sensor chip introduced above. While the SPR sensor chip supports only one TM mode (θSPR = 80.30°, Figure 2.13A), two TM-modes are observed in the MCWG structure (θMCWG,TM0 = 82.10° and θMCWG,TM1 = 61.60°, Figure 2.13A). Further, in contrast to SPR, MCWG also support TE modes (θMCWG,TE1 = 66.30°, Figure 2.13B) which can be used to provide additional insight into the optical anisotropy of samples [Salamon & Tollin, 2001].
In terms of resolution, one striking feature when comparing the reflectance dips of SPR and MCWG is how “sharp” the MCWG dips appear. This characteristic is quantified by the full width half max (FWHM) of the dip. SPR has a FWHMSPR = 18.30° which is much larger compared to the MCWG modes with FWHMMCWG,TM0 = 0.328° and FWHMMCWG,TM1 = 0.145°, respectively. Depending on the underlying detection system, the dip shape has a great impact on the sensitivity of the sensor. If the system is based on angular interrogation and reflected light intensity is the measured signal (as it is the case for the system developed during this thesis), the FWHM has a direct impact on the resolution of the system [Nina Skivesen et al., 2005]. Changes in the refractive index of the dielectric cladding will ultimately change the effective refractive index of the mode, thereby shifting the dip position. If the angle of incidence is kept constant such changes directly translate to variations of the reflected light intensity. Figure 2.14 demonstrates this principle for SPR and MCWG for a small change of the cladding refractive index (Δnc = 0.001). Such a refractive index (RI) step leads to a small change in Figure 2.13: Simulated reflected light intensity for a SPR (BK7/50 nm Ag/ Water) and MCWG (BK7/50 nm Ag/500 nm KMPR/ Water) structure for TM (A) and TE (B) respectively. Only the fundamental TM mode is observed for SPR, while two TM modes and one TE mode are supported by the MCWG structure.
reflectance for SPR (ΔRSPR = 0.064). In MCWG it is slightly larger for the MCWG-TM0 mode (ΔRMCWG,TM0 = 0.090) and much larger for the MCWG-TM1 mode (ΔRMCWG,TM1 = 0.456). The difference between the MCWG-TM0 and MCWG-TM1 modes is explained by how close these modes are to their cutoff. To achieve highest sensitivity, MCWG are best operated very close to their cutoff thickness [Nina Skivesen et al., 2005] and, as shown in Figure 2.14, a given change in refractive index will lead to the largest change in reflected light intensity for the MCWG-TM1 because it is closest to cutoff. In the context of imaging, this characteristic of MCWG sensors is also very interesting and will be discussed in more detail in the next section.
Another important sensing characteristic of MCWGs is the penetration depth of the electric field into the dielectric above the core layer. The penetration depth determines how deep the sensor can “sense” into the dielectric above the surface. Above this penetration depth, changes in the dielectric will only marginally impact the signal and the sensor is effectively “blind”. For classic
Figure 2.14: Change in reflectance for Δnc = 0.001. A small FWHM leads to a larger increase in reflected light when the refractive index of the cladding changes and allows for an easier estimation of the dip minimum.
biomolecular assays (e.g. antibody-antigen), binding events occur within tens of nanometers of the surface and, for such an application, a shallow penetration depth is beneficial to strongly confine the electric field within the binding region as it is the case in SPR (see Figure 2.7B). The sensor’s sensitivity to surface events is termed adlayer sensitivity. In contrast, when micrometer sized objects such as bacteria and cell are of interest, RI changes may occur much further away of the sensor’s surface within the cell or bacteria. In such an application, it is important to penetrate as deeply as possible into the dielectric above the surface to maximize the sensitivity into the bulk (bulk sensitivity). Figure 2.15 shows the electric and magnetic field profiles throughout the MCWG sensor structure. A penetration depth into the water of around 50 nm is observed for the MCWG-TM0 compared to more than 400 nm for the MCWG-TM1 mode. Again, depending on how close the mode is to its cutoff determines the penetration depth, with the deepest penetration depth achievable closest to the cutoff (MCWG-TM1).
Interestingly, similar to SPR, in MCWG the field is greatly enhanced (Figure 2.15). In MCWG, however, the electric field enhancement due to the metal can further be enhanced. The field enhancement is around 30 times at the silver/KMPR interface for the MCWG-TM1 mode. These field enhancements have been utilized to excite different molecular probes and have been utilized for surface enhanced raman spectroscopy [Chen et al., 1976; Nemetz & Knoll, 1996]
Figure 2.15: Simulated E and H-Field profiles through the MCWG structure. The field has a strongly asymmetrical shape with a larger portion of the field in the dielectric cladding compared to the metal. The closer the mode is to its cutoff, the deeper the penetration depth. Further, MCWG can be used as an additional enhancement of the electric field from the thin metal layer.
and surface enhanced fluorescence spectroscopy [Fort & Grésillon, 2008; Liebermann & Knoll, 2000; Yu et al., 2003] with the latter being further discussed towards the end of this chapter.
Taken together, depending on the dielectric core material used and on the dielectric core thickness chosen, MCWGs can be tailored to achieve deep penetration depth, a high bulk sensitivity, and a significant electric field enhancement. When operated close to their cutoff, these capabilities make them well suited to study larger objects such as cells and bacteria.
2.3.3 Cell Based Biosensing with Metal Clad Waveguides
Initially MCWG sensors were applied to characterize artificial lipid bilayers and their improved sensitivity was demonstrated [Salamon et al., 1997]. Interestingly, it was found that the use of both TM and TE modes is beneficial to characterize anisotropy and helps to reliably determine the optical parameters of complex biological samples [Salamon & Tollin, 2001]. Their capability for deep penetration depth was applied to the detection of bacteria and yeast cells [M Zourob et al., 2005; Mohammed Zourob et al., 2003] and a nearly threefold signal increase for these cells and a twofold increase in the corresponding fluorescence signal was observed when compared to SPR. MCWG have also been employed to study mammalian cells and their growth could reliably be followed using MCWGs operated in TM and TE modes [N. Skivesen et al., 2007]. The TE mode was found to exhibit a slightly higher sensitivity compared to TM. Interestingly, more recently a study applied the concept of MCWG slightly differently and used a confluent epithelial cell monolayer as the dielectric core layer [Yashunsky et al., 2012, 2013]. Since the cells themselves have a slightly higher refractive index than their surrounding media, and given they form a tightly interconnected monolayer, they were found to be capable of guiding light in the infrared. The authors demonstrate this by utilizing their technique to sense thickness variations within the monolayer and monolayer disruption due to bacteria.
Different groups demonstrated the label-free detection of cellular activity by both SPR and more recently by MCWGs. These studies provided insight into cellular activity and growth and could show the advantage of label-free evanescent field based biosensing to study large populations of living cells. Nevertheless, while cell populations are often assumed to respond homogeneously, there is growing body of evidence about phenotypic heterogeneity within cell
populations [Samadani et al., 2006; Slack et al., 2008]. To study such underlying heterogeneity within a cell population in a label-free modality, individual cells on top the sensor’s surface must be resolved. Evanescent field based technologies have the advantage that they inherently support imaging. Thus, it is possible to utilize SPR and MCWG based sensors to study individual cells, a technique called evanescent wave microscopy.
2.4 Evanescent Wave Microscopy
If the photodetectors in the ATR coupling technique are cameras, and imaging optics are installed in the reflected light path, the 2D light intensity distribution of the coupled light can be determined. This allows one to spatially resolve the refractive index distribution at the sensor’s surface. Depending on the underlying sensor’s principle, this technique is termed surface plasmon resonance imaging (SPRI) or metal clad waveguide imaging (MCWGI). Different concepts have been proposed to achieve high resolution imaging of nanoparticles and biological samples or large field of view (FOV) for high throughput multiplexing. These concepts will now be introduced and discussed in terms of their resolution and imaging capabilities.
2.4.1 Principle and Concepts
The effective index of the guided mode and its wavevector will depend on the refractive index of the cladding. Thus, spatial variations in the cladding index (e.g. by biological media) will cause a corresponding spatial variation in the mode wavevector, which in turn will result in spatial variation of coupling conditions and reflected light intensity measured by the camera (Figure 2.16A). Figure 2.16B shows simulated reflected light intensities for the different regions (Water and PDMS). At a given angle of incidence (e.g. θTM0/Water = 82.1°) critical coupling is achieved for water and the reflected light intensity drops in the regions where water is present on the sensor’s surface (Figure 2.16B, black trace) and the image would appear dark in these regions. The reflected light intensity for regions with PDMS on the other hand does not show a drop in the reflected light intensity at this angle of incidence (Figure 2.16B, grey trace) because the incident light is not coupled to the mode and the image would appear bright in these regions.