O
pen
A
rchive
T
OULOUSE
A
rchive
O
uverte (
OATAO
)
OATAO is an open access repository that collects the work of Toulouse researchers and
makes it freely available over the web where possible.
This is an author-deposited version published in :
http://oatao.univ-toulouse.fr/
Eprints ID : 19235
To link to this article : DOI :
10.1016/j.dib.2017.07.028
URL : http://dx.doi.org/10.1016/j.dib.2017.07.028
To cite this version :
Kumar, Sunil and Maury, Francis and
Bahlawane, Naoufal Optical and morphological properties of
thermochromic V 2 O 5 coatings. (2017) Data in Brief, vol. 14. pp.
348-353. ISSN 2352-3409
Any correspondence concerning this service should be sent to the repository
administrator:
[email protected]
Data Article
Optical and morphological properties
of thermochromic V
2
O
5
coatings
Sunil Kumar
a, Francis Maury
b, Naoufal Bahlawane
a,⁎a
Luxembourg Institute of Science and Technology (LIST), 5 avenue des Hauts-Fourneaux, L-4362 Esch-sur-Alzette, Luxembourg
bCIRIMAT, ENSIACET-4 allée E. Monso, 31030 Toulouse, France
a r t i c l e
i n f o
Article history: Received 4 July 2017 Accepted 12 July 2017 Available online 14 July 2017
a b s t r a c t
We present optical and morphological characterizations per-formed on thermochromic V2O5 coatings. V2O5 coatings were
obtained by oxidation of as-deposited VOx films. Comparisons were made among coatings oxidized at various temperatures. Photographic evidence is also shown to provide the reader a clear visual description of the color change that occurs during thermo-chromic process. Detailed study and analysis regarding this data can be found in Kumar et al. (2017, in press)[1,2].
&2017 The Authors. Published by Elsevier Inc. This is an open access article under the CC BY license (http://creativecommons.org/licenses/by/4.0/).
Specifications Table
Subject area Physics, Material science More specific
subject area
Thermochromic oxides, chemical vapor deposition Type of data Graph, figure
How data was acquired
1) Total hemispherical reflection (THR) measurements were carried out on LAMBDA
1050 UV/Vis/NIR spectrophotometer from Perkin Elmer with a 150 mm integra-tion sphere in the reflecintegra-tion configuraintegra-tion.
Contents lists available atScienceDirect
journal homepage:www.elsevier.com/locate/dib
Data in Brief
http://dx.doi.org/10.1016/j.dib.2017.07.028
2352-3409/& 2017 The Authors. Published by Elsevier Inc. This is an open access article under the CC BY license (http://creativecommons.org/licenses/by/4.0/).
DOI of original article:http://dx.doi.org/10.1016/j.mtphys.2017.06.005
⁎Corresponding author.
2) The film thickness and roughness were measured using an Alpha step d-500
Profilometer from KLA-Tencor
3) Temperature was controlled by placing the sample on a custom made heating
stage with a K type thermocouple for temperature measurement and regulation. Data format Treated and analyzed
Experimental factors
Silicon substrates have been cleaned in Ethanol and later cut into smaller pieces before annealing at different temperatures.
Experimental features
Very brief experimental description Data source
location
Belvaux, Luxembourg
Data accessibility The data are available with this article
Value of the data
!
The data on visible thermochromic behavior of V2O5 coatings provides other researchers anexhaustive view of various methods used to show the thermochromic behavior.
!
The data can be used by other researchers to compare and verify and improve further on the tunability of V2O5thermochromism.!
This data will be helpful to the scientific community who wishes to use oxygen vacancy generation in metal oxides as a technique to change the optical properties1. Data
V2O5 coatings show a linear increase in the surface roughness with temperature. Fig. 1
(i) shows the plot of surface roughness versus oxidation temperature andFig. 1(ii) shows the roughness profile of the coatings obtained by oxidation at (a) 350 °C, (b) 450 °C and (c) 550 °C over a scanning distance of 0.8 mm.
The brightness of the coatings is defined as the total area under the curve over the full range of visible spectrum (400–800 nm). The curve plotted with brightness versus oxidation tem-perature shown inFig. 2has a bell curve profile with maximum at 450 °C and a brightness of 50%.
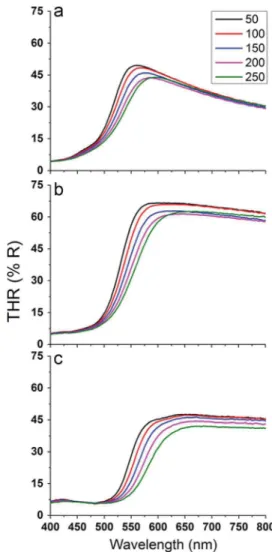
Temperature-dependent optical spectra in the visible region are shown inFig. 3for coatings obtained by oxidation at (a) 350 °C, and (b) 450 °C and (c) 550 °C respectively.
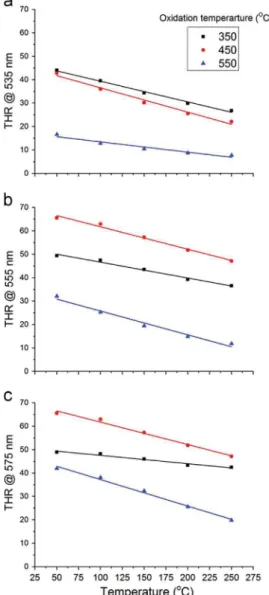
THR at specific wavelengths like 535 nm, 555 nm and 575 nm was compared among the films obtained by oxidation at 350 °C, 450 °C and 550 °C inFig. 4. LastlyFig. 5shows the photographic images of thermochromic V2O5coatings at both room temp and 300 °C
2. Experimental design, materials and methods 2.1. Preparation of V2O5coatings
Thin films of vanadium oxide were deposited on silicon substrates by Direct Liquid Injection (DLI) Metal Organic Chemical Vapor Deposition (MOCVD), the details of which are reported elsewhere[1,2]. Argon was used as the carrier gas at a flow rate of 50 sccm while the chamber pressure was adjusted to 10 mbar. Substrates were maintained at a constant temperature of 500 °C during the four hours of deposition.
After deposition, samples were allowed to cool till room temperature in argon atmosphere at low pressure before withdrawing from the chamber. Further handling of the samples was car-ried out under ambient atmosphere. Post deposition annealing was performed under ambient
air at 300–580 °C. The annealing time was adjusted to allow a complete oxidation from VOx to V2O5. While 10 min were sufficient for oxidation at 550 °C, significantly longer times were
required at lower temperatures; this can be explained by simple temperature dependent oxi-dation kinetics.
To isolate V2O5coatings form atmospheric gas phase interactions, Atomic layer deposition
(ALD) of Al2O3was performed using the sequential introduction of Trimethylaluminium (TMA)
and water. The pulse times for each reactant were adjusted to 40 ms with a 15 s purge in between each pulse. The rather large pulse and purge times were chosen to achieve complete conformal coverage over the film.
2.2. Film characterization
Total hemispherical reflection (THR) measurements were carried out on LAMBDA 1050 UV/Vis/ NIR spectrophotometer from Perkin Elmer with a 150 mm integration sphere in the reflection configuration. Measurements, which correspond to the sum of specular and diffuse reflections, were
Fig. 1. (i) Surface roughness increases linearly with oxidation temperature. (ii) Roughness profile of coatings oxidised at (a) 350 °C, (b) 450 °C and (c) 550 °C measured using a profilometer tip dragging across the surface with a scan distance of 0.8 mm.
Fig. 2. Brightness versus oxidation temperature curve indicates a maximum brightness at 450 °C. It is noteworthy that sample colour is bright yellow at this oxidation temperature.
Fig. 3. Temperature dependent optical spectra of coatings obtained by oxidation at (a) 350 °C, (b) 450 °C and (c) 550 °C respectively. S. Kumar et al. / Data in Brief 14 (2017) 348–353 351
performed in the visible spectral range (400–800 nm). Temperature-dependent measurements were carried out with the help of a custom made sample holder with an integrated heating element. Temperature control was achieved by a Horst HT 60 temperature controller coupled to a K-type thermocouple. The film thickness and roughness were measured using an Alpha step d-500 Pro-filometer from KLA-Tencor.
Fig. 4. Plot of THR at (a) 535 nm, (b) 555 nm and (c) 575 nm versus temperature for V2O5coatings annealed at 350 °C, 450 °C
Transparency document. Supplementary material
Transparency document associated with this article can be found in the online version athttp://dx. doi.org/10.1016/j.dib.2017.07.028.
References
[1]S. Kumar, A. Qadir, F. Maury, N. Bahlawane, Visible thermochromism in vanadium pentoxide coatings, ACS Appl. Mater. Interfaces 9 (25) (2017) 21447–21456.
[2] Kumar S, Maury F, Bahlawane N. Tunable thermochromic properties of V2O5coatings. Mater. Today Phys.; 2:1-5 (2017).
Fig. 5. Photographs of V2O5coatings on silicon wafer, obtained by oxidation at different temperatures. Thermochromic colour
change for each film is shown upon heating the films from room temperature (1st row) till 300 °C (2nd row).