Open Archive TOULOUSE Archive Ouverte (OATAO)
OATAO is an open access repository that collects the work of Toulouse researchers and
makes it freely available over the web where possible.
This is an author-deposited version published in :
http://oatao.univ-toulouse.fr/
Eprints ID : 12676
To link to this article : DOI :10.1016/j.ijhcs.2013.08.013
URL :
http://dx.doi.org/10.1016/j.ijhcs.2013.08.013
To cite this version : Martinie, Celia and Navarre, David and
Palanque, Philippe A multi-formalism approach for model-based
dynamic distribution of user interfaces of critical interactive systems
.
(2014) International Journal of Human-Computer Studies, vol. 72 (n°
1). pp. 77-99. ISSN 1071-5819
Any correspondance concerning this service should be sent to the repository
administrator:
[email protected]
A multi-formalism approach for model-based dynamic distribution
of user interfaces of critical interactive systems
Célia Martinie, David Navarre
n, Philippe Palanque
Institute of Research in Informatics of Toulouse, University of Toulouse, Interactive Critical Systems (ICS) Team, 118 route de Narbonne, 31042 Toulouse, Cedex 9, France
a b s t r a c t
Evolution in the context of use requires evolutions in the user interfaces even when they are currently used by operators. User Centered Development promotes reactive answers to this kind of evolutions either by software evolutions through iterative development approaches or at runtime by providing additional information to the operators such as contextual help for instance. This paper proposes a model-based approach to support proactive management of context of use evolutions. By proactive management we mean mechanisms in place to plan and implement evolutions and adaptations of the entire user interface (including behaviour) in a generic way. The approach proposed handles both concentration and distribution of user interfaces requiring both fusion of information into a single UI or fission of information into several ones. This generic model-based approach is exemplified on a safety critical system from space domain. It presents how the new user interfaces can be generated at runtime to provide a new user interface gathering in a single place all the information required to perform the task. These user interfaces have to be generated at runtime as new procedures (i.e. sequences of operations to be executed in a semi-autonomous way) can be defined by operators at any time in order to react to adverse events and to keep the space system in operation. Such contextual, activity-related user interfaces complement the original user interfaces designed for operating the command and control system. The resulting user interface thus corresponds to a distribution of user interfaces in a focusþcontext way improving usability by increasing both efficiency and effectiveness.
1. Introduction
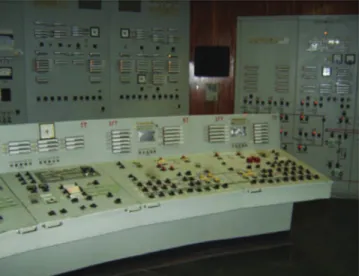
In the early days, the basic design rationale for user interfaces for control rooms was to assign one display to each component to be monitored and one physical input to each command to be
sent to one component of the controlled system (seeFig. 1as an
example). This resulted in very large command and control rooms being rather easy to design and build but rather cumbersome to operate. Such difficulties have been largely studied and reported in
scientific work looking at the design aspects (e.g.Petersen et al.,
1982;Fang Chen et al., 2005), at the implication on operations (see typical image of controls customization where operators add beer
labels on top of control levers p. 95 (Norman, 1998) fromSeminara
et al., 1977)) and safety when incident or accident occurred ((Reason, 1990) p 193 on Chernobyl accident).
In order to overcome such constraints, design drivers for
com-mand and control systems have been targeting at concentration1
and integration of both displays and controls. In several domains
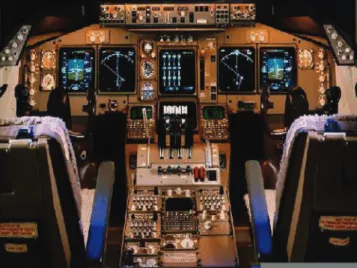
such as control rooms (seeFig. 2) and aviation (see Fig. 4), such
concentration was achieved by adding computing resources for concentrating data from multiple displays into a single (or some-times several in case of large and complex systems) display unit. In aeronautics such concentration of display is known under the notion of “glass cockpit” as computer screens were replacing previous analogic displays (such analogic displays can be seen together with the computer screen on the cockpit of a Boeing 747
as shown in Fig. 4). The benefits of such concentration had
significant positive impact on operations making, for instance, large commercial aircraft operations evolve from 3 operators to only 2 in the Airbus 320 (the first commercial civil aircraft using glass cockpit technology) even though other factors such as weight were also predominant to the migration.
However, nowadays, operators of safety critical systems are facing more and more sources of information competing for attention which might affect their abilities to complete their tasks thus reaching limits of user interfaces concentration. Automation (i.e. delegation of user′s tasks to the system) can reduce tasks’ complexity and time consumption allowing operators to focus on other tasks. However, too much (or inadequate) automation can lead to complacency, loss of situational awareness, or skill degra-dation, whereas not enough automation can lead to an
unmanage-able, unsafe or problematic workload (Parasuraman et al., 2000).
This is the reason why, for instance, SESAR (Single European Sky
n
Corresponding author. Tel.: þ 33 561556965.
E-mail addresses:[email protected] (C. Martinie),[email protected],
[email protected] (D. Navarre),[email protected] (P. Palanque).
ATM2 Research) programme targets at reaching higher levels of
automation in aviation in order to improve safety and efficiency of ATM operations.
User Centered Design approaches (as defined and advocated in (Norman and Draper, 1986)) support the design of user interfaces that fit the user needs focussing on their usability. At design time, user needs are identified, prototypes are designed, built and evaluated with “real” users. Such iterative processes make it possible to tune and adjust the user interfaces to the user needs, and beyond that, to take into account the evolution of these needs when the new system is introduced. Such approaches are efficient for dealing with static interactive systems i.e. systems for which the use can be defined beforehand with very limited evolutions over time. However, these approaches are of little help when the interactive system has to exhibit autonomous behaviour in order to handle some tasks previously performed by the operators. Work
on function allocation such as the ones described inHarrison et al.
(2002) orBoy (1998) aim at supporting the design of automation and more precisely at identifying and assessing candidate func-tions to be automated. Beyond that, if the use of the system is highly dynamic i.e. evolves regularly (for instance in order to handle unexpected adverse events such as malfunctions, faults,
malicious attacks, …) here again User Centered Design approaches do not provide dedicated support to anticipating evolutions and for providing adequate solutions.
This paper proposes a model-based tool-supported approach for the design and development of distributed user interfaces in the context of highly dynamic complex systems requiring repetitive and systematic activities to be allocated to the system in order to allow operators to be focussing on more analysis and decision related tasks. This approach embeds automatic generation of distributed user interfaces allowing operators to monitor the execution of semi-autonomous procedures. Thanks to this approach the command and control user interface exploited by the operator is distributed according to two tasks that are interleaved: the monitoring of the system and the supervision of the execution of the recovery procedures triggered in case of the occurrence of failures or faults. Next section presents with more details the context that has
been introduced above.Section 3presents the process associated
to the approach exhibiting why there is a need of distributing the operators’ user interfaces in two different parts, one being the standard command and control interface and the other one being an additional UI generated for handling a dedicated adverse event. Section 4presents a case study about satellite ground segments
applying step by step the approach presented inSection 3. More
precisely that section presents how the generated user interface complements the existing user interface for command and control and why it is better to distribute it rather than integrating in into
the existing one as argued in Kontogiannis (2010). Section 5
presents how and on which aspects informal evaluation has been
addressed, while Section 6 concludes the paper and presents
directions for future work.
2. Automation in the context of complex systems
As introduced above, operations in complex system usually involve repetitive actions that have to be performed in a systematic
and reliable way.Fitts (1951) and more recentlyCarver and Turoff
(2007) have demonstrated that humans and machine possess different capabilities making them more complementary than
concurrent. In automated systems, function allocation (Boy, 1998)
between human and machine has always been a point of con-troversy. In the context of automation, “function allocation” means that the actor, (either being human or machine), that is best suited should be responsible of performing the function. One early static model of function allocation is the MABA–MABA list (Men Are
Better At–Machines Are Better At (see Fig. 3b) proposed by Fitts
(1951). This model clearly states that functions are better suited for
one actor or the other (seeFig. 3a). The main design issue based on
function allocation is to specify functions in order to allocate them to the right actor but heuristics and questionnaire-based methods
have been proposed as described inLiu et al. (2011) orHarrison
et al. (2002).
There are many different levels for implementing design decisions in order to include autonomous behaviors in a comput-ing system. The first one (static level) consists in defincomput-ing and designing the allocation at design time and to design and build the interactive system according to this allocation of functions. This is for instance the case in automotive industry with the ABS (anti-lock braking system). This autonomous system prevents vehicles wheel from blocking while the driver is breaking. Even though the autonomous system is triggered by the user, its behavior is “hard coded” and cannot be altered. The second one (dynamic execution level) consists in designing and defining flexible and redundant functions as in the aeronautics domain with the auto pilot. All the functions that are available in that autonomous system (such as climbing to a certain altitude) can also be performed manually by
Fig. 1. Small portion of Chernobyl nuclear power plant control room (fromhttp://
www.upandatom.net/Chernobyl.htm).
Fig. 2. Example of a computer-based, concentrated control room (Large Hadron Collider at CERN).
the pilot. The decision to allocate the execution of the function to the autonomous system remains in the hand of the user. The last level (dynamic execution and definition level) allows the user to define the behavior of the automation and also to decide when such autonomous behavior will be executed. Such level corre-sponds for instance to the definition and execution of macros in Microsoft Excel or the text styles in Microsoft Word.
The current paper addresses the last level in the context of command and control systems for satellite control rooms. Indeed, in case of malfunction the operator is required to define a procedure in charge of solving the identified problem. Such procedures are then tested and executed either in an autonomous or manual way. However, even in the case of autonomous execu-tion some informaexecu-tion might be required from the operator to complete the execution. Such information can be values of some parameters (presented on some display units) of the satellite or go/no go that contacted experts in the domain of the failure (e.g. engines, electricity, …) have provided to the operator. One of the issues related to that problem is that the information required from the operator can be distributed amongst many displays making this activity cumbersome, time consuming or even error-prone. The objective of this research work is to exploit the content of the procedure defined by the operator to generate an additional user interface dedicated to the management of the procedure. This user interface gathers (in a single concentrated location) all the information that has to be checked and provided by the operator throughout the execution of the procedure. Beyond that, as the new user interface duplicates information that was previously available in other synoptics the resulting entire user interface provides information distributed over several user interfaces. How such user interfaces can be generated from the definition of the procedure is presented in details in the following section. It is important to note that the point is not here to modify the existing user interface of the application but to generate and additional, contextual user interface. This prevents difficulties that may occur and which are known under the term “automation surprises” (Palmer, 1995) if the routine interface was unpredictably altered by the generation process. Indeed, currently the new interface gen-erated can be simply ignored, at no cost, by the operators.
3. A design process for generating interfaces for partly automated systems
This section presents a new user-centered design process based on models for the development of partly autonomous interactive systems. Next section presents the requirements for such a process
whileSection 3.2presents an overview of it.Sections 3.3and3.4
present respectively a refined view of the process and its
position-ing with respect to CAMELEON reference framework (Calvary
et al., 2003).
3.1. Requirements for a user interface generation and distribution process for dynamic partly automated system
As presented inSection 2, in the area of complex command and
control systems, some of the user tasks and activities cannot be identified beforehand i.e. at design time. In addition to that issue, these tasks can be complex and/or inadequate for a human being (requiring for instance, management of a large amount of informa-tion, execution of multiple commands under strong temporal constraints, …) thus requiring to be delegated to an autonomous sub-system. In order to address those issues there is a need to provide operators with meta-level systems able to combine multi-ple commands and to delegate their execution to an autonomous agent. The design of this part of the partly-autonomous command and control system requires the same level of reliability and usability as the rest of the application. While the reliability aspects of user interfaces can be addressed using standard dependability and fault-tolerance techniques such as the command and mon-itoring architecture initially proposed by self-checking
compo-nents in Yau and Cheung (1975) and recently adapted to
interactive systems (Laprie et al., 1990) (such as in interactive
cockpits of large civil aircrafts (Tankeu-Choitat et al., 2011)), the
usability aspects have to be addressed according to the work done in the area of automatic generation of user interfaces as described in Jean (1998) or more recently in Nichols et al. (2007). Due to space constraints and not to broaden too much its scope, this paper does not address the dependability aspects of interactive systems but the formalism used for describing in a complete and unambiguous way interactive systems is used for the generation of user interfaces.
Fig. 3. (a) Illustrations of theFitts ((1951), pp. 7–8 list—(b) MABA-MABA list fromFitts (1951).
Fig. 4. Example of a computer-based, concentrated user interface—the glass cockpit (transition to glass cockpit for the Boeing 747).
Systems which support the management of complex tasks and of a huge amount of information usually require distributed user interfaces (DUIs). Several definitions of this kind of interfaces
co-exist and present complementary viewpoints. For Vanderdonckt
(2010), a UI distribution “concerns the repartition of one or many elements from one or many user interfaces in order to support one or many users to carry out one or many tasks on one or many domains in one or many contexts of use, each context of use consisting of users, platforms, and environments”. Another
defini-tion proposed byElmqvist (2011) identifies several dimensions for
the distribution of UI components: input, output, platform, space
and time. Demeure and Sottet (2008) also propose a reference
framework (called 4C) to analyse DUIs, which is composed of four concepts: computation, coordination, communication and config-uration. In the presented work, as we advocate for a task and context based approach of DUI design, we use the first definition because it explicitly and directly binds the tasks and context of use to the DUI.
Several model-based approaches and toolkits aim at designing
and implementing DUIs reconfigurable at runtime.Fröberg et al.
(2011) present a framework called Marve in order to support graphical components reallocation across platform. Their work particularly focuses on event communication structure
manage-ment.Melchior et al. (2009)introduce a toolkit to deploy DUIs and
then a framework based on state transition diagrams to represent
distribution states of a DUI (Melchior et al., 2011).Demeure and
Sottet (2008)illustrate their 4C framework with several
architec-tural instances of DUIs with various types of devices. Kjeldsen
et al. (2003)also present a system architecture for widget inter-action reconfiguration on planar surfaces.
A set of contributions dealing with dynamic reconfiguration of distributed user interfaces layout are based on the CAMELEON
framework (Calvary et al., 2003) (an overview of this framework is
presented inSection 3.4.1). Manca et al. (2011)present a dialog
model description language which aims at supporting dynamic distribution of user interfaces elements across various devices.
Other contributions deal with runtime architectures.Clerkx et al.
(2007)propose a design process and runtime architecture in order to partially support dynamic redistribution of the user interface at runtime. The MASP (Multi-Access Service Platform) runtime
architecture (Feuerstack et al., 2008; Roscher et al., 2011), takes
into account all of the CAMELEON layers and aims at supporting dynamic redistribution of ubiquitous user interfaces layout across platforms in order to adapt to unforeseen context of use.
These contributions do not take into account or partially (in the case of state transition diagrams to represent the distribution
states (Melchior et al., 2009)) the behavioural part of the
dis-tributed interactive applications. This is a critical aspect when dealing with command and control of safety critical systems which might lead to deadlocks. We previously addressed that aspect by proposing fault-tolerant architectures dedicated to the dynamic reconfiguration of user interfaces in the context of cockpits of large civil aircrafts. This reconfiguration supports distribution as well as relocation of user interfaces of critical applications to other
dis-plays unit when the default one is faulty (Navarre et al., 2008a,
2008b).
Based on this earlier work, generation of user interfaces can be envisioned if behavioural description of the automation is available and if a generic mechanism for distribution is available. However, such generation of the user interface must not have a negative impact on monitoring activities, so distribution to another display and/or to another window is required. This distribution allows decoupling the introduction of new interfaces (generated) from the set of existing ones. This guarantees the continuity of operation as the predefined set of interfaces for monitoring and control is not altered by the generated ones. Beyond that continuity of service
aspect such distribution makes it possible to provide a focus plus context construction of the user interface. The context is provided by the default command and control interface while the focus lies in the user interface that has been generated following the definition by the operator of a new procedure for the management of the adverse event.
Lastly, as we are aiming at user interface generation at runtime, it is important to ensure that the generation process will not interfere with operators’ activities and will not add delay to the management of the unexpected event.
Next two sections present our approach and a detailed descrip-tion of the proposed generadescrip-tion process. As a large set of
contri-butions are based on the CAMELEON framework, Section 3.4
is dedicated to the presentation of this framework and to the positioning of our proposed approach and generation process with regards to the CAMELEON framework.
3.2. General overview of the approach
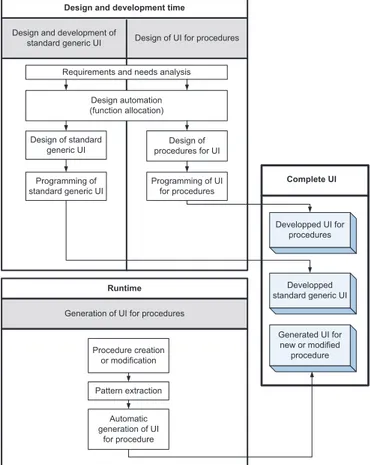
Fig. 5presents the generic process involving dynamic generation of part of the user interface. That Figure is split in three parts. The first part, called “Design and development time” (in the upper part ofFig. 5) corresponds to the design and development of the user interface that is done following a classical user-centered develop-ment process. The only difference with a classical user-centered development process is located in the phase called “Design
Auto-mation” (function allocation as defined inBoy (1998)) dedicated to
the attribution of functions either to the partly-autonomous system or to the operator. Of course the description of the process remains on purpose abstract not even showing the iterations (which are typical of a user-centered design process) as we only highlight here the main principles. The interested reader can find a more complete and precise description of such a user-centered design process in
Martinie et al. (2012). This “Design and development time” part is split into two threads of developments represented by the two swim lines. The right-hand side corresponds to the standard development aiming at producing a usable user interface. The left-hand side corresponds to the design and development of the UI for procedures. The underlying concept behind this process is that there are two types of user interfaces that will be used by the operator:
"
A generic user interface allowing the operator to perform themain tasks assigned to him/her.
"
A set of specific user interfaces aiming at supporting specificactivities defined by procedures.
The generic user interface corresponds to the UI of the comm-and comm-and control system allowing managing the entire system while the specific UI are dedicated to procedure (that might have been defined after the UI of the command and control system has been finalized). This process is rather generic in critical systems where modification of the command and control systems might involve time and resource consuming activities such as certifica-tion by external authorities.
The other two parts in Fig. 5 correspond to the design and
development of the specific user interfaces dedicated to the management of specific procedures. The part in the lower part of Fig. 5, called “Runtime”, corresponds to the generation of a user interface while the command and control system is in operation
(this part is detailed inSection 3.3). The part in the right-hand side
of Fig. 5, called “Complete UI”, contains the outputs from the “Design and development time” part and from the “Runtime” part. “Complete UI” part gathers:
"
Standard generic UI (“Developed standard generic UI” blue box)and standard UI for procedures that have been identified during the design phases of the command and control system (“Developed UI for procedures” blue box).
"
UI that has been produced during operations as handling ofunexpected adverse events is not envisioned during the design phases of the command and control system (“Generated UI for new or modified procedure” blue box).
The “Complete UI” part in Fig. 5is the user interface of the
command and control system and is thus the sum of these three interfaces. It is important to note that the generated part does not replace the existing one but is proposed as a contextual help to the operators.
The following section focuses on the runtime generation
process (lower part of Fig. 5, called “Runtime”) making explicit
how the new user interface is produced via the analysis of the new procedure.
3.3. Distribution and generation
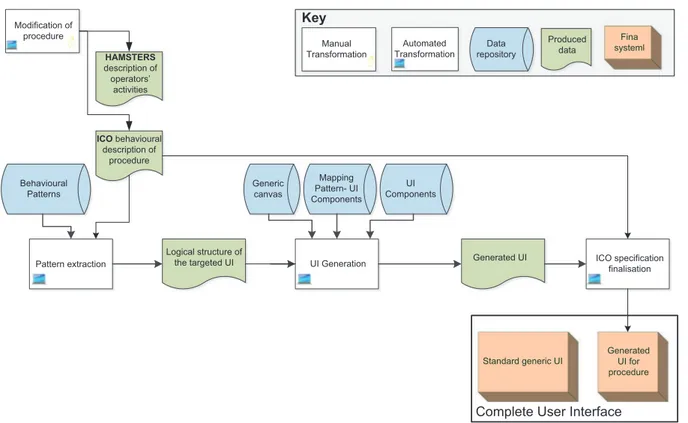
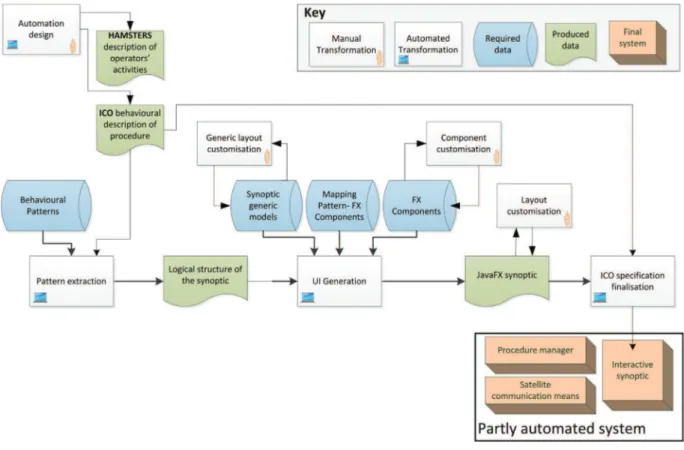
Fig. 6refines the user interface generation process presented at
the bottom ofFig. 5. It starts with a manual activity carried out by
the operator consisting at modifying an existing (or potentially creating a new one).
(1) For describing the procedure (as explained with more details in the case study section) operators are provided with
beha-vioural description languages such as YAWL (Hofstede, 2005)
or BPEL (Object Management Group, 1998a). Our process is
based on another language called ICOs (Interactive Cooperative
Objects) (Navarre et al., 2009) which combines Petri nets and
Object-Oriented constructs allowing manipulating values within the Petri net-based behavioural description. Beyond that, activation and rendering functions in ICO make it
possible to connect this behavioural description to the graphi-cal user interface it describes. This activity is represented as a manual and automated process as it is performed using dedicated editing tool. The ICO description of the procedure provides the grounding of the behavioural part of the user interface that will be generated. It is possible to provide support to the modification of the procedure description in particular when using both guidelines (for instance related to the specific class of systems) and a recommender system. The introduction of guidelines may be done with an in-depth analysis of ICO models and Hamsters models that would provide means to identify usability guidelines, safety guide-lines (such as, for instance, the triple confirmation require-ment for safety critical (so-called catastrophic) telecommands
in ATV3) …. The introduction of a recommender system could
help the operator to identify relevant modifications related to the modification he/she tries to introduce within the proce-dure description (for instance, propositions such as “the operator who introduced such parameters usually introduces these other parameters …”).
(2) The ICO procedure is then automatically analysed using a Petri net pattern detector based on a collection of patterns descrip-tions. These patterns correspond to the basic bricks that constitute the procedure behaviour and depend on the appli-cation it is related to. The product of this pattern extraction is a logical structure of the targeted application as a collection of instantiated patterns (an instantiated pattern contains attri-butes that directly relate it to the part of the ICO description it corresponds to). As within our generation process this descrip-tion is only transient, we do not handle it as a model per se, even if it would be possible.
(3) For each of these instantiated patterns, the UI generation phase associates a concrete component using a predefined mapping and these components are then composed within a generic graphical canvas, creating a default layout of these components. The production of this phase is a model that does not describe the behaviour of the generated application (the behaviour being provided by the ICO model in the next step).
This is not presented onFig. 6but the components, the generic
canvas and the produced application are customizable, allow-ing a fine tunallow-ing of the produced user interface. This would be needed for instance when maintenance is performed of the application thus going back to the design process.
(4) Lastly, the generated model and the ICO procedure are put together to provide the final interactive user interface (using the activation function and the rendering function of ICO introduced above).
This generation process is instantiated and illustrated on a case
study presented in Section 4. Next section positions this user
interface generation process within the CAMELEON framework.
3.4. Generation process in perspective with the CAMELEON framework
The proposed generation process is inspired by the work done
by the UsiXML community (Calvary et al., 2003; Limbourg and
Vanderdonckt 2004). There is a clear connection between this CAMELEON framework and the contribution presented in this paper. Next section gives an overview of the CAMELEON reference
framework andSection 3.4.2 makes explicit the similarities and
3Automated transfer vehicle (a set of vehicles used as cargo for the
discrepancies between each phase of our process and the ones of CAMELEON.
3.4.1. Overview of the CAMELEON reference framework
The UsiXML community proposes a generation process based on
the framework called CAMELEON (presented inFig. 7). That
frame-work aims at supporting a model based approach for developing interactive applications focussing both on usability and context-sensitive aspects, where the application must support user changes, targeted software, hardware platform changes ….
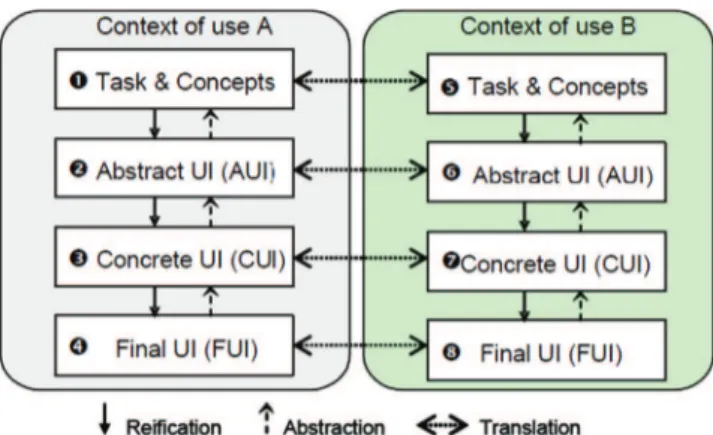
As illustrated inFig. 7, the framework defines four main stages
related to each other by three kinds of transformation abstraction and reification for a same context of use, and transformation for between two different contexts of use. The four stages represent different levels of abstraction from the task description to the final user application running on the targeted platforms, and transfor-mation allows navigating between them. More precisely:
"
Task and concepts (tokens number 1 and number 5 inFig. 7) isa stage that aims at describing the complete set of tasks and their related domain objects. Tasks are the set of activities users have to perform with the system in order to achieve their goals. Concepts are the information, knowledge and objects (devices, widgets) users need to be able to accomplish their activities.
"
The abstract user interface (AUI, tokens number 2 and number6 inFig. 7) stage consists in describing a UI model independent of interaction modalities. The abstract UI model supports a set of elementary actions, independent from any context of use. These elementary actions are called AUI Objects (AUIO).
"
The concrete user interface (tokens number 3 and number 7 inFig. 7) stage aims at transforming an abstract UI (AUI model) in a concrete UI (dependent from modality of interaction) for a particular context of use. The concrete UI describes how CUI objects (CUIO) are composed according to a particular layout. Concrete UI model also describes how it is possible to navigate amongst the different windows constituting it. The produced
CUI model is the mockup of the final look and feel of the UI. CUI model is independent from the targeted computing platform but is dependent from the software environment.
"
The final user interface (tokens number 4 and number 8 inFig. 7) stage aims at producing the final interactive application from the CUI model by instantiating the CUI model for a particular computing platform. It is considered as the running system.
All of these stages can be led for different context of use in terms of user, platform and environment (illustrated by grey and
green bounded rectangle on the right-hand side ofFig. 7).
There is a clear connection between this CAMELEON frame-work and the contribution presented in this paper. Next paragraph makes explicit the similarities and discrepancies between each phase of our process and the ones of CAMELEON.
3.4.2. Positioning the generation process with regards to the CAMELEON framework
The main principle of the CAMELEON approach is to generate user interfaces from abstract representation. This CAMELEON generation approach promotes the production of intermediate representations before reaching the actual generation of the user interface. The approach presented in previous section promotes also a stepwise refinement process. The various phases of the CAMELEON approach have been presented at the beginning of this
section andFig. 8, makes explicit where each of these phases fits
within the generation process presented inFig. 6.
Fig. 8 clearly exhibits the fact that the basic concepts of CAMELEON are at the basis of our approach as they all appear in the process.
We can thus acknowledge that this process is an instantiation of the original CAMELEON framework for the particular case of partly automated system but some significant differences exists. The principle of the generation in our approach does not conflict with the user centered principles. The user interface of the command
Key
ICO behavioural description of procedure Standard generic UI Behavioural Patterns UI Components Generated UI Mapping Pattern- UI Components Logical structure of the targeted UI Generic canvas Automated Transformation Data repository Produced data UI GenerationComplete User Interface
ICO specification finalisation HAMSTERS description of operators’ activities Pattern extraction Generated UI for procedure Fina systeml Manual Transformation Modification of procedure
and control system is designed using these principles and the generation process only addressed new interfaces for specific procedures which were unknown in the design phases. One of the design drivers of CAMELEON approach is to save development costs especially when the same application has to be developed multiple times as it is to be used in multiple contexts and usually multiple platforms. Here the context of use remains the same and development cost is not an issue. Finally, the approach presented above requires that operators are able to describe the new proce-dures using a behavioural description technique as ICO. They thus take an active part in the process of generating a new interface. This is possible as operators of command and control systems are usually highly qualified and they have to follow a thorough training programme.
As stated above this process is generic and can be applied to many types of command and control systems while other ones (such as cockpits or civil aircraft) remain out of reach due to
certification constraints. Next section presents the instantiation of this process to a satellite ground segment application.
4. Case study
The case study presented in the paper belongs to the category of complex command and control systems from the space domain. Such interactive systems are less time constrained than other ones (such as aircraft cockpits). Beyond that, such systems are less safety critical (the only possible safety issue would correspond to a space-craft falling on earth and injuring people). However, the potential cost of a failure is far beyond the development cost of these systems making them belong to the category of critical systems. One of the characteristics of such systems is the fact that the operations are encapsulated in procedures that are defined to gather multiple commands that are then semi-automatically executed by a simula-tion engine. These concepts as well as the development process presented above are exemplified on the ground segment of the satellite PICARD. Even though in previous sections references were made to other safety critical systems than satellite (such as aircraft for instance) this section only refers to the operation of satellite ground segments.
4.1. The context of space operations: The case of operational procedures
To present with more details the context of application of this work, we present below an application from space domain dealing with ground segments which allow operators to interactively monitor and control satellites. This work is based on several research projects done with the French space agency (CNES) to promote the use of model-based approaches to support the design process of critical interactive systems. This section concerns a part
Fig. 7. The CAMELEON Framework fromCalvary et al. (2003).
of the work that has been done within TORTUGA4and ALDABRA5
research and technology initiatives, where:
(5) TORTUGA (Tasks, Operations, Reliability and Training for Users of Ground Segment Applications) project has been carried out from 2008 to 2011 and demonstrated techniques and tools for improving of reliability of both ground segment systems and users involved in the operation of such systems.
(6) ALDABRA (Architecture and Language for Dynamic and Beha-viourally Rich interactive Application) project has been carried out from 2011 to 2012 and promoted the use of model-based approach to support the generation of interactive synoptics (support for operational procedures).
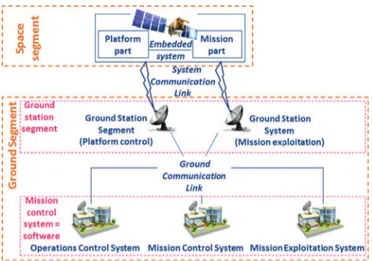
Fig. 9 presents a schematic view of a satellite application as
defined in the European Standard ECSS-E-70 (European
Co-operation for Space Standardization, 2008). The system is split in two parts: the on-board part (the upper one including the space-craft and called the space segment) and the ground part (made up of antennas for communication and the mission control system) called the ground segment.
The current paper is only concerned with the command and control system in charge of operations (bottom-left icon in the diagram). This control system is in charge of maintaining the spacecraft in operation and is thus heavily dependent of the spacecraft software and hardware infrastructure.
4.2. Operational procedures as partly automated systems
Satellites and spacecraft are monitored and controlled via ground segment applications in control centres with which satellite opera-tors implement operational procedures. A procedure contains instructions such as sending telecommands (TC), checking telemea-sures (TM), waiting, providing required values for parameters, etc.
The definition of operational procedures may be found in the
ECSS-E-70-32A standard (European Cooperation for Space
Stand-ardization, 2006) defines the elements that an operational procedure must contain (declaration of the local events raised within the procedure, a set of preconditions, instructions that fulfill the goal of the procedure …).
Procedures are the main mechanism used by control room operators to control and test the spacecraft during both test and operations phases. Independently from the language used to describe operational procedures, it is not current practice to reuse them from one mission to another, because manipulated elements (TM and TC) are mission specific and their description is at a too low level of abstraction.
As we mentioned along this article, supporting notation and tools for user task and system behaviour are needed to handle usability within large-scale systems. We then used two modell-ing notations with associated software tools: one for operator task modelling and the other for system modelling. HAMSTERS (Human-centred Assessment and Modelling to Support Task Engineering for Resilient Systems) is a task modelling notation designed for representing the decomposition of human goals into activities (perceptive, cognitive, motor, interactive …). Its asso-ciated software tool (also called HAMSTERS) enables to edit task models and simulate their execution. ICO (Interactive Cooperative Object) is a formal notation to describe and model system′s
behaviour and user interactions with the system. It is Petri nets based and associated to a supporting tool, Petshop, which enables to edit application behavioural models and to connect them to the presentation part of the user interface (graphical widgets and frames for example). It also enables to execute the application with the underlying behavioural models.
For the TORTUGA and ALDABRA projects purpose, these two software tools have been integrated in a development environ-ment supporting:
(7) Correspondence matching between the two types of models. (8) Co-execution of the very high-fidelity prototype with the
underlying system and task models.
Further information about these tools and their integration has
been described in previous work (Barboni et al., 2010).
Model-based design processes are particularly well adapted to command and control systems and their operations as the list of operators’ tasks are typically complex and involve possible cata-strophic consequences. Due to that complexity, model-based approaches are particularly well suited as they make it possible to designers to describe in a complete and unambiguous way both behavioural and data aspects. Indeed, as they provide a more abstract description of the system than the implementation code they also provide a unique opportunity for various stakeholders (designers, users, developers …) to comment and propose mod-ifications on the system under design.
In the human–computer interaction community many research-ers have described user interface elements by means of models. However, dealing only with the system side of socio-technical system is not enough. Typically, tasks evolve when the system is modified and thus altering one of these two components has an impact on the other one that has to be updated accordingly.
Procedures are a third artefact to be dealt with in this iterative cycle. This artefact is designed by the satellite manufacturer and addresses very detailed management aspects of the satellite. For instance, a procedure can be a set of activities to be performed by the operator to test the battery level of the satellite. It can be composed of tasks that are executed by the on-board system, by the operator or by another member of the team. Procedures provide precise guidance to the operators on how to achieve both for routine and failure recovery actions. Thus, as for the task-system cycle, procedures are a different artefact from task model but their design and evaluation heavily depends on both the identified tasks of the operators and the command and control system.
Fig. 9. The satellite application domain in a nutshell.
4TORTUGA: A research project funded by CNES on tasks, operations, reliability
& training for users of ground applications (http://www.irit.fr/recherches/ICS/
projects/tortuga/index.php). 5
dALDABRA A research project funded by CNES on architecture and language
for dynamic and behaviourally rich interactive application (http://www.irit.fr/
Lastly, training program is also another artefact that has to be designed and assessed according to the identified user tasks the interactive system as well as the defined procedures for operating
it (more details may be found inMartinie et al. (2012).
Modifica-tions in any of these artefacts require consistent adjustment in the
other three ones.Fig. 10presents this iterative process including
the four artefacts and their co-evolution as well as the compat-ibility assessment activity to be carried out which aims at ensuring conformance and compatibility of the artefacts produced.
Most of the part of this interconnection of models has already
been studied inBarboni et al. (2010),Martinie et al. (2012). With
the current case study we highlight how to support the distribu-tion of interface for the operators, providing a particular focus on the design of procedures and the generation of interactive means to control the automation.
4.3. A detailed example of application of the process for ground segments
The case study presented in this section is an excerpt of the ground segment of the PICARD satellite launched by CNES in June 2010 dedicated to solar observation, for which we only present the small part making it possible to demonstrate the use of the approach presented in this paper. Amongst the various ground segment applications that are used to manage the satellite plat-form, we focus on the ones that are used by controllers to ensure that the platform is functional. The platform has to be functional so that the mission (for which the satellite has been designed and developed) can be completed. The controllers of the PICARD
satellite are taking turn in the command and control room (there is only one on duty at a time). Controllers have several applications (with their corresponding displays) for the monitoring activities and dedicated applications to manage the telecommand plans. Fig. 11shows a picture of a controller in the command and control
room. The display in the upper part ofFig. 11is presenting the
status of terrestrial antennas for monitoring communications between the satellite and the ground segment. The display in
the middle of the lower part ofFig. 11is presenting parts of the
current satellite parameters statuses (these windows are called synoptics and are detailed in the next paragraphs). The display in
the right of the lower part of Fig. 11(in front of the controller)
presents part of a telecommand plan management application. Other ground segment applications (such as the display in the left
of the lower part ofFig. 11) aim at handling satellite trajectory or
performing various local configurations.
Controllers are in charge of two main activities: observing periodically (i.e. monitoring) the vital parameters of the satellite and performing maintenance operations when a failure occurs. Depending on the satellite between a couple of thousands and tens of thousands parameters have to be monitored. The more frequent and relevant monitoring activities include observing: satellite mode, Telemetry (measures coming from the satellite), Sun array drivers statuses, error parameters for the platform, error parameters for the mission, power voltage (energy for the satel-lite), ground station communication status, and on board compu-ter main paramecompu-ters.
Controllers are in charge of two main activities: observing periodically (i.e. monitoring) the vital parameters of the satellite and performing maintenance operations when a failure occurs. Depending on the satellite between a couple of thousands and tens of thousands parameters have to be monitored. The more frequent and relevant monitoring activities include observing: satellite mode, Telemetry (measures coming from the satellite), Sun array drivers statuses, error parameters for the platform, error parameters for the mission, power voltage (energy for the satel-lite), ground station communication status, and on board
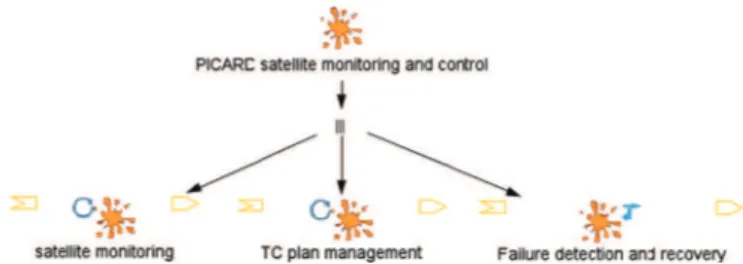
compu-ter main paramecompu-ters.Fig. 12presents the task model of the main
operators’ goals. It describes that operators may have to lead concurrent activities such as monitoring satellite state and
para-meters (“satellite monitoring” task on the left-hand side ofFig. 12),
detecting failures and recovering from them (“Failure detection
and recovery” task on the right-hand side ofFig. 12), preparing and
following up TeleCommand plans (“TC plan management” task in
the middle at the bottom ofFig. 12). If a failure is not detected
rapidly enough by the operator, the satellite will change its mode itself (using an On-Board Control Procedure (OBPC)) to a survival mode and the mission will be delayed and the satellite possibly lost (very seldom case).
Fig. 13depicts the task model of the satellite monitoring sub-goal, describing the different interactive tasks that operators may achieve in an order independent way.
To support the task of failure detection and recovery, the operation ground systems is made up of two relatively uncon-nected components. Amongst the interactive systems used within
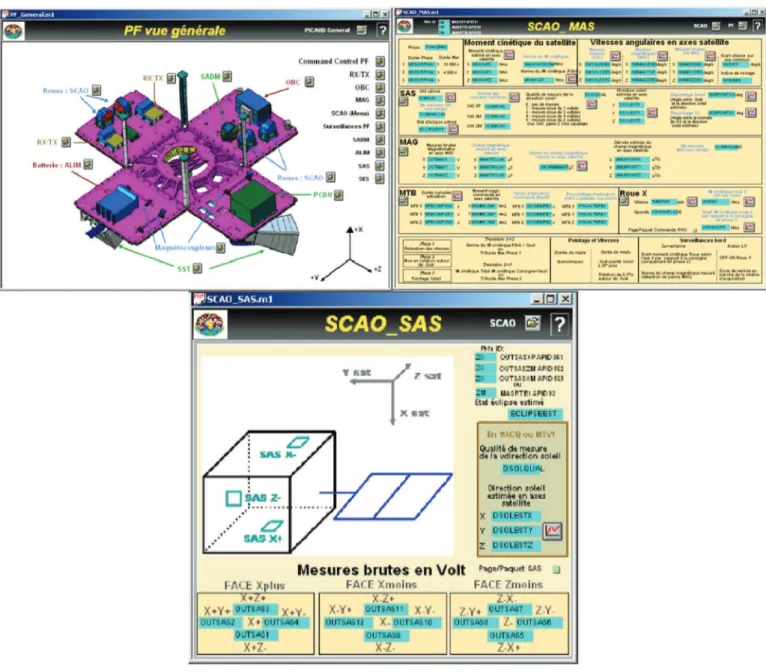
the control room of PICARD, synoptics (seeFig. 14) represent an
important support to the operators’ activities. Synoptics gather a set of parameters to propose a general overview of them, these parameters being used by the operators to monitor the state of the satellite. The PICARD operation control centre uses more than 50 synoptics containing around 10 000 parameters (parameters may be battery status, communication link status …), and the number of procedures for possible maintenance operations goes beyond
the hundred. As illustrated in Fig. 14, synoptics may contain
graphical representation of parameters, but most of them repre-sent parameters as a simple text (such as the central part of Fig. 14).
Another important part of the operational ground segment system is the procedure manager which aims at triggering tele-commands, i.e. allowing the operator to upload commands onto the board system in order to change its current configuration and
make the parameters evolve (seeFig. 15).
When operating a satellite (for instance when executing a particular procedure), such a quantity of screens and density of information makes it difficult for the operators to find a particular parameter navigating amongst the synoptics. This activity may be critical when the operator tries to solve a satellite failure, where he/she has to precisely analyse the relevant parameters. The complexity of a satellite makes it difficult to design a dedicated synoptic for each kind of failure, so that when an unexpected event occurs, dedicated procedures must be redesigned, but not the interactive system itself which remains the same (and is thus design as generic as possible).
The main idea we illustrate with this case study is how to take benefits from the model-based work done within the TORTUGA project to support the generation of customizable interactive synoptics, while keeping the original interfaces (synoptics and procedure manager) that are required to support most of the activities of the operators.
The targeted platform (due to the project requirements) is Java
and more specifically the Java technology called JavaFX (http://
javafx.com) which allows the description of the graphical part of an interactive application with an XML file (called FXML) and which allows customisation of the graphical rendering using CSS
styling (http://www.w3.org/Style/CSS/), while it supports
interna-tionalisation. The generation process presented inFig. 8has been
instantiated for the case study, as illustrated inFig. 16.
The principle of generation of interactive synoptics presented inFig. 16is based on a sequential flow of manual and automatic transformations that supports several customisation means:
(1) The starting point of the process (top-left part of Fig. 16) is
the original operational procedure from which we manually produce an ICO model (and a Hamsters model that is not represented here). This first step is related to the particular case study on which the paper is based and should disappear in a fully model-based approach for space operations where procedures would only be represented by the ICO and Ham-sters models. This is why modifications on procedures are performed on the ICO model (and on the Hamsters model)
following the design process of Tortuga project (see Fig. 10)
and the initial generation process (see Fig. 8). Recommender
system and guidelines are not presented in this case study as we intend to focus on the UI generation steps
(2) The ICO procedure is thus the behaviour of the being gener-ated interactive synoptic and the modifications performed on it introduces iteration in the generation process.
(3) The ICO procedure is automatically analysed with a Petri net pattern detector, associated to a collection of patterns descrip-tions, which embed algorithms to detect the basic bricks that constitute a procedure such as parameter update, checking of these parameters, messages and choices proposed to opera-tors… The result of this pattern extraction is a logical structure of the synoptic in form of a list of instantiated patterns (with the list of monitored parameters and a list of elements of the control flow of the procedure).
(4) A JavaFX component is then associated to each of this instantiated patterns, using a predefined mapping. These components are then integrated within a generic synoptic canvas, producing a JavaFX application (with no behaviour, the behaviour being provided by the ICO model in the next step). The customisation of the JavaFX components, generic canvas and produced JavaFX application is additionally supported by the use of CSS styling to precisely adjust graphical attributes of the generated synoptic.
(5) Lastly, the JavaFX synoptic and the ICO procedure are put together to provide the final interactive synoptic.
Fig. 12. Task model of the operators’ main tasks.
The following sections describe more precisely each of these steps using the example of a simple procedure to allow their presentation in a paper. While working on the Tortuga and Aldabra projects, more complex procedures have been experimented, providing the same kind of results.
4.3.1. Step 0: From procedures to models
Procedures are usually described using a programming lan-guage with basics constructs that allows sending telecommands, checking telemeasures, asking operators for confirmation or choice… Another interesting use of the procedure description is the use of comments that provides the operators with more information about the tasks to perform depending on the context. An important part of the work done within the project TORTUGA was to build two types of models from the procedural descrip-tions: one type describing the user activity, modelled using the
HAMSTERS notation (shown by Fig. 17), and the other type
describing the part of the system behaviour dedicated to this procedure, modelled using the ICO formal description technique
(shown byFig. 18).
Fig. 17describes activities that have to be led by operators when encountering a Sun Array Driver issue. This task model gathers information about operator′s activities (interactive and cognitive tasks) in case of such event while executing a particular procedure, “Switch on SADA2”, to activate the redundant Sun Array Driver. System functions are also represented in this task model (“Check
SADA2 is OFF”, “Send TC STOPSADA2” … inFig. 17) as they support
understanding of operators’ tasks w.r.t. system′s behaviour. Fig. 17shows the resulting task model to switch from a failing SADA to the backup SADA. Concerning the performance measure, an operator is required to ensure the satellite integrity and has then to switch to the redundant SADA as soon as it is detected that the running SADA is failing. This task model makes explicit the relationship between the tasks and the procedure. Indeed, the main goal in that model (top of the hierarchy) is to setup the backup SADA. The first task of the ground operator in order to reach this goal is to select the procedure ‘SWITCH ON SADA2 lite’ and then to trigger that procedure on the procedure manager
interface (seeFig. 15). The task model also describes the activities
the operator has to perform in interaction with the procedure execution such as deciding to confirm stopping the rotation of the
redundant SADA (operator is prompted for confirmation by the system). That choice is represented by the right-hand side of the task model. The operator can decide then to send a telecommand (TC), which is represented by the ‘system’ icon in the task model (labelled ‘Send TC STOPSADA2’ at the bottom of the model).
The system′s behavioural part of the “Switch on SADA2” procedure is described using the ICO notation and is presented in Fig. 18 (“Set up Backup SADA” ICO model). This ICO model contains the sequence of steps which will be executed by the ground segment system depending on triggered events.
In order to perform this kind of failure recovery activities, an
operator must use the procedure manager (seeFig. 15) to execute
and control the execution of the procedure, and must use the synoptics application to monitor the concerned parameters (in our case, the operator has to monitor the state of the two SADAs, distributed in several synoptics according to the required level of detail monitoring, amongst the fifty ones available in the applica-tion). We then investigated how to generate a unique graphical interface (an interactive synoptic) allowing both monitoring con-cerned parameters and controlling the procedure execution.
If in most of the cases it is possible to design this kind of interfaces beforehand, when the procedures are already prede-signed, we propose a solution to adapt these interfaces when procedures are customized or created in particular operational situations (unexpected problems or failures, new mission goals …) which were not planned at user interface design time.
4.3.2. Step1: Behavioural patterns detection
The basic principle of our approach is that the ICO specification of the procedure provides the behavioural part of the generated interactive synoptic. This behaviour may be divided into two main parts:
(1) A subpart of the Petri net is dedicated to update the set of satellite parameters that must be monitored during the procedure execution
(2) The other subpart is the execution flow of the procedure with both automatic behaviour and interactive means to control the execution.
This decomposition of the ICO model is illustrated byFig. 19for
the particular procedure that set up the SADA2:
(3) Part 1 represents the two parameters that must be monitored by the operator (the state of SADA2 and the current battery power level).
(4) Part 2 represents a non-interactive part of the procedure that automatically checks the state of the SADA2 within a pre-defined time frame.
(5) Part 3 represents an interactive part of the procedure that allows the user to answer to a particular question (held by the content of the place MessageStop) to control the execution
flow of the procedure (here, the operator must decide whether to stop the SADA2 or not).
The pattern detection step is based on distributed simple algorithms applied while browsing the Petri net. These algorithms firstly detect naming patterns of Petri net items (mainly transi-tions) to identify one part of the pattern and then try to find other related items to point out all constituting elements of the pattern. For instance, when using the detection algorithm on the “Check
parameter” pattern (part 2 of Fig. 19), the detector will firstly
identify one of the two constituting transitions (the name pattern is checkXXX_YYY where YYY is OK or TimeOut). When one transi-tion corresponding to this name pattern is found, the next step is identifying the other transition of the pattern (for instance, if the name detected is checkSSADM2_isOFF_OK, the algorithm will try to
find a transition checkSSADM2_isOFF_TimeOut) in the set of transi-tion sharing a same input place (in the example, the place is
Proc_Ready). The result (as illustrated byFig. 20) is an instantiated
pattern (or Abstract UI component using the UsiXML terminology) with attributes that allow the instantiation of the corresponding JavaFX component and the link with the ICO behavioural model (in the example of the Check parameter pattern, these attributes are the two corresponding transitions checkSSADM2_isOFF_OK and checkSSADM2_isOFF_TimeOut and the name of the checked para-meter/value SSADM2_isOFF).
Applying the pattern detection step to the ICO model enables the construction of an abstract description of the required user interface in terms of displayed satellite parameters and in terms of interactive components, providing the basis for the generation of the graphical
interface. Fig. 21 summarizes these two aspects of the graphical
Fig. 16. Generation process of interactive synoptic.
interface in a tree. The collection of abstract interactive components is ordered in the same way they appear in the Petri net, and the collection of parameters is alphabetically ordered by default.
4.3.3. Step 2: JavaFX synoptic generation
From the AUI it is possible to generate the graphical layout of the representation of the synoptic. To do that, it is necessary to provide the synoptic generator with a collection of graphical components that corresponds to the set of patterns (described within a mapping) and to put these components into a canvas, resulting in a CUI model (expressed in Java FXML for these case study).
Fig. 22 presents an example of JavaFX synoptic component described using the FXML language.
This XML description contains the definition of:
(1) A circle (XML tag oCircle/ 4) used to create a light for the Check parameter component where the colour corresponds to the checking status (green when the parameter is correctly checked, red when it is not the case and black when checking is not used). The colour is defined by the xml attribute style, changed at runtime, and defined within a CSS.
(2) A label (XML tag oLabel/ 4) used to display the checked parameter name. The value is set using a property definition when all JavaFX components are put into correspondence with AUI components (see next paragraph).
(3) A controller (attribute fx:controller of the XML tag oHBox/4 ) used to provide a Java class responsible in adding behaviour to the JavaFX application described with FXML. In our approach, this Java class is used to handle runtime property changes and event triggering by the component.
It is thus possible to map this component to the corresponding
AUI component as illustrated inFig. 23.
The FXML description inFig. 23corresponds to the result of the
mapping:
(1) The XML tag ofx:include/ 4 allows to embed another FXML description within an FXML description, defining the corre-sponding source file (attribute source).
(2) The component is associated to a particular style class (attri-bute styleClass set to the default value “future-task”) used to highlight this component at runtime. Three style classes are
Fig. 20. Example of pattern detection.
available: previous-task when the corresponding action within the procedure already occurred, current-task when the proce-dure is executing the corresponding part and future-task for the other cases.
(3) Additional properties may be defined (XML tag oproperties/4), handled by the controller of the component. In the case of the Check parameter, a first property defines the name of the checked parameter (the value comes from the AUI component corresponding attributes) and the second property defines the light status (off, ok or ko) with a default value, as it is set at runtime.
To compose the set of CUI components, the JavaFX synoptic generator uses a generic template such as the one presented in Fig. 24. The corresponding FXML description is provided inAnnexe section.
Additionally to the mapping between components, Fig. 25
illustrates the mapping between AUI structure and CUI model: (1) A mapping of the root abstract container of the AUI with the
root of the produced FXML description (in our example it is mapped with a oBorderPane/ 4). This mapping is based on the definition of the generic canvas.
(2) A mapping of the two abstract containers (interactive compo-nents and parameters) with the corresponding JavaFX container. This mapping is based too on the generic canvas where two dedicated containers are defined with special identifiers (for instance attribute id¼”component” of the XML tag oVBox/4 inFig. 25).
Fig. 25presents a partial result of the JavaFX synoptic genera-tion with only the component used as an example in the previous
paragraphs. An example of the generated interface with a CSS style
sheet is presented inFig. 26.
In Fig. 26, surrounded items (1–3) match the surrounded
behavioural patterns in the ICO model in Fig. 19, in order to
illustrate the correspondence between the procedure patterns and the corresponding graphical elements.
4.3.4. Step 3: Interactive synoptic finalisation
To finalise the interactive synoptic, last step is to describe the link between the produced CUI model and the corresponding ICO beha-vioural description. This is quite direct as ICO embeds mechanisms to describe this relation: the activation and the rendering functions.
With the example of the check component, such component being not interactive, the link to the ICO behavioural description is
fully described by the rendering function presented byFig. 27.
The rendering is defined in the same way for each CUI components but is not detailed here due to space constraints.
4.3.5. Modification/tuning of the procedure
When generated, an interactive synoptic may be adjusted to the operators’ practices. For instance, even if it is not directly related to the procedure, an operator may decide to monitor some other parameters in a particular context because the satellite is in a particular state where the execution of the procedure may impact these non-related parameters. In the case study, it may be the case of the battery power level. While moving the sun array, the battery is not refilled but its energy is needed by the SADA. In a usual state, it may not lead to a dangerous situation, but if other equipment is using a lot of electric power, it would be very different. The modifications done on the procedure (represented
<?xml version="1.0" encoding="UTF 8"?> <?import java.lang.*?> <?import javafx.geometry.*?> <?import javafx.scene.*?> <?import javafx.scene.chart.*?> <?import javafx.scene.control.*?> <?import javafx.scene.effect.*?> <?import javafx.scene.layout.*?> <?import javafx.scene.paint.*?> <?import javafx.scene.shape.*?>
<HBox fx:id="checkComponent" fillHeight="false" spacing="10.0" styleClass="check component" xmlns:fx="http://javafx.com/fxml" fx:controller="fr.irit.aldabra.fxml.components.CheckComponent">
<children>
<Circle fx:id="light" radius="5.0" style="lightnotchecked"> <effect>
<Lighting fx:id="lighting" /> </effect>
</Circle>
<Label fx:id="label" text="Parameter name"/> </children>
<padding>
<Insets left="10.0" top="10.0" /> </padding>
</HBox>
Fig. 22. The JavaFX Check parameter component described using FXML.
Parameter name: SSADM2_isOFF Initial place: Proc_Ready Main transition: checkSSADM2_isOFF_OK Twin transition: checkSSADM2_isOFF_TimeOut
Pattern
Check
<fx:includeid="check1" source=" CheckComponent.fxml" styleClass="future-task"><properties checkedParameter=" SSADM2_isOFF" lightStatus="off" /> </fx:include>
inFig. 28) are the following one:
(1) Introduction of a confirmation message before switching off SADA1 and switching on SADA2 (because the operation is safety critical).
(2) Introduction of two parameters:
○ Battery power level to verify if the power level is sufficient enough, as switching from the current SADA to the redun-dant one requires energy, low power level may cause the satellite entering its survival mode.
○ Satellite mode to both ensure that the satellite is in a correct mode for such operation and that the operation did not cause the satellite entering an incorrect mode.
As represented in Fig. 28, the introduction of these
modifica-tions consists in adding Petri nets patterns to the existing ICO model:
1. The top-left pattern corresponds to a confirmation message where the operator has the choice in starting or not the procedure.
2. The bottom-left pattern corresponds to the two sub Petri nets updating the two new parameters.
Following the process defined in the previous section, we firstly generate the AUI model using the ICO behavioural description,
illustrated inFig. 29.
Following the rest of the process, the interactive synoptic is
generated. It is presented inFig. 30, where the newly introduced
graphical elements are surrounded.
5. Evaluation and lessons learned
The user interface presented in Fig. 30 consists in the User
Interface addition to the ground segment workstation that has been described at the beginning of section 0. There are several elements to consider:
$ Such user interface window is only generated from the
proce-dure description that has been designed by operators to handle unexpected event on the satellite space segment (i.e. the actual satellite).
$ Such unexpected events on the satellite space segment are rare
(not more than once a month on micro satellites such as PICARD).
$ The number of operators is low about 4 per ground segment
thus limiting the number of users that can be involved in testing. These operators are (for most of them) experts with long term experience on the ground segment of the satellite itself in addition to experience on other ground segments.
$ The user interface of the ground segment is thus enriched with
several user interface windows that are either triggered (if already used) or generated (when such adverse event occurs
Fig. 24. FXML synoptic generic canvas.
for the first time and a procedure for handling it has to be designed).
According to these elements, evaluation of the user interface of the ground segment requires considering the following:
1. The usability of the generated user interface itself
2. The usability of the ground segment enriched with the gener-ated user interface
3. The scalability aspect i.e. the usability of the ground segment when more and more additional user interface windows are added.
It is important to note that the fact that operators are experts, that they have produced the procedure describing the sequence of action to be performed in order to solve the undesired situation on the space segment, usability of the final user interface has not been a major activity of the project and thus, even though the generation has been done considering ergonomic rules and operators’ tasks, usability has only been considered in an informal way (both at design time and at operation time). However, the following sections address usability issues raised in the list presented above.
5.1. Usability of the generated user interface
As for the design aspects, we have presented in section how task models described in HAMSTERS could be exploited for ensuring the mapping between the operators’ tasks and the
ground segment. However, as can be seen on Fig. 6 the task
models are not used in the process. The reason for that lays in the fact that the process targets at unexpected events and thus the description of such information in the task model remains at a
very high level of abstraction namely: identify the occurrence of the unexpected event, prepare a procedure for the handling of the event, (optionally) exploit the generated user interfaces to execute the procedure. This is also a significant difference with respect to the Cameleon framework that targets at generating user interfaces for nominal activities of users for which tasks can be identified and described precisely.
As stated at the end of the requirements Section 3.1 it is
important that the generation time does not add delays in the handling of the adverse event. With the current environment and the process described above, the generation time (for the many procedures tested) was always below one second. This is due to the fact that the procedures are usually not very complicated (as
shown in the example represented inFig. 19). There was thus no
difference (for the operator between opening an existing window and triggering the generation of a new one).
Another important aspect for enforcing the usability of the generated user interface would have been to include ergonomic rules and heuristics. This is done informally in the UI component
data repository presented inFig. 6where information about user
interface components include the use according to their type, and how they are grouped (for instance a label being always positioned on the left of a text box in which a value has to be entered.
We have performed informal testing with the current operators of the ground segment operators and received very positive feedback who agreed that an additional user interface provides a synthetic and complementary view.
5.2. Usability of the enriched ground segment
One of the concerns that arose during the development of this work was the possible disturbance produced by the generated user interface. Indeed, the generation process results in a different user
Fig. 26. Example of the generated interactive synoptic according to the ICO procedure described byFig. 18.
ObCS event Rendering method
Transition
Transition ObCSNode name
Place Proc_Ready token_enters showAsCurrentTask()
checkSSADM2_isOFF_OK transition_fired showParameterOK()
checkSSADM2_isOFF_TimeOut transition_fired showParameterKO()