OATAO is an open access repository that collects the work of Toulouse
researchers and makes it freely available over the web where possible
Any correspondence concerning this service should be sent
to the repository administrator:
[email protected]
This is an author’s version published in:
http://oatao.univ-toulouse.fr/19799
To cite this version:
Pigliapochi, Roberta and Seymour, Ieuan D. and Merlet, Céline
and Pell,
Andrew J. and Murphy, Denissa T. and Schmid, Siegbert and Grey, Clare P.
Structural Characterization of the Li-Ion Battery Cathode Materials LiTixMn2–
xO4 (0.2 ≤ x ≤ 1.5): A Combined Experimental 7Li NMR and First-Principles
Study. (2018) Chemistry of Materials, 30 (3). 817-829. ISSN 0897-4756
Structural Characterization of the Li-Ion Battery Cathode Materials
LiTi
x
Mn
2
−x
O
4
(0.2
≤ x ≤ 1.5): A Combined Experimental
7
Li NMR and
First-Principles Study
Roberta Pigliapochi,
†Ieuan D. Seymour,
†Céline Merlet,
†,‡,§Andrew J. Pell,
†,∥Denissa T. Murphy,
⊥Siegbert Schmid,
⊥and Clare P. Grey
*
,††Department of Chemistry, University of Cambridge, Cambridge CB2 1EW, United Kingdom
‡CIRIMAT, Université Toulouse 3 Paul Sabatier, CNRS, INPT, Bât. CIRIMAT, 118, route de Narbonne, 31062 Toulouse cedex 9,
France
§Réseau sur le Stockage Électrochimique de l’Énergie (RS2E), Fédération de Recherche CNRS 3459, 33 rue St. Leu, 80039 Amiens,
France
⊥School of Chemistry, University of Sydney, Sydney, NSW 2006, Australia
*
S Supporting InformationABSTRACT: Titanium doping in lithium manganese oxide spinels was shown to be beneficial for the structural stability of the potential Li-ion battery cathode materials LiTixMn2−xO4, 0.2≤ x ≤ 1.5, yet the distribution of Li/Ti/Mn in the structure and the cation oxidation states, both pivotal for the electrochemical performance of the material, are not fully understood. Our work investigates the changes in the local ordering of the ions throughout this series by using a combination of 7Li NMR spectroscopy and ab initio density functional theory calculations. The7Li NMR shifts arefirst calculated
for a variety of Li configurations with different numbers and arrangements of Mn ions in the first metal coordination shell and then decomposed into Li−O−Mn bond pathway contributions to the shift. These Li−O−Mn bond pathways are then used to simulate
and assign the experimental NMR spectra of different configurations and stoichiometries beyond those in the initial subset of configurations via a random distribution model and a reverse Monte Carlo approach. This methodology enables a detailed understanding of the experimental7Li NMR spectra, allowing the variations in the local ordering of the ions in the structure to be identified. A random distribution of Ti4+−Mn3+/4+sites is found at low Ti content (x = 0.2); an inhomogeneous lattice of Mn4+
-rich and Ti4+-rich domains is identified for x = 0.4, and single-phase solid solution is observed for x = 0.6 and 0.8. A mixed Li− Mn2+tetrahedral and Li−Mn3+/4+−Ti octahedral configuration is determined for the x = 1.0 case. A specific cation ordering in
the partially inverse LiTi1.5Mn0.5O4 case is found, which transforms into a two-phase network of disordered Mn3+-rich and
ordered Mn2+-rich domains for x = 1.1−1.4.
■
INTRODUCTIONSpinel-type lithium metal oxides are interesting cathode materials for rechargeable Li-ion battery applications. The robust host structure of spinel oxides retains capacity for many cycles, and the three-dimensional network of interstitial sites allows high Li diffusion rates.1,2 LiMn2O4 spinel has been studied as a potential alternative to the more widely used LiCoO2 because of its lower cost, lower toxicity, and higher thermal stability.2,3However, the application of LixMn2O4as a
positive electrode is limited by the presence of Jahn−Teller active Mn3+ions, which accelerate structural degradation of the
material upon cycling due to a cooperative Jahn−Teller distortion.4 Moreover, the charge disproportionation of 2Mn3+ → Mn4+ + Mn2+ results in the formation of Mn2+ ions, which dissolve in the electrolyte at the surface of the
particles and deplete the spinel framework of transition-metal ions.5 The electrochemical properties and the structural stability of LiMn2O4 were shown to be improved by
introducing excess Li in the spinel structure to form Li1+αMn2−αO4.6−9 The inclusion of the excess lithium raises the average Mn oxidation state, thereby reducing the amount of Jahn−Teller active Mn3+ ions. Another approach to limit the
negative effects of the cooperative Jahn−Teller distortion has been to partially substitute the Mn ion with other transition metals (TM) such as Ni, Zn, and Ti, hence stabilizing the structural integrity of the electrode upon cycling.10−13
Under-Received: October 16, 2017 Revised: December 26, 2017 Published: December 27, 2017
standing the structural ordering and the distribution of Li/TM ions in the structure is central to rationalizing the relationship between the electrochemical performance and the physical properties of the material. As an example, the kinetic and electrochemical properties of the high-energy LiNixMn2−xO4
cathode material have been analyzed in relation to the complex cation ordering throughout the series, unraveling the key role of compositional (dis)order in the electrochemical performance of this material.14Here, the randomization of Ni/Mn ions among the octahedral sites of the spinel lattice was proposed to lead to improved electrochemical performance.
In this work, we focus on the series of materials LiTixMn2−xO4 with 0.2 ≤ x ≤ 1.5 and study the structural
changes of the Mn-oxide spinel framework as an effect of Ti doping. In spinel materials of general formula AB2O4, the
oxygen anions form a face-centered-cubic sublattice, within which octahedral (Oh) and tetrahedral (Td) interstitial sites are present in a 2:1 ratio. In a normal spinel, the A cations occupy the Td sites, and the B cations occupy the Oh sites (denoted as A[B2]O4), while in an inverse spinel, the B cations occupy all of
the Td sites and half of the Oh sites, and the A cations occupy the other half of the Oh sites (denoted as B[AB]O4). In the
case of LiTixMn2−xO4, the partial substitution of Mn with Ti
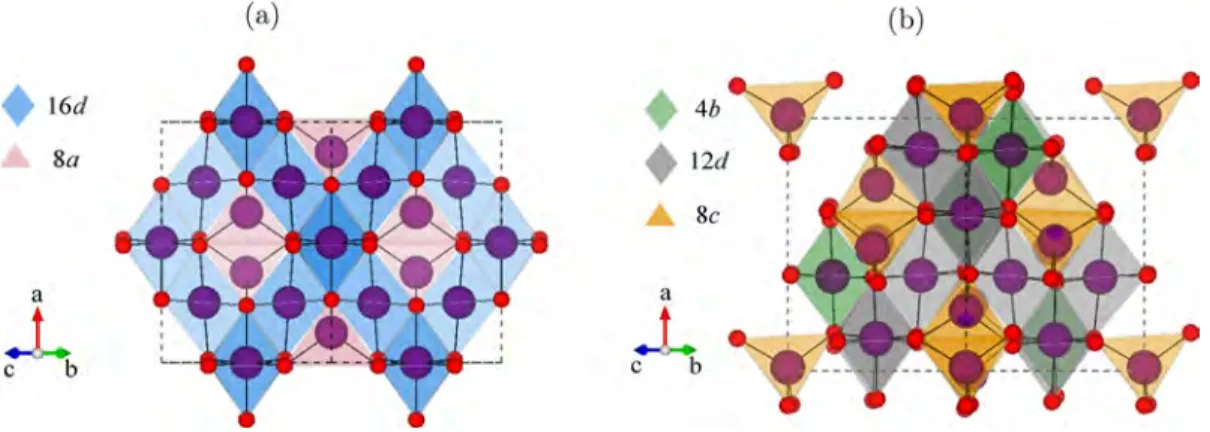
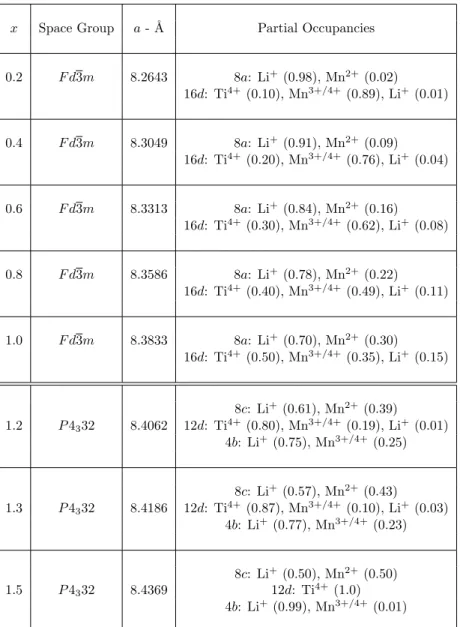
results in a mixed cation occupancy on both the Oh and Td sites of the spinel lattice.15,16In the LiTixMn2−xO4series for 0.2 ≤ x ≤ 1.0, the disordered Fd3̅m cubic spinel preferentially forms (Figure 1a) with proposed partial occupancy of Li+/Mn2+ and Li+/Ti4+/Mn3+/4+on the tetrahedral 8a and the octahedral 16d sites, respectively, and with the Li(Oh)/Mn2+(Td) fraction increasing with increasing Ti content. For x > 1.0, the more ordered P4332 cubic spinel also starts to form (Figure 1b), in
which it was proposed that the two inequivalent octahedral sites, 4b and 12d, are occupied by a mixture of Li+/Mn3+/4+and a mixture of Li+/Ti4+/Mn3+/4+ ions, respectively, while the
tetrahedral 8c sites are partially occupied by Li+/Mn2+ions.15,16
A detailed study using synchrotron X-ray, neutron powder diffraction, and XANES spectroscopy further investigated the effects of different sintering temperatures and cooling regimes during synthesis on the phase behavior of LiTiMnO4.17 Although it is a challenge to provide an accurate description of the coordination site disorder throughout the LiTixMn2−xO4
series because of the presence of multiple mixed-valence transition metals, a detailed characterization of the structure provides the fundamental basis with which to understand and monitor the electrochemical properties of the material. Analysis
based on X-ray diffraction (XRD) showed limited accuracy in determining the distribution of Li, Ti, and Mn ions in the lattice due to the difficulty of detecting Li in the presence of heavier elements and of distinguishing between Ti and Mn, which have similar X-ray scattering factors.15,16 Electron spin resonance (ESR) studies were also used in combination with XRD analysis, but the presence of multiple Mn oxidation states made the assignment of the TM distribution challenging.16
6/7Li NMR has been successfully used to characterize the
local Li environments and the cation ordering in similar systems such as LiMn2O4,
18,19
LiZnxMn2−xO4, 19−21
and LiNixMn2−xO4,19,22 as well as in Li-excess Mn oxides, Li1+αMn2−αO4.23,24 The dominant interaction leading to the observed6/7Li NMR shift in this class of paramagnetic materials is the isotropic Fermi contact (FC) hyperfine interaction,25−27 which results from the coupling between the nuclear moment of the Li and the time-average of the local field due to the unpaired d electrons present on the neighboring TM ions.19,28 In the series of systems studied here, Ti is present as Ti4+ throughout (i.e., d0ion); hence, the only paramagnetic centers are the Mn2+/3+/4+ sites (i.e., d5/d4/d3ions, respectively). The
Fermi contact interaction is proportional to the unpaired spin density transferred from the d orbitals of Mn to the s orbitals of Li. This transfer can occur either directly through the overlap of the involved orbitals or, more prominently in the systems studied here, indirectly via the bridging oxygen p orbitals which form Mn−O−Li bond pathways. The observed 7Li Fermi
contact shift is hence given by the sum of the individual Mn− O−Li pathway contributions.29The sign and magnitude of the shift depend on the geometry and covalency of the pathway as well as on the Mn oxidation state and on the magnetic susceptibility of the material. In mixed cation systems, the variety of Li environments often results in a multitude of paramagnetic shifts and a significant broadening of the resonances, making the spectra difficult to interpret.30 Computational predictions and ab initio calculations of paramagnetic NMR parameters constitute a robust and invaluable aid for the understanding of experimental NMR spectra of paramagnetic solids.
In this work, we report a detailed 7Li magic-angle spinning (MAS) NMR spectroscopy investigation of the LiTixMn2−xO4
spinel series using state of the art spectroscopic methods for paramagnetic materials.31 The interpretation of the exper-imental spectra is supported by first-principles density func-tional theory (DFT) calculations of the magnetic interactions
Figure 1.Polyhedral representation of a general spinel-type AB2O4in the Fd3̅m (a) and P4332 (b) space group with the A and B cations shown in
purple spheres and the oxygens shown in red spheres. The crystallographically independent octahedral and tetrahedral sites are represented by polyhedra of different colors as labeled.
and 7Li NMR shifts. Different LiTi
xMn2−xO4 structures of
(possibly fictitious) ferromagnetically aligned TM ions are simulated, from which we calculate the Mn−O−Li bond pathway contributions to the7Li hyperfine shift of the various environments, nominally at 0 K.29To compare these shifts with the experimental spectra obtained at finite temperature, we evaluate the possible Mn−Mn magnetic interactions, determine the Curie−Weiss magnetic factors, and use these to scale the shifts obtained with density functional theory (DFT) to the paramagnetic regime of the NMR experiments (performed at room temperature).32,33 The library of bond pathway contributions are subsequently used to simulate the spectra of different LiTixMn2−xO4configurations in a combined random distribution model and reverse Monte Carlo approach, allowing the characterization of the cation ordering throughout the series. A random distribution of Ti4+−Mn3+/4+sites among the octahedral 16d environments (Fd3̅m) is found at low Ti content (x = 0.2), which transforms into a lattice of Mn4+-rich and Mn3+-rich phases for x = 0.4 and a single-phase solid
solution for x = 0.6 and 0.8. A partially inverse spinel configuration is identified for x = 1.0 with mixed Li−Mn2+
tetrahedral sites and mixed Li−Mn3+/4+−Ti octahedral sites. A specific ion distribution is identified for the LiTi1.5Mn0.5O4case, involving ordering between the tetrahedral 8c and the octahedral 4b and 12d sites in the P4332 lattice, corresponding to (Li0.6Ti0.1Mn0.3)8c[(Li0.4Mn0.2)4b(Ti1.4)12d]O4. This further
transforms into a network of Mn3+-rich disordered Fd3̅m and
Mn2+-rich ordered P4332 domains for the x = 1.1−1.4 series.
■
EXPERIMENTAL METHODSSynthesis of LiTixMn2−xO4 (0.2 ≤ x ≤ 1.5). LiTixMn2−xO4
samples (x = 0.2, 0.4, 0.6, 0.8, 1.0, 1.1, 1.2, 1.3, 1.4, and 1.5) were prepared via the solid-state synthesis method presented in detail in ref
17. Details of the synthetic procedure are described in theSupporting Information. Table S1 in theSupporting Informationsummarizes the crystal data and cation compositions of the LiTixMn2−xO4series (x =
0.2, 0.4, 0.6, 0.8, 1.0, 1.2, 1.3, 1.5) reported in previous XRD studies.16 Solid-State MAS 7Li NMR. Solid-state NMR spectra of the LiTixMn2−xO4samples (0.2≤ x ≤ 1.5) were acquired on a Bruker 200
Avance III spectrometer using a 1.3 mm probe with a MAS frequency of 60 kHz. The one-dimensional 7Li spectra were recorded using a double-adiabatic spin−echo sequence,31 employing a pair of 50 μs tanh/tan short high-powered adiabatic pulses (SHAPs) of 5 MHz sweep width34,35and a 1.025μs 90° excitation pulse. All pulses used a radiofrequency (RF)field strength of 244 kHz. For each spectrum, 32 768 scans were acquired using a recycle delay of 30 ms. The experimental 7Li NMR spectra were fitted using the DMFIT software.36 An initial model was set up with components based on
the hyperfine shifts predicted with DFT calculations, and the fitting of the isotropic region and the sideband pattern was then obtained by optimizing the shift and the amplitude of the deconvoluting regions.
■
COMPUTATIONAL METHODSFormation Energies and Thermodynamical Phase Stability. Methodology of Thermodynamical Phase Stability Analysis. The thermodynamical phase stability of the LiTixMn2−xO4 series was
studied by calculating the formation enthalpy of various structures with different stoichiometries. For LiTi2O4and LiMn2O4, crystal structures
were obtained from the International Crystal Structure Database (ICSD) and fully relaxed (i.e., both the unit cell parameters and the atomic positions were allowed to vary) using DFT. From the LiTi2O4
and LiMn2O4 unrelaxed crystal structures, selected intermediate
stoichiometries of the LiTixMn2−xO4series were generated using the
Site Occupancy Disorder (SOD)37and the Cluster-Assisted Statistical Mechanics (CASM)38,39 softwares. Specifically, for x = 0.5, 1.0, and 1.5, small cells of 14 atoms were considered, where all possible swaps
between Li, Ti, and Mn were enumerated. For the x = 1.25 and 1.5 cases, additional configurations were considered: for larger cells of 56 atoms, all configurations were enumerated starting from LiTi2O4and
replacing (2−x) Ti ions with Mn ions. Additionally, swaps between Li, Mn, and Ti were allowed to include inverse spinel lattices in the analysis, i.e. networks of mixed Ti−Mn−Li occupancy on both the tetrahedral and the octahedral sites were generated.
Details of GGA+U Calculations of Formation Energies. The unit cell parameters and atomic positions of each generated configuration were relaxed with DFT using the PBE40 spin-polarized generalized gradient approximation (GGA) functional within the VASP code.41 The projector augmented waves (PAW)42 method was used with a plane-wave cutoff of 500 eV and an energy tolerance of 10−6 eV,
resulting in a convergence of the energy of approximately 4 meV/ atom. A force tolerance of 10−5eV/Å was used for ionic relaxations, resulting in a convergence of the energy of approximately 4 meV/ atom. A force tolerance of 10−5 eV/ \AA was used for ionic relaxations. The electronic energy of each relaxed structure was calculated with a single-point energy minimization. The reciprocal space sampling was performed with a k-point grid of 8× 8 × 8 points for the smaller cells (14 atoms) and 4× 4 × 4 points for the larger cells (56 atoms). To correct for the self-interaction error in the GGA formalism, a Hubbard U parameter was included for the Mn ions to treat the 3d correlations.43 In this work, the approach proposed by Liechtenstein was used,44 where the Coulomb matrix (U) and the exchange matrix (J) are combined to give an overall effective value Ueff
= U− J. The value of J was fixed to 1 eV throughout. In a previous study by Wang et al.,45 values of Ueff = 4.5, 4.0, and 3.5 eV were
calculated for Mn2+, Mn3+, and Mn4+ions, respectively. Because in our systems the Mn ions are present in multiple oxidation states, an average Ueffvalue of 3.9 eV was chosen for all the Mn sites.
Paramagnetic Shift Calculations. The calculation of the Fermi contact shift, δFC, adopted in this work follows the methodology
presented by Kim et al.,46which is summarized here. In this method, the hyperfine coupling constant, Aiso, isfirst calculated from the system
in the ferromagnetic state nominally at 0 K and then scaled using a Curie−Weiss factor, Φ, to match the paramagnetic regime typical of NMR experiments. δ ν = A Φ h 10 2 FC iso 6 (1) with μ μ μ ψ = | α β− | A 2 g g 3 iso 0 B N e I N 2 (2) and μ μ θ Φ = − B k g S T 3 ( ) 0 eff2 B e B (3)
where h is the Planck constant,ν is the Larmor frequency, |ψNα−β|2is the
unpaired spin density at the Li nuclear position, B0 is the static
magneticfield, μeffis the effective electronic magnetic moment, μBis
the Bohr magneton, S is the formal electronic spin of the paramagnetic center(s), kBis the Boltzmann constant, geis the free-electron g-value,
gIis the nuclear g-factor, T is the temperature used in the experiments,
here estimated to be 320 K to account for frictional heating due to MAS NMR, andθ is the Weiss constant. In this work, μeffis taken to
be the spin-only value of μ2 B S S( +1). This is considered a good approximation for the class of systems studied here. As an example, in the case of LiMn2O4 with an average oxidation state of Mn3.5+, S =
1.75, and the calculated spin-only value is μeff = 4.39 μB, in good
agreement with the experimentalμeffrange of 4.33−4.36 μBreported
by Masquelier et al.47
Methodology for Calculating the Magnetic Parametersθ and Φ. Values of θ were obtained ab initio by calculating the magnetic exchange coupling constants, J, by a multivariate linear regression of the DFT-calculated energies of systems with different magnetic configurations of coupled spins. More details of the method are
presented in the Supporting Information. The calculations of the various exchange coupling constants were performed on selected structures, i.e., the lowest energy configurations for the LiTi0.5Mn1.5O4,
LiTiMnO4, LiTi1.25Mn0.75O4, and LiTi1.5Mn0.5O4 stoichiometries,
containing networks of Mn3+/4+, Mn3+, Mn2+/3+, and Mn2+ ions, respectively. When equivalent Mn−Mn interactions are present in different lattices, the corresponding J values were found to differ by less than 3%, differences arising from local distortions of the optimized geometries. All of the considered structures containing Mn3+ions were found to exhibit a cooperative Jahn−Teller distortion.
Methodology of Hyperfine Coupling Constant, Aiso, Calculation.
The isotropic value of the hyperfine tensor Aiso, ineq 2, was calculated
with DFT by integrating the unpaired electron spin density,|ψNα−β|2,
directly at the Li nuclear position in the ferromagnetic state, which was then scaled to the paramagnetic regime by multiplying it by the scaling factor Φ (eq 1).46 The bond pathway decomposition method presented by Middlemiss et al.29 was followed to obtain the Mn− O−Li Fermi contact bond pathway contribution from each Mn ion to the total Li shift using the computed site-specific scaling factor, Φi.
Details of Hybrid DFT/Hartree−Fock Calculations of Para-magnetic Shifts. All calculations of Para-magnetic and hyperfine parameters were performed in CRYSTAL09,48 a solid-state DFT code using a Gaussian-type basis set to describe core states accurately. Because of the high dependence of the calculated paramagnetic shifts on the quality of the Gaussian basis sets, two types were utilized: a smaller basis set for geometry optimizations, and a more extended basis set for hyperfine and magnetic single-point calculations. More details are given in theSupporting Information. All calculations were performed with hybrid functionals in the spin polarized state. Previous ab initio studies on 7Li paramagnetic NMR shifts show that values
obtained using 20 and 35% Hartree−Fock (HF) exchange provide the upper and lower bounds for the experimental shifts.29,30 Hence, separate calculations were performed with the B3LYP functional with 20% HF exchange49 (denoted HYB20) and a modified B3LYP with 35% of HF exchange (denoted HYB35). The convergence of the energy and the spin density were checked with respect to the number of sampled points in the reciprocal space. The reciprocal space sampling was performed with a k-point grid of 4× 4 × 4 points in the simulated cells, which contain 56 atoms. Self-consistent field cycles were converged to an energy difference of 2.7 × 10⁻⁶eV.
Simulation and Fitting of the 7Li NMR Spectra. Random
Solution Model of a Single Phase. To use the Fermi contact bond pathway contributions calculated from DFT to simulate model NMR spectra, one needs to know the possible cationic environments around the lithium ions and the population distribution among these environments. The simplest approximation that can be made to obtain such distributions of environments is to consider that there is no cation ordering, and thus, the cations are randomly distributed in the sites available to them. This approach corresponds to the random solid solution model. In the regular spinel structure, Li centers have the following neighboring cations: (1) each Li in a Td site has 12 neighbor cations located on Oh sites, which are each bound via an oxygen bridge and considered to contribute to the overall Fermi contact shift of this lithium; and (2) each Li in an Oh site has 12 neighbor cations, 6 of which are in Td sites and 6 of which are in Oh sites, which are each bound via an oxygen bridge and considered to give (different) contributions to the overall Fermi contact shift of this lithium. To simulate the NMR spectrum, we thus need to know (i) how the Li ions are distributed between Td and Oh sites and (ii) what ions are present in each Li neighboring shell. Once we know these possible configurations, we can calculate the corresponding Fermi contact shifts and estimate the probability of these environments to simulate the NMR spectrum. In the random solution model, for each Li environment with a given number of Mn and Ti neighbors, the number of all possible configurations is calculated with the corresponding probability p modulated by the stoichiometric ratio of the ions in the structure. For each environment, a Gaussian distribution is then generated of the form G = p·exp[−(δ − ∑ δpath)2/(2ω2)]. In this formula, p is the probability associated with the
environment considered,δ is the range of resonance values for which
the distribution is calculated,∑ δpathis the sum of all relevant bond
pathway contributions to the shift involved in the particular environment, andω is the Gaussian width. An approximate Gaussian peak width of 15 ppm was used to model the individual environments based on previous NMR studies on LiMn2O4.19The simulated NMR
spectrum is then obtained as the sum of the Gaussian plots corresponding to the various environments present in the system.
Reverse Monte Carlo Simulations of a Single Phase. While in some cases, the random solution model provides a good agreement with the experimental data, in other cases, such as the LiTi1.5Mn0.5O4
material studied here, it does not, and there is a need to calculate the populations of lithium environments according to different conditions. Here, for this purpose, we use a simulation method inspired by reverse Monte Carlo approaches. The idea of a reverse Monte Carlo method is to build a large simulation box that is representative of the system under study and explore the effect of configurational changes. Starting from an initial configuration, i.e. a large number of ions with defined positions in space, we allow certain moves which are accepted or rejected depending on their agreement with chosen constraints.
In the present case, we built the large simulation box by replicating an initial spinel structure corresponding to LiTi1.5Mn0.5O4in the P4332
space group. The initial structure contained 56 atoms corresponding to (i) 8 Li ions in Td sites (8c), (ii) 12 Ti ions and 4 Mn ions in Oh sites (12d and 4b, respectively), and (iii) 32 oxygen sites (8c and 24e). This simulation box was replicated 10 times in all 3 dimensions, leading to a large simulation box containing 8000 Li ions, 12 000 Ti ions, 4000 Mn ions, and 32 000 oxygen ions. We checked that this 10 × 10 × 10 system is large enough by simulating some of the NMR spectra with a larger box of 15× 15 × 15 repeat units. The results from the two system sizes showed no significant differences, and so the size of the 10× 10 × 10 cell was considered to be sufficient. Once the initial simulation box is built, the Monte Carlo method proceeds via the following steps: (1) swap two cations, (2) characterize the new Li environments, and (3) accept or reject the move according to a set of chosen rules. The swaps can be done between Li, Mn, and Ti belonging to octahedral sites (or to tetrahedral sites) or between cations belonging to different structural sites. If the simulations are done without constraints, all the swaps will be done randomly. If the simulations are done under constraints, the swaps which do not lead to Li environments conflicting with the set constraints will always be accepted, while the swaps leading to unwanted Li environments will be accepted with a small probability. The acceptance probability of unwanted moves is Pacc= exp(−Ea/kBT). Here, for all simulations, Ea
was taken to be 10 eV, i.e. the probability of having unwanted Li environments is very close to zero. In this work, the constraints are set based on the experimental7Li NMR isotropic shifts. For example, if
the spectrum of a particular composition does not show peaks at negative shifts, this is used as a constraint in the Monte Carlo simulation, which associates a small probability to the Li environments calculated to have negative shifts.
In addition to the swaps between the cations present in the structure, the Monte Carlo moves can include changes between different cation types. This is needed to reach some of the intermediate x values in the series. For example, on going from LiTi1.5Mn0.5O4 to LiTi1.4Mn0.6O4, a number of Ti ions need to be
replaced by Mn ions and some Mn2+ions (the only Mn oxidation state
possible for LiTi1.5Mn0.5O4) will be converted to Mn3+ ions. These
changes in cation types are also made with or without constraints. Once a satisfactory representation of the system has been reached, in terms of (i) Li distribution in Td and Oh sites and (ii) stoichiometry of the structure, the number of Li cations in each environment is simply counted, the corresponding shifts are calculated and, as in the random solution model representation, the simulated NMR spectrum is then obtained by summing the Gaussian plots corresponding to the various environments present in the system.
Model for Two Phase Systems. The random solution model and Monte Carlo approaches described above werefirst used to simulate homogeneous (single-phase) systems. In the LiTixMn2−xO4series, this
single phase representation is able to depict only part of the series of materials. To investigate the possibility of having inhomogeneous
systems, we simulated independently two single-phase NMR spectra and summed them according to the fractions of the structure corresponding to each of the phases present in the system. In the Monte Carlo simulations, we built a single simulation box with two regions, each of the regions corresponding to a given phase.
■
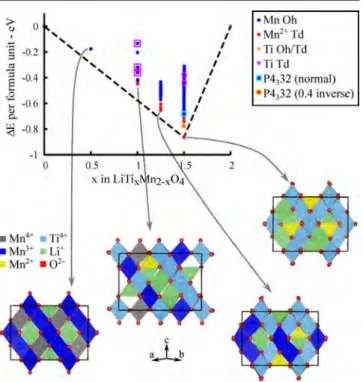
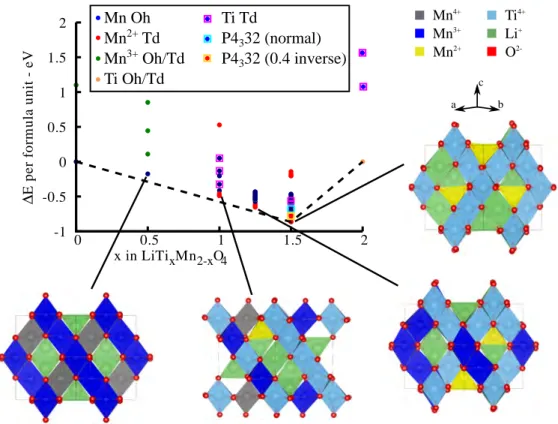
RESULTS AND DISCUSSIONGeometry Optimization and Energy Profile. Figure 2
compares the formation energies of a number of structures in
the LiTixMn2−xO4 series with formation energies below 0 eV,
which are all obtained using the search strategy described in the previous section. The full set of simulated structures is shown in Figure S1 of the Supporting Information. The convex hull (tie-line inFigure 2) is obtained by joining the stable structures obtained by the search. The LiTi1.5Mn0.5O4phase corresponds to the bottom of the hull with the lowest energy configuration having all the Mn2+ions on tetrahedral sites, in agreement with
the results of Petrov et al. based on X-ray diffraction.16This configuration corresponds to the phase having a 1:1 Mn2+:Li+
mixed occupancy of the Td sites, and a 0.75:0.25 Ti4+:Li+mixed occupancy of the Oh sites, i.e., in the A[B2]O4 notation, Li0.5Mn0.5[Li0.5Ti1.5]O4, with cubic P4132 space group
symme-try. For stoichiometries with x > 1.0, which have mixed Mn2+−
Mn3+oxidation states, the lowest energy structures are the ones having Mn2+ ions on tetrahedral sites and Mn3+ and Ti4+ on
octahedral sites, consistent with previous X-ray diffraction results.16 For stoichiometries of 0.2 ≤ x < 1.0, which have mixed Mn3+−Mn4+ oxidation states, the lowest energy structures are the ones having full Li occupancy of the tetrahedral 8a sites, and Mn3+−Mn4+−Ti4+ on the octahedral
16d sites. For the case of x = 1.0, the normal spinel (Li[TiMn3+]O
4) has all Mn ions nominally in the 3+ oxidation
state. Our results show that this ordering does not correspond to the lowest energy structure of this composition. Wefind that the thermodynamically favorable ordering for x = 1.0 is the partially inverse spinel with mixed Li−Mn2+occupancy of the
tetrahedral (8a) sites and mixed Li−Mn3+−Mn4+−Ti4+
occupancy of the octahedral (16d) sites, in agreement with previous X-ray diffraction studies.15,16The mixed Mn oxidation state in the inverse spinel results from the charge disproportio-nation of Mn(8a)3+ +Mn(16d)3+ → Mn(8a)2+ +Mn(16d)4+ , in agreement with
the preferential occupancy of the Td (8a) sites by Mn2+ over
Mn3+.15,16Our results show that configurations with mixed Li− Ti occupancy of the tetrahedral sites and mixed Li−Mn3+−Ti
occupancy of the octahedral sites are thermodynamically unfavorable. This is in agreement with the XRD studies of Petrov et al.16and Krins et al.15A recent work by Murphy et al.17 based on synchrotron X-ray and neutron powder diffraction, however, indicated partial occupancy of Ti in the tetrahedral sites of the LiTiMnO4 lattice, which was not reported in the previous studies15,16 nor reproduced by our DFT results.
According to the presented analysis based on the calculated formation energies, we can gain some insights into the more stable cation distributions in the spinel lattice, and the results we work with are gathered inTable 1.
Solid-State NMR. Full one-dimensional 7Li
double-adiabatic spin−echo31 spectra of the LiTixMn2−xO4 powder samples (0.2≤ x ≤ 1.5) are given in Figure 3a. The double-adiabatic spin−echo sequence was chosen to obtain an efficient inversion of the whole spinning-sideband pattern, here of more than 400 kHz width.50 The corresponding central regions of the spectra are shown inFigure 3b. The intensity ratio between the centerband and the sidebands did not change across the spectra, and for this reason wefit only the isotropic resonances. The variety of Li environments occurring in each phase leads to multiple distinct resonances and a broad isotropic region. The resonances, on average, range from around 500 to 30 ppm with the increase in Ti concentration. We also note that the spectrum is significantly broader for intermediate x values with the central regions covering a range of almost 600 ppm for 0.6 ≤ x ≤ 1.0.
The distribution of discrete resonances giving rise to the broad spectra observed are due to Li ions in different local environments. These Li ions have different numbers of Mn2+, Mn3+, and Mn4+ ions in their local coordination sphere, each
contributing differently to the 7Li Fermi contact shift. The shifting of the resonances to lower frequency with the increasing Ti concentration is consistent with the decrease in
Figure 2. Formation energy per LiTixMn2−xO4 formula unit vs
fractional Ti concentration (x) in the LiTixMn2−xO4 series. The
convex hull is indicated with a dashed line. Insets show the minimum-energy structure for each of the studied points of the series. The majority of the structures with energies plotted have Ti4+ ions on
octahedral sites; those with Ti4+on tetrahedral sites are indicated by
blue circles corresponding to Oh Mn and outer magenta squares corresponding to Td Ti.
Table 1. Summary of the Energetically Favorable Tetrahedral (Td) and Octahedral (Oh) Occupancies Obtained from the DFT Analysis of the Formation Energies throughout the LiTixMn2−xO4Series
x in LiTixMn2−xO4
0.2≤ x < 1.0 x = 1.0 1.1≤ x ≤ 1.5
Td sites Oh sites Td sites Oh sites Td sites Oh sites
Li+ Mn3+ Li+ Li+ Li+ Li+
Mn4+ Mn2+ Mn3+ Mn2+ Mn2+
Ti4+ Mn4+ Mn3+
the average Mn oxidation state and the decrease in the overall concentration of paramagnetic Mn ions.28 A more detailed understanding of the structural differences across the series is now presented based on the DFT analysis of the Fermi contact interaction.
DFT Calculation of Magnetic and Hyperfine Parame-ters. As described previously (eq 3), the magnetic scaling of the hyperfine interaction was modeled via a mean field approach based on the exchange coupling interaction between Mn pairs, as shown in Figure 4. Mn3+ has a (t
2g)3 (eg*)1
electronic configuration, which makes it Jahn−Teller active. Consequently, different exchange couplings and Fermi contact interactions were identified, depending on whether the pathway involves the Jahn−Teller lengthened or shortened Mn−O bond. The calculated Jnvalues are presented in Table 2. The
results agree well with the values reported by Lee et al. and Clément et al. for similar Mn oxides such as MgMn2O433and
NaMnO2.32 Additionally, the accuracy of the calculated exchange integrals is tested for the LiTi0.4Mn1.6O4 case by
comparing the magnetic scaling factors obtained with the mean field approach and using the experimental magnetic suscept-ibility. The computational and experimental results obtained are in good agreement, and the details of the comparison are presented in theSupporting Information. The magnitude of the exchange interactions is sensitive to the distance between the coupled ions as well as to the coupling mechanism between the involved orbitals. As an example, we compare the exchange interactions between Mn3+−Mn3+ in octahedral sites. The J
4
coupling (Figure 4, center) involves four Jahn−Teller shortened Mn−O bonds which allow direct overlap between the Mn t2g orbitals, leading to a strong antiferromagnetic
exchange interaction. The J3 coupling (Figure 4, center) involves two Jahn−Teller shortened and two Jahn−Teller elongated Mn−O bonds, the latter ones reducing the direct overlap between t2gorbitals and hence the strength of the direct
exchange interaction. The superexchange interaction between the orbitals along the Jahn−Teller axis (dz2−dxz/yz) results in a
combination of weak ferro- and antiferromagnetic interactions, resulting in a significantly smaller J3 coupling that is
antiferromagnetic overall.
The possible Mn−O−Li bond pathways were identified for Li occupying Td as well as Oh sites. All the Li environments and corresponding pathways are described inFigure 5and are presented in Table 3. As rationalized by Carlier et al.,51 the transfer of paramagnetic electron spin from the Mn t2g/eg*
orbitals to the s orbitals of the Li occur primarily via a superexchange-like mechanism. As presented ineq 1, the sign and magnitude of the Fermi contact shift are determined by a combination of factors. The extent of the transferred spin density as well as the strength of the magnetic interaction discussed previously strongly depend on the bond distances between the involved sites and on the orbitals involved in the interaction.51 The Mn−O−Li pathways in these systems
Figure 3.(a)7Li NMR spectra of the LiTixMn2−xO4series with the
first-order sidebands enlarged in the top insets. (b) Expanded view of the isotropic resonances of the spectra.
Figure 4. Mn−Mn exchange coupling constants identified in the studied systems, i.e. LiTi1.25Mn0.25O4for J1and J2, LiTiMnO4for J3and
J4, and LiTi0.5Mn1.5O4 for J5. For each Jn, the reported value
corresponds to the average between the HYB20-HYB35 results.
Table 2. Comparison of the Calculated Mn−Mn Exchange Coupling Constants for Pairs of Ions Interacting via an Oxygen Bridgea
Jexc(K)
J
type magnetic interaction
Mn−Mn angle (°) HYB20 HYB35 J1 Mn2+−Mn3+JT short 120.2 −5 −3 J2 Mn2+−Mn3+JT long 120.1 −1 −1 J3 Mn3+−Mn3+JT short−JT long 90.6 −8 −3 J4 Mn3+−Mn3+JT short−JT short 97.2 −41 −32 J5 Mn4+−Mn3+JT short−JT long 96.1 15 13
aFor the couplings involving Mn3+ions, the nature of Jahn−Teller
shortened or lengthened bond involved in the interaction is also specified. The results obtained with the HYB20 and HYB35 hybrid functionals are shown separately. Different Jn types are labeled as in Figure 4.
involve intermediate angles (neither exactly 90° nor exactly 180°); hence, the spin-density transfer deviates from a pure delocalization/polarization mechanism, and a complex combi-nation of both processes is expected to occur. Nonetheless, we take the Li−O−Mn3+ pathways P
1and P2 (Figure 5, top) as
examples to give an approximate rationalization of the mechanisms involved. The P1 pathway involves the Jahn− Teller shortened Mn−O bond with positive transfer of spin density from the dxyorbital via a delocalization mechanism. The
P2pathway involves the Jahn−Teller lengthened Mn−O bond, and a combination of positive delocalization transfer from the dxz/yzorbitals and a negative polarization transfer from the dz2
orbital results in a weaker net Fermi contact interaction with the Li site.
Simulation and Fitting of the Experimental 7Li NMR
Spectra. We now demonstrate how the bond pathway contributions calculated inTable 3 can be used to model the
7Li NMR spectra of the LiTi
xMn2−xO4 series, allowing us to
extract detailed local structural information. The shift values calculated with the HYB20 and HYB35 functionals give the upper and lower bounds; however, in the following analysis, we use a pragmatic approach in which the HYB20 and HYB35 results are averaged to give a single value for each pathway P, as shown in Table 3. For all the systems containing Mn3+, we
model the Jahn−Teller distortion as a dynamic process in which the time scale of the changes in local Mn−O bond lengths is much faster than the typical NMR time scale.29As a consequence, we assume that the shifts corresponding to Mn3+−O−Li are well-represented by a weighted average with
2/
3of Jahn−Teller-short and1/3of Jahn−Teller-long pathway
contributions.29
For all the systems containing exclusively Mn3+ and Mn4+
ions, i.e. the 0.2 ≤ x ≤ 0.8 stoichiometries, we make an additional assumption. In this case, we consider that the time scale of electronic conduction is fast compared to the NMR time scale. This means that we can consider only one shift corresponding to an average oxidation state of the Mn ions. The weighted average depends on the stoichiometry of the system, as the average oxidation state is a function of the Ti content of the material. For example, for LiTi0.2Mn1.8O4, the average Mn oxidation state is 3.444, while it is 3.375 for LiTi0.4Mn1.6O4. As a result, the net shift contributions are 41
ppm for a Mn3.44+in LiTi0.2Mn1.8O4, 39 ppm for a Mn3.38+in
LiTi0.4Mn1.6O4, 37 ppm for a Mn3.29+in LiTi
0.6Mn1.4O4, and 33
ppm for a Mn3.17+in LiTi
0.8Mn1.2O4. This assumption, as well as
the accuracy of the calculated bond pathway shift contributions is tested with respect to the7Li NMR shift of LiMn2O4. This
material has been extensively studied with NMR: as discussed in detail by Lee et al.,18the NMR spectrum of LiMn2O4with Li
in the tetrahedral 8a position is dominated by one major resonance with an isotropic shift of 512−520 ppm, the exact value varying between samples and likely the temperature of the measurement. In this stoichiometry, Mn is present in an average oxidation state of 3.5+. Combining the shift contributions that we obtained with DFT, summarized in
Figure 5.7Li bond pathway contributions to the Fermi contact shift for a lithium center (in green) in a tetrahedral site (top) or in a octahedral site (bottom), each coordinated by 12 TM sites (in purple) via oxygen (in red) bonds. Manganese is shown in yellow, blue, and gray for Mn2+, Mn3+, and Mn4+, respectively. For each bond pathway
contribution P, the reported value corresponds to the average between the HYB20-HYB35 results.
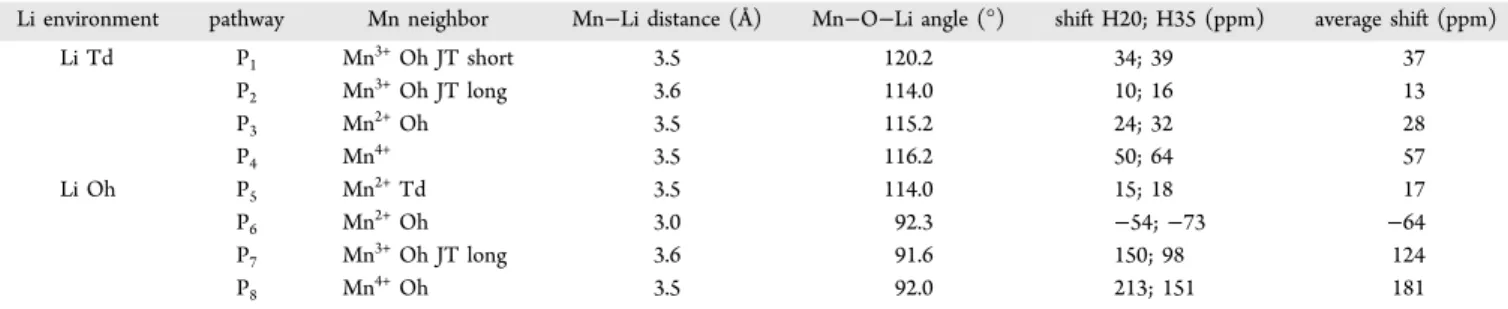
Table 3. Comparison of the Calculated Mn−O−Li Pathway Contributions to the7Li Fermi Contact Shift Obtained with Either
the HYB20 or HYB35 Functionala
Li environment pathway Mn neighbor Mn−Li distance (Å) Mn−O−Li angle (°) shift H20; H35 (ppm) average shift (ppm)
Li Td P1 Mn3+Oh JT short 3.5 120.2 34; 39 37 P2 Mn3+Oh JT long 3.6 114.0 10; 16 13 P3 Mn2+Oh 3.5 115.2 24; 32 28 P4 Mn4+ 3.5 116.2 50; 64 57 Li Oh P5 Mn2+Td 3.5 114.0 15; 18 17 P6 Mn2+Oh 3.0 92.3 −54; −73 −64 P7 Mn3+Oh JT long 3.6 91.6 150; 98 124 P8 Mn4+Oh 3.5 92.0 213; 151 181
aThe table rows on the top (P
1 to P4) show the possible neighboring TM sites transferring unpaired-electron spin density to a Li center in a
tetrahedral site, while the table rows on the bottom (P5to P8) show the possible sites transferring unpaired-electron spin density to a Li center in an
Table 3, and accounting for a dynamic Jahn−Teller distortion,
our calculations predict a net shift contribution of 43 ppm from a Mn3.5+ion. Given that in the LiMn2O4spinel structure each
Li is bonded via the oxygen to 12 Mn ions, the overall calculated Li NMR shift is 12× 43 = 515 ppm, in very good agreement with the experimental shift.18
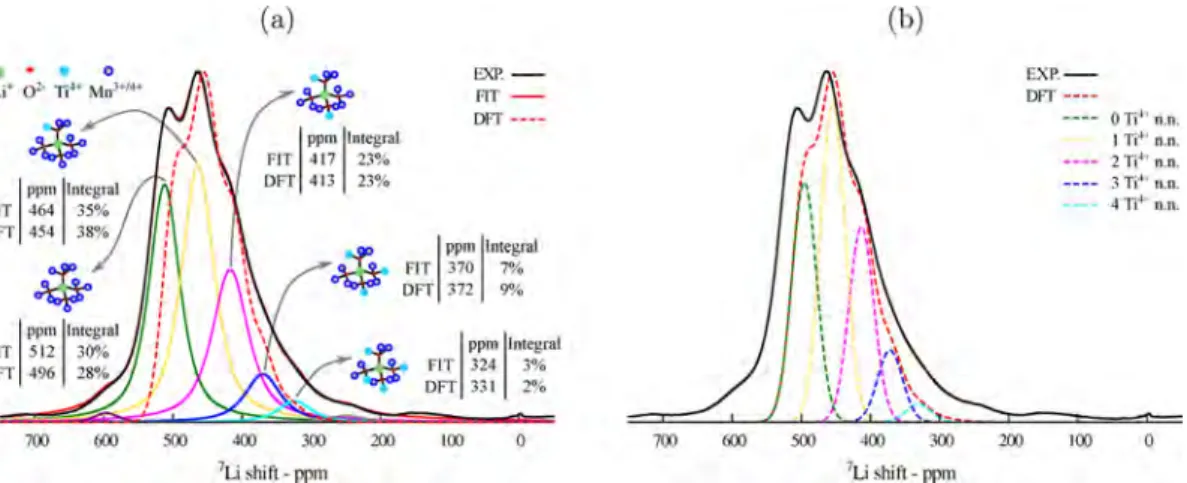
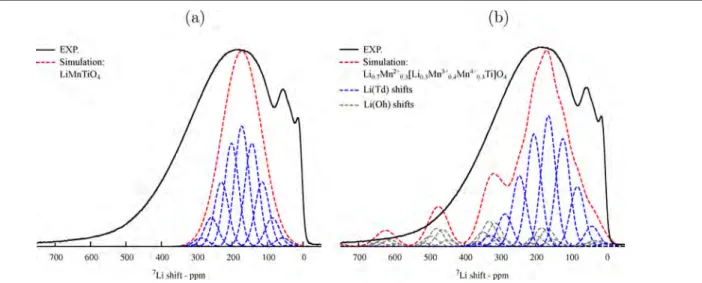
LiTi0.2Mn1.8O4. We begin our analysis of the NMR results by
considering the member of the series with the lowest Ti concentration, i.e. LiTi0.2Mn1.8O4. For this system, the 7Li
NMR spectrum was simulated assuming a random distribution of ions in the Li local coordination shell. All Li ions were placed on the tetrahedral sites, following our observation that the presence of Ti4+, Mn3+, and Mn4+ on tetrahedral sites is energetically unfavorable. The total DFT predicted spectrum is shown inFigure 6a with the individual peaks shown inFigure 6b. The spectrum is obtained as a Gaussian distribution of resonances corresponding to each Li environment with the associated total Fermi contact shift obtained as a sum of the DFT-calculated pathway contributions. The Li environment corresponding to each resonance differs from the others by the number of Ti centers among the 12 neighboring sites.
The experimental7Li NMR spectrum of LiTi
0.2Mn1.8O4was
then fitted, as shown in Figure 6a. A good fit is obtained by usingfive more intense peaks of Voigt line shape and two very weak peaks. The shift contributions predicted with DFT match very well with the values obtained from the experimental fit with a maximum discrepancy of 16 ppm. The 5 main peaks extracted from the fit are assigned to Li sites with 12 Mn neighbors (fit: 512 ppm, DFT: 496 ppm), 11 Mn and 1 Ti neighbors (fit: 464 ppm, DFT: 454 ppm), 10 Mn and 2 Ti neighbors (fit: 417 ppm, DFT: 413 ppm), 9 Mn and 3 Ti neighbors (fit: 370 ppm, DFT: 372 ppm), and 8 Mn and 4 Ti (fit: 324 ppm, DFT: 331 ppm), as shown in Figure 6a. Moreover, the relative intensities of the different peaks are accurately reproduced by the model that considers a random distribution of Ti4+and Mn3.44+among the octahedral sites. The weak peak at 595 ppm is also predicted by DFT with the model that does not consider a dynamic exchange between Mn3+and Mn4+. In particular, the shift of the Li environment coordinated
with 3 Mn3+and 9 Mn4+is calculated to be 599 ppm, in good
agreement with the experimental shift of 595 ppm.
Figure S2 in theSupporting Informationshows the results of the model that does not consider a dynamic exchange between
Mn3+and Mn4+. The line shape of the spectrum simulated in this way is not in as good of agreement with the experimental NMR spectrum, confirming that the fast Mn3+/4+hopping rate in the experimental NMR conditions is a good assumption for these systems.
0.4 ≤ x < 1.0 Stoichiometries. Following the successful description of the cation ordering for LiTi0.2Mn1.8O4with the random distribution model, we apply the same approach for the 0.4 ≤ x < 1.0 stoichiometries. As shown in Figure S3 of the
Supporting Information, the deconvolution of the isotropic region for LiTi0.4Mn1.6O4 deviates significantly from the
spectrum simulated for the random distribution model. The disagreement between the experimental NMR spectra and the simulations based on the random distribution model persists for all the 0.4≤ x < 1.0 cases, as shown in Figure S4 of the
Supporting Information.
By comparing the NMR fit of the isotropic region for LiTi0.2Mn1.8O4(Figure 6a) and that of LiTi0.4Mn1.6O4(Figure S3), we notice that (i) the major contributing peaks of the x = 0.2 spectrum have the same shifts as 5 of the major peaks in the x = 0.4 case and (ii) the spectrum of the x = 0.4 case shows an additional broad feature that extends between 300 and 100 ppm, which is absent in the spectrum of x = 0.2. In LiTi0.2Mn1.8O4, Mn has a net charge of 3.44+, while in
LiTi0.4Mn1.6O4, Mn has a net charge of 3.375+, each with
different Fermi contact shift contributions to the neighboring Li center (41 ppm for Mn3.44+and 39 ppm for Mn3.375+). The fact that thefits of the spectra for the x = 0.2 and for the x = 0.4 cases give the major peaks at exactly the same shifts indicate that in the x = 0.4 cases these correspond to Mn4+-rich Li environments. The spectrum of the x = 0.4 case simulated for the random Mn3.375+−Ti distribution does not show shifts lower than 240 ppm, in disagreement with the experimental spectrum. This suggests the presence of Mn3+-rich Li environments in the structure. The 7Li isotropic region for LiTi0.4Mn1.6O4is hence modeled as a 1:1 combination (i.e., an
average) of the LiTi0.2Mn1.8O4and LiTi0.6Mn1.4O4experimental
spectra. The resulting peaks, shown inFigure 7, reproduce the experimental spectrum of the x = 0.4 case very well, indicating a coexistence of Mn4+-rich and Mn3+-rich domains.
The spectra for the x = 0.6 and 0.8 show a gradual shift of resonances toward lower frequency with the increasing Ti
Figure 6.(a) Comparison of the experimental isotropic region of the7Li NMR spectrum of LiTi
0.2Mn1.8O4(in black with thefitting shown in red)
and the DFT-simulated resonance assuming a random distribution of Ti4+and Mn3+/4+(in dashed red). Also shown are the peaks used in thefitting
of the experimental spectrum (purple, green, yellow, magenta, blue, cyan, and gray peaks). (b) For comparison, the peaks obtained in the DFT-simulated random distribution model are shown, following the same coloring scheme as in panel (a).
concentration, indicative of a continuous solid solution behavior.16
LiTiMnO4. As described inFigure 2and inTable 1, for the x
= 1 case, our calculations predicted that the configuration with mixed Li−Mn2+ tetrahedral and Li−Mn3+/4+−Ti octahedral occupancies is more favorable than the normal spinel (Li[Mn3+Ti]O4). Studies based on X-ray diffraction reported
20−30% Li occupancy of the Oh site (or, equivalently, 20−30% Mn2+on the Td site).15,16In an attempt to model the spectrum for LiTiMnO4, we hence consider a random cation distribution
for the normal spinel lattice (Li[Mn3+Ti]O4) as well as for the
partially inverse lattice with 30% site inversion (Li0.7Mn0.32+[Li0.3Mn0.34+Mn0.43+Ti]O4). The results are shown in
Figure 8.
The spectrum simulated for the partially inverse case (Figure 8b) shows shifts over the entire 0−700 ppm region of the experimental spectrum, while the simulation for the normal spinel (Figure 8a) shows shifts only between 20−300 ppm. This confirms the presence of both Li(Td) and Li(Oh) environments in the structure, as predicted by our calculations (Table 1). However, the line shape of the experimental
spectrum is not well reproduced by the simulation for the disordered Li0.7Mn0.32+[Li0.3Mn0.43+Mn0.34+Ti]O4 lattice, particularly
between 0−100 and 350−450 ppm. This indicates that the cations are not distributed randomly in the structure, and cation ordering determines the preferential presence of certain environments over others. Due to the configurational complex-ity of the system, which contains Li/Mn2+,3+,4+/Ti ions and mixed occupancy of the Td and Oh sites, further work would be needed to systematically analyze the configurational energies of different orderings52 and possibly account for the electro-neutrality principle.53
LiTi1.5Mn0.5O4. We now turn to the interpretation of the
NMR spectra for the Ti-rich part of the series, starting with the end member LiTi1.5Mn0.5O4. In this system, we expect Li+,
Mn2+, and Ti4+ cations to be present. The formation energies
calculated with DFT shown in Figure 2 indicate that it is energetically favorable for Mn2+ions to be on tetrahedral sites, leading to (at least) a fraction of the Li ions on the octahedral sites, also suggested by previous X-ray studies.16This fraction is referred to as the inverted fraction of Li, y, in the notation Li1−yMny[LiyTi1.5Mn0.5−y]O4. The first model we test is a random distribution of Mn2+/Li+ions on tetrahedral sites and
Li+/Mn2+/Ti4+on octahedral sites. The simulated NMR spectra are shown in Figure S5 of the Supporting Information for various inverted fractions of Li from y = 0.0 (i.e., Li[Ti1.5Mn0.5 ]-O4) to y = 0.5 (i.e., Li0.5Mn0.5[Li0.5Ti1.5]O4). When the inverted
fraction is y = 0.5, all Mn2+are on tetrahedral sites; half of the Li ions are on octahedral sites, and half of the Li ions are on tetrahedral sites. None of the spectra show good agreement with the experiment. The simulated spectra show two main features in strong disagreement with the experimental data, i.e. resonances at 0 ppm and some at negative frequencies, which are clearly not present in the experimental NMR spectrum. To use this information, we thus turn to another strategy and follow an approach similar to reverse Monte Carlo, where constraints are imposed. We use as a starting point a spinel structure with a P4332 symmetry, as this was suggested by X-ray
studies on this material.16In our starting P4332 structure, the
lattice is characterized by a full Li occupancy on the tetrahedral sites and a full Ti/Mn occupancy of the octahedral sites (i.e., a regular spinel structure). This ordering corresponds to the
Figure 7.Comparison of the experimental isotropic region of the7Li
NMR spectrum of LiTi0.2Mn1.8O4(in red), LiTi0.4Mn1.6O4(in green),
and LiTi0.6Mn1.4O4 (in black), and the calculated LiTi0.4Mn1.6O4(in
dashed green) isotropic peak. This is obtained by taking the average of the peaks of x = 0.2 and 0.6.
Figure 8.Comparison of the experimental isotropic region of the7Li NMR spectrum of LiTiMnO
4(solid black line) with the simulated spectrum of
the normal Li[TiMn3+]O
4(dashed red line, a), and the simulated spectrum of the partially inverse Li0.7Mn0.32+[Li0.3Mn0.43+Mn0.34+Ti]O4(dashed red line,
presence of only one type of Li environment with 9 Ti4+and 3
MnOh2+ neighbors. The calculated shift is 3× 28 ppm = 85 ppm,
in clear disagreement with the experimental NMR (Figure 9a). Starting from the fully regular structure, the Monte Carlo simulation then allowed for some fraction of Li to move onto the octahedral environment with the consequent swap of Mn (and Ti) onto the tetrahedral sublattice. After each swap, the Li coordination environments are checked, and the corresponding shifts are calculated. If the swap leads to a“wrong“ shift (a shift ≤0 ppm), it will be accepted but only with a very low probability.
The results of the reverse Monte Carlo approach are shown in Figure 9a. The best agreement between simulation and experiment is obtained for the y = 0.4 case, shown more in d e t a i l i n F i g u r e 9b , c o r r e s p o n d i n g t o t h e Li0.6Ti0.1Mn0.3[Li0.4Ti1.4Mn0.2]O4 lattice of P4332 symmetry
with the repeated unit shown in the inset of Figure 9b. The Li environments present in the lattice are also shown with the associated NMR peaks. The good agreement between the model and the experimental spectrum allows us to conclude that the spinel network of the LiTi1.5Mn0.5O4system, of P4332
symmetry as previously reported,16 contains mixed cation occupancy of Li, Mn2+, and Ti in both tetrahedral and octahedral environments. The presented analysis also allows us to derive a specific cation ordering within P4332 network, i.e.
(Li0.6Ti0.1Mn0.3)8c[(Li0.1Ti1.4)12d(Li0.3Mn0.2)4b]O4.
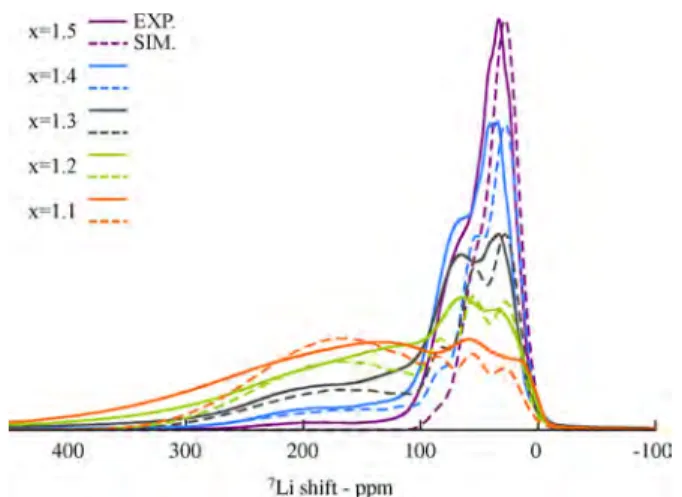
1.1 ≤ x ≤ 1.4 Stoichiometries. The reverse Monte Carlo approach was implemented further to analyze the NMR spectra of the intermediate 1.1≤ x ≤ 1.4 systems. We first look at the LiTi1.4Mn0.6O4material using exactly the same approach as for
LiTi1.5Mn0.5O4but now having a mix of Mn3+and Mn2+ions.
As highlighted previously from the DFT results, the presence of Mn3+ on tetrahedral sites is unfavorable. The NMR spectra simulated for a homogeneous LiTi1.4Mn0.6O4 system and various inverted fractions are shown in Figure S6 of the
Supporting Information. It is clear from the comparison with experiments that this model is not sufficient to describe the system. In particular, there is a broad peak with a large shift (∼200 ppm) which cannot be explained by this model, while the region of the spectrum between 0−100 ppm decreases in
intensity but does not vary in shift compared to the LiTi1.5Mn0.5O4case.
To use this information, we modify the model to retain the P4332 ordering of the Mn2+-rich phase, as shown for the x = 1.5
case, while including a random distribution of cations in the Fd3̅m Mn3+-rich phase, as shown for the 0.2≤ x ≤ 1.0 cases. In these simulations, a Gaussian width of 50 ppm was found to be required to model the Fd3̅m domain, while a Gaussian width of 12 ppm was again found to be sufficient to model the P4332 domain. This difference between the peak widths may be rationalized in terms of the higher degree of disorder among the Li environments present in the Fd3̅m phase compared to the more ordered P4332 phase. The approach is followed for
the entire 1.1 ≤ x ≤ 1.4 series. Furthermore, for each composition, the Monte Carlo simulation also optimized the inverted fraction, y, within the P4332 phase, and so we obtain for x = 1.4 Li0.8Mn0.22+[Li
0.2Mn0.22+Mn0.23+Ti1.4]O4, for x = 1.3
Li0 . 8 6Mn0 . 1 42 + [Li
0 . 1 4Mn0 . 1 62 + Mn0 . 43 +Ti1 . 3]O4, for x = 1.2
Li0.92Mn0.082+ [Li
0.08Mn0.122+ Mn0.63+Ti1.2]O4. The results are shown
inFigure 10. The good agreement between the simulated and the experimental NMR spectra throughout the 1.1 ≤ x ≤ 1.5 series suggests that as Mn2+starts to be formed in the system, it preferentially occupies the tetrahedral environment, determin-ing a partial orderdetermin-ing between Li−Mn2+ Td−Oh sites in the P4332 symmetry, while the regular Mn3+-rich component
retains a random distribution of cations consistent with the Fd3̅m symmetry. As NMR probes structural short-range ordering, it does not allow us to distinguish the sizes of the Fd3̅m and the P4332 phases. Because previous diffraction studies,16which are sensitive to long-range ordering, reported a single P4332 phase behavior for 1.2≤ x ≤ 1.4, this may suggest
that the Fd3̅m−P4332 phase segregation is on the local scale,
potentially forming small domains.
The combination offirst-principles shift calculations, random solution/Monte Carlo model, and experimental NMR enabled us to acquire a detailed understanding of the complex trend of cation ordering in the mixed LiTixMn2−xO4series. This is of
particular interest in regards to the application of this material as a cathode in rechargeable Li-ion batteries. The high degree of cation disorder found at intermediate 0.2≤ x < 1 values of the
Figure 9.(a) Isotropic region of the experimental7Li NMR spectrum of LiTi
1.5Mn0.5O4(solid black line), and the NMR results of the reverse Monte
Carlo simulation of Li1−yMny[LiyTi1.5Mn0.5−y]O4. Dotted magenta, green, blue, and yellow lines for y = 0, 0.1, 0.2, and 0.3, respectively, and the
dotted red line for Li0.6Ti0.1Mn0.3[Li0.4Ti1.4Mn0.2]O4. (b) Isotropic region of the experimental7Li NMR spectrum (in solid black line) and the
simulated spectrum (in dotted red line) of Li0.6Ti0.1Mn0.3[Li0.4Ti1.4Mn0.2]O4. For each Li coordination, the corresponding peak is shown, as
series may hinder a cooperative Jahn−Teller distortion in the bulk and facilitate the mechanical stability during electro-chemical cycling. On the other hand, the observed increasing ratio of Li(Oh)/Mn2+(Td) mixing with increasing x may hinder
the extraction of Li+from the structure, effectively resulting in a lower capacity.
■
CONCLUSIONSA detailed solid-state7Li NMR andfirst-principles DFT study of the cation ordering and the structural changes in the LiTixMn2−xO4series (0.2≤ x ≤ 1.5) was presented.7Li MAS
NMR spectra were obtained for the LiTixMn2−xO4series using state of the art spectroscopic methods for paramagnetic solids. The methodology used to analyze the NMR results involved the ab initio calculation of the magnetic and hyperfine parameters, obtaining a breakdown of the possible contribu-tions to the7Li NMR shift. These were combined into random distribution and reverse Monte Carlo models to simulate the
7Li NMR spectra of the LiTi
xMn2−xO4 series. For x = 0.2, a
random distribution of octahedral Mn3+/4+/Ti4+ cations in the Fd3̅m structure was determined, evolving into an inhomoge-neous lattice of Mn3+-rich/Mn4+-rich phases for x = 0.4 and a single-phase solid solution for x = 0.6 and 0.8. The x = 1.0 case showed partially inverse ordering of Mn3+/4+−Ti4+−Li (Oh) and Mn2+−Li(Td) sites. In the 1.1 ≤ x ≤ 1.5 structures, the
results showed the preferential formation of coexisting disordered Mn3+-rich (Fd3̅m) and ordered Mn2+-rich (partially
inverse P4332) phases. Additionally, for LiTi1.5Mn0.5O4, a
specific cation ordering within the partially inverse spinel framework of P4332 symmetry was determined, i.e.
(Li0.6Ti0.1Mn0.3)8c[(Li0.1Ti1.4)12d(Li0.3Mn0.2)4b]O4. The ability of the DFT results to reproduce the experimental 7Li NMR data is promising. The presented methodology in general and the DFT-calculated7Li NMR shifts in particular pave the way to a detailed rationalization of the solid-state NMR spectra of other paramagnetic solids. The combination of the calculated NMR shifts with the random distribution and reverse Monte Carlo methods represents a robust approach which can be extended to include additional energetic/configurational constraints to analyze other complex systems of interest to
the batteryfield such as LiZnxMn2−xO4, LiNixMn2−xO4, and the Li-excess Li1+αMn2−αO4materials.
■
ASSOCIATED CONTENT*
S Supporting InformationThe Supporting Information is available free of charge on the
ACS Publications website at DOI: 10.1021/acs.chemma-ter.7b04314.
Additional computational details, synthesis procedure, complete convex hull, additional lattice simulations, and details and results of magnetic SQUID measurements (PDF)
■
AUTHOR INFORMATION Corresponding Author *E-mail:[email protected]. ORCID Roberta Pigliapochi: 0000-0003-3714-8431 Siegbert Schmid: 0000-0002-5182-0725 Clare P. Grey:0000-0001-5572-192X Present Address∥A.J.P.: Department of Materials and Environmental
Chem-istry, Stockholm University, Svante Arrhenius Väg 16 C, SE-106 91 Stockholm, Sweden.
Notes
The authors declare no competingfinancial interest.
■
ACKNOWLEDGMENTSThe authors are thankful to Dr. Andrew J. Morris, Dr. Michael Gaultois, and David Halat for useful discussions and to Hajime Shinohara and Dr. Siân Dutton for helping with the SQUID measurements. R.P. acknowledges financial support from the People Programme (Marie Curie Actions) of the European Union’s Seventh Framework Programme (FP7/2007-2013) under REA Grant 317127. C.M. acknowledges the School of the Physical Sciences of the University of Cambridge for funding through an Oppenheimer Research Fellowship. Via our membership of the UK’s HPC Materials Chemistry Con-sortium, which is funded by EPSRC (Grant EP/L000202), this work made use of the facilities of ARCHER, the UK’s national high-performance computing service. Computational work was also carried out at the Center for Functional Nanomaterials, Brookhaven National Laboratory, which is supported by the U.S. Department of Energy, Office of Basic Energy Sciences, under Contract DE-AC02-98CH10886. R.P. and A.J.P. acknowledge funding from the Assistant Secretary for Energy Efficiency and Renewable Energy, Office of Vehicle Tech-nologies, of the U.S. DOE under Contract no. DE-AC02-05CH11231, under the Batteries for Advanced Transportation Technologies (BATT) Program subcontract no. 7057154. Data supporting this work are available from: https://doi.org/10. 17863/CAM.17508.
■
REFERENCES(1) Thackeray, M.; David, W.; Bruce, P.; Goodenough, J. Lithium insertion into manganese spinels. Mater. Res. Bull. 1983, 18, 461−472. (2) Tarascon, J. M.; Wang, E.; Shokoohi, F.; McKinnon, W.; Colson, S. The Spinel Phase of LiMn2O4as a Cathode in Secondary Lithium
Cells. J. Electrochem. Soc. 1991, 138, 2859−2864.
(3) Hunter, J. C. Preparation of a new crystal form of manganese dioxide:λ-MnO2. J. Solid State Chem. 1981, 39, 142−147.
Figure 10.Comparison of the experimental isotropic region (solid line) of the7Li NMR spectrum of LiTixMn2−xO4 and the simulated
region (dashed line) assuming a distribution of Ti4+, Mn2+, and Mn3+ in a two-component model (purple, blue, gray, green, and orange for x = 1.5, 1.4, 1.3, 1.2, and 1.1, respectively).
(4) Goodenough, J. B.; Park, K.-S. The Li-ion rechargeable battery: a perspective. J. Am. Chem. Soc. 2013, 135, 1167−1176.
(5) Thackeray, M.; Johnson, P.; De Picciotto, L.; Bruce, P.; Goodenough, J. Electrochemical extraction of lithium from LiMn2O4. Mater. Res. Bull. 1984, 19, 179−187.
(6) Chan, H.; Duh, J.; Sheen, S. LiMn2O4cathode doped with excess
lithium and synthesized by co-precipitation for Li-ion batteries. J. Power Sources 2003, 115, 110−118.
(7) Rossouw, M.; De Kock, A.; De Picciotto, L.; Thackeray, M.; David, W.; Ibberson, R. Structural aspects of lithium-manganese-oxide electrodes for rechargeable lithium batteries. Mater. Res. Bull. 1990, 25, 173−182.
(8) Gao, Y.; Dahn, J. Synthesis and Characterization of Li1+xMn2−xO4
for Li-Ion Battery Applications. J. Electrochem. Soc. 1996, 143, 100− 114.
(9) Xia, Y.; Yoshio, M. Optimization of Spinel Li1+xMn2−yO4as a 4 V
Li-Cell Cathode in Terms of a Li−Mn−O Phase Diagram. J. Electrochem. Soc. 1997, 144, 4186−4194.
(10) Gummow, R.; De Kock, A.; Thackeray, M. Improved capacity retention in rechargeable 4 V lithium/lithium-manganese oxide (spinel) cells. Solid State Ionics 1994, 69, 59−67.
(11) Zhong, Q.; Bonakdarpour, A.; Zhang, M.; Gao, Y.; Dahn, J. Synthesis and Electrochemistry of LiNixMn2−xO4. J. Electrochem. Soc.
1997, 144, 205−213.
(12) Song, J.; Shin, D. W.; Lu, Y.; Amos, C. D.; Manthiram, A.; Goodenough, J. B. Role of Oxygen Vacancies on the Performance of Li[Ni0.5−xMn1.5+x]O4 (x = 0, 0.05, and 0.08) Spinel Cathodes for
Lithium-Ion Batteries. Chem. Mater. 2012, 24, 3101−3109.
(13) Wang, S.; Yang, J.; Wu, X.; Li, Y.; Gong, Z.; Wen, W.; Lin, M.; Yang, J.; Yang, Y. Toward high capacity and stable manganese-spinel electrode materials: A case study of Ti-substituted system. J. Power Sources 2014, 245, 570−578.
(14) Duncan, H.; Hai, B.; Leskes, M.; Grey, C. P.; Chen, G. Relationships between Mn3+ Content, Structural Ordering, Phase
Transformation, and Kinetic Properties in LiNixMn2−xO4 Cathode
Materials. Chem. Mater. 2014, 26, 5374−5382.
(15) Krins, N.; Hatert, F.; Traina, K.; Dusoulier, L.; Molenberg, I.; Fagnard, J.-F.; Vanderbemden, P.; Rulmont, A.; Cloots, R.; Vertruyen, B. LiMn2−xTixO4spinel-type compounds (x≤ 1): Structural, electrical
and magnetic properties. Solid State Ionics 2006, 177, 1033−1040. (16) Petrov, K.; Rojas, R. M.; Alonso, P. J.; Amarilla, J. M.; Lazarraga, M. G.; Rojo, J. M. Cation distribution and phase transformations in LiMn2−yTiyO4(0.2≤ y ≤ 1.5) solid solutions. Solid State Sci. 2005, 7,
277−286.
(17) Murphy, D. T.; Schmid, S.; Hester, J. R.; Blanchard, P. E.; Miiller, W. Coordination Site Disorder in Spinel-Type LiMnTiO4.
Inorg. Chem. 2015, 54, 4636−4643.
(18) Lee, Y. J.; Wang, F.; Grey, C. P. 6Li and7Li MAS NMR studies
of lithium manganate cathode materials. J. Am. Chem. Soc. 1998, 120, 12601−12613.
(19) Grey, C. P.; Lee, Y. J. Lithium MAS NMR studies of cathode materials for lithium-ion batteries. Solid State Sci. 2003, 5, 883−894.
(20) Lee, Y. J.; Park, S.-H.; Eng, C.; Parise, J. B.; Grey, C. P. Cation Ordering and Electrochemical Properties of the Cathode Materials LiZnxMn2−xO4, 0 < x ≤ 0.5: A 6Li Magic-Angle Spinning NMR
Spectroscopy and Diffraction Study. Chem. Mater. 2002, 14, 194−205. (21) Lee, Y. J.; Grey, C. P. Determining the lithium local environments in the lithium manganates LiZn0.5Mn1.5O4 and
Li2MnO3 by analysis of the 6Li MAS NMR spinning sideband
manifolds. J. Phys. Chem. B 2002, 106, 3576−3582.
(22) Lee, Y. J.; Eng, C.; Grey, C. P. 6Li Magic Angle Spinning NMR Study of the Cathode Material LiNixMn2−xO4: The Effect of Ni
Doping on the Local Structure during Charging. J. Electrochem. Soc. 2001, 148, A249−A257.
(23) Lee, Y. J.; Grey, C. P. 6Li Magic Angle Spinning Nuclear
Magnetic Resonance Study of the Cathode Materials Li1+αMn2−αO4−δ
The Effect of Local Structure on the Electrochemical Properties. J. Electrochem. Soc. 2002, 149, A103−A114.
(24) Zhou, L.; Leskes, M.; Ilott, A. J.; Trease, N. M.; Grey, C. P. Paramagnetic electrodes and bulk magnetic susceptibility effects in the in situ NMR studies of batteries: Application to Li1.08Mn1.92O4spinels.
J. Magn. Reson. 2013, 234, 44−57.
(25) McConnell, H. M.; Chesnut, D. B. Theory of Isotropic Hyperfine Interactions inπ-Electron Radicals. J. Chem. Phys. 1958, 28, 107−117.
(26) McConnell, H. M.; Robertson, R. E. Isotropic nuclear resonance shifts. J. Chem. Phys. 1958, 29, 1361−1365.
(27) Kurland, R. J.; McGarvey, B. R. Isotropic NMR shifts in transition metal complexes: the calculation of the Fermi contact and pseudocontact terms. J. Magn. Reson. 1970, 2, 286−301.
(28) Grey, C. P.; Dupré, N. NMR Studies of Cathode Materials for Lithium-Ion Rechargeable Batteries. Chem. Rev. 2004, 104, 4493− 4512.
(29) Middlemiss, D. S.; Ilott, A. J.; Clément, R. J.; Strobridge, F. C.; Grey, C. P. Density functional theory-based bond pathway decompositions of hyperfine shifts: Equipping solid-state NMR to characterize atomic environments in paramagnetic materials. Chem. Mater. 2013, 25, 1723−1734.
(30) Clément, R. J.; Pell, A. J.; Middlemiss, D. S.; Strobridge, F. C.; Miller, J. K.; Whittingham, M. S.; Emsley, L.; Grey, C. P.; Pintacuda, G. Spin-transfer pathways in paramagnetic lithium transition-metal phosphates from combined broadband isotropic solid-state MAS NMR spectroscopy and DFT calculations. J. Am. Chem. Soc. 2012, 134, 17178−17185.
(31) Pell, A. J.; Pintacuda, G. Broadband solid-state MAS NMR of paramagnetic systems. Prog. Nucl. Magn. Reson. Spectrosc. 2015, 84, 33−72.
(32) Clément, R. J.; Middlemiss, D. S.; Seymour, I. D.; Ilott, A. J.; Grey, C. P. Insights into the Nature and Evolution upon Electro-chemical Cycling of Planar Defects in theβ-NaMnO2Na-Ion Battery
Cathode: An NMR and First-Principles Density Functional Theory Approach. Chem. Mater. 2016, 28, 8228−8239.
(33) Lee, J.; Seymour, I. D.; Pell, A. J.; Dutton, S. E.; Grey, C. P. A systematic study of 25Mg NMR in paramagnetic transition metal
oxides: applications to Mg-ion battery materials. Phys. Chem. Chem. Phys. 2017, 19, 613−625.
(34) Kervern, G.; Pintacuda, G.; Emsley, L. Fast adiabatic pulses for solid-state NMR of paramagnetic systems. Chem. Phys. Lett. 2007, 435, 157−162.
(35) Hwang, T.-L.; Van Zijl, P. C.; Garwood, M. Fast broadband inversion by adiabatic pulses. J. Magn. Reson. 1998, 133, 200−203.
(36) Massiot, D.; Fayon, F.; Capron, M.; King, I.; le Calvé, S.; Alonso, B.; Durand, J.-O.; Bujoli, B.; Gan, Z.; Hoatson, G. Modelling one-and two-dimensional solid-state NMR spectra. Magn. Reson. Chem. 2002, 40, 70−76.
(37) Grau-Crespo, R.; Hamad, S.; Catlow, C.; De Leeuw, N. Symmetry-adapted configurational modelling of fractional site occupancy in solids. J. Phys.: Condens. Matter 2007, 19, 256201.
(38) Van der Ven, A.; Thomas, J. C.; Xu, Q.; Swoboda, B.; Morgan, D. Nondilute diffusion from first principles: Li diffusion in LixTiS2.
Phys. Rev. B: Condens. Matter Mater. Phys. 2008, 78, 104306. (39) Van der Ven, A.; Thomas, J.; Xu, Q.; Bhattacharya, J. Linking the electronic structure of solids to their thermodynamic and kinetic properties. Mathematics and Computers in Simulation 2010, 80, 1393− 1410.
(40) Perdew, J. P.; Burke, K.; Ernzerhof, M. Generalized gradient approximation made simple. Phys. Rev. Lett. 1996, 77, 3865.
(41) Kresse, G.; Furthmüller, J. Efficient iterative schemes for ab initio total-energy calculations using a plane-wave basis set. Phys. Rev. B: Condens. Matter Mater. Phys. 1996, 54, 11169.
(42) Blöchl, P. E. Projector augmented-wave method. Phys. Rev. B: Condens. Matter Mater. Phys. 1994, 50, 17953.
(43) Anisimov, V. I.; Zaanen, J.; Andersen, O. K. Band theory and Mott insulators: Hubbard U instead of Stoner I. Phys. Rev. B: Condens. Matter Mater. Phys. 1991, 44, 943.