Discongruence of Mhc and cytochrome b
phylogeographical patterns in Myodes glareolus
(Rodentia: Cricetidae)
PIERRE-JEAN G. MALÉ
1,2,3, JEAN-FRANÇOIS MARTIN
1, MAXIME GALAN
1,
VALÉRIE DEFFONTAINE
1,4,5, JOSEF BRYJA
6, JEAN-FRANÇOIS COSSON
1,
JOHAN MICHAUX
1and NATHALIE CHARBONNEL
1*
1INRA, UMR CBGP (INRA/IRD/Cirad/Montpellier SupAgro), Campus international de Baillarguet, CS 30016, F-34988 Montferrier-sur-Lez Cedex, France
2Université de Toulouse, UPS, EDB (Laboratoire Evolution et Diversité Biologique), 118 route de Narbonne, F-31062 Toulouse, France
3CNRS; EDB (Laboratoire Evolution et Diversité Biologique), F31062 Toulouse, France
4Unité de recherches zoogéographiques, University of Liège, Bât. B22, Boulevard du Rectorat, Sart Tilman, 4000 Liège, Belgium
5University of Liège, GIGA-R, Unit of Animal Genomics, B34, Avenue de l’Hopîtal, 4000 Liège, Belgium
6Institute of Vertebrate Biology, Academy of Sciences of the Czech Republic, Kveˇtná 8, 603 65 Brno, Czech Republic
Received 13 May 2011; revised 31 August 2011; accepted for publication 31 August 2011bij_1799881..899
In the present study, a phylogeographical approach was developed to analyse the influence of selection and history on a major histocompatibility complex (Mhc) class II gene polymorphism in European bank vole (Myodes glareolus) populations. We focused on exon 2 of the Dqa gene because it is highly variable in a large array of species and appears to evolve under pathogen-mediated selection in several rodent species. Using single-strand conformation polymorphism analysis and sequencing techniques, 17 Dqa-exon2 alleles, belonging to at least two different copies of Dqa gene, were detected over the distribution range of M. glareolus. Evidence of selection was found using molecular and population analyses. At the molecular level, we detected 13 codons evolving under positive selection pressures, most of them corresponding to regions coding for putative antigen binding sites of the protein. At the European level, we compared patterns of population structure for the Dqa-exon2 and cytochrome b (cyt b) gene. We did not detect any spatial genetic structure among M. glareolus populations for the Dqa-exon2. These results strongly differed from those obtained using the cyt b gene, which indicated a recent phylogeographical history closely linked to the last glacial events. Seven mitochondrial lineages have yet been described, which correspond to major glacial refugia. Altogether, our results revealed clear evidence of balancing selection acting on Dqa-exon2 and maintaining polymorphism over large geographical areas despite M. glareolus history. It is thus likely that
Mhc phylogeographical variability could have been shaped by local adaptation to pathogens. © 2012 The Linnean Society of London, Biological Journal of the Linnean Society, 2012, 105, 881–899.
ADDITIONAL KEYWORDS: balancing selection – bank voles – diversity – immunogenetics – molecular
epidemiology – Puumala hantavirus – zoonoses.
INTRODUCTION
Medical and veterinary researches have established the influence of host immunogenetics on resistance
against diseases, for human infections such as malaria, AIDS, and hepatitis (Cooke & Hill, 2001; Hill, 2001) or for models of veterinary importance (Paterson, Wilson & Pemberton, 1998; Keeler et al., 2007). This last decade, major histocompatibility complex (Mhc) genes have been at the core of *Corresponding author.
evolutionary studies to investigate relationships between immunogenetics and resistance to pathogens in non-model organisms and natural populations (Bernatchez & Landry, 2003; Sommer, 2005; Piertney & Oliver, 2006; Spurgin & Richardson, 2010). Exami-nation of Mhc genetic diversity has revealed that the considerable polymorphism observed is, at least partly, shaped by a trade-off between selection pres-sures exerted by pathogens and both T cell repertoire diversity and autoimmune disease risks. First, posi-tive selection has been demonstrated to act on Mhc genes at different evolutionary scales and pathogens have been recognized as the major agents mediat-ing this selection (Potts & Wakeland, 1990; Gouy de Bellocq, Charbonnel & Morand, 2008; Tollenaere
et al., 2008). Second, immunological research suggests
that the number of Mhc variants is constrained by a pleiotropic trade-off between the number of different antigens presented by MHC and the number recog-nized by T cells. Indeed, because of negative thymic selection, individuals with many MHC molecules are expected to have smaller T cell repertoires (Celada & Seiden, 1992; Nowak, Tarczyhornoch & Austyn, 1992; de Boer & Perelson, 1993; Woelfing et al., 2009). This pattern has been validated in natural populations where an optimum number of Mhc variants per indi-vidual can be detected (e.g. in sticklebacks: Wegner, Reusch & Kalbe, 2003; Kloch et al., 2010).
Besides, neutral historical forces also participate in shaping immune gene polymorphism. For example, Prugnolle et al. (2005) have shown that both human colonization history and virus-mediated selection explain the worldwide present diversity patterns observed at human Mhc genes [i.e. human leukocyte antigen (Hla) genes]. Comparing phylogeographical structures resulting from selective and neutral evo-lutionary forces is essential for investigating spa-tial patterns of adaptive genetic diversity. As such, its application to immune genes must be relevant to immunogenetics. It may highlight the factors underlying the current distribution of immune gene polymorphism at large geographical scales, within populations and across geographical landscapes (Quintana-Murci et al., 2007). These approaches may bring essential results for the understanding and prediction of the distribution of pathogens. Therefore, they have been developed in the context of emerging diseases, first on humans (Tishkoff et al., 2001; Gibert & Sanchez-Mazas, 2003; Barreiro, Patin & Neyrolles, 2005; Prugnolle et al., 2005; Sabeti et al., 2005) and veterinary models (Paterson et al., 1998). In wild ver-tebrate animals, only five studies have investigated immune gene variability at a large geographical scale and in a phylogeographical perspective. Two of them revealed that Mhc genes showed clear marks of the phylogeographical history of the species studied
(Berggren et al., 2005; Miller, Allendorf & Daugherty, 2010). Three others demonstrated the relative impor-tance of selection acting on Mhc genes with regard to drift (Langefors, 2005; Koutsogiannouli et al., 2009), probably mediated by variations of parasite commu-nities (Alcaide et al., 2008). None of these studies have been applied in the context of zoonoses, although they represent an increasing and substantial threat to global health and conservation nowadays.
The bank vole Myodes (formerly Clethrionomys)
glareolus (Rodentia, Cricetidae, Arvicolinae; Schreber,
1780) is the main European specific reservoir of Puumala virus (PUUV), a hantavirus responsible of hemorrhagic fever with renal syndrome in humans (Lundkvist & Niklasson, 1992). It is a rodent of the Western Palearctic region (Le Louarn, Quéré & Butet, 2003). Its distribution ranges from the British Isles and northern Spain in the West, to Siberia in the East (Le Louarn et al., 2003). As shown in previous studies, the major European phylogroups of bank voles differ-entiated during the late Pleistocene (0.25–0.30 Mya) and thus preceded the last glacial cycle (Deffontaine
et al., 2005, 2009). The Mediterranean peninsulas and
the Basque country played a role as glacial refugia for this rodent but did not contribute to the postglacial recolonization, in contrast to central and eastern Europe phylogroups that made a major contribution to the modern population of this species in Europe (Kotlik
et al., 2006). We proposed to compare the
phylogeo-graphical pattern of immune and mitochondrial genes in M. glareolus European populations. Incongruent results could at least partly be explained by the relative importance of selection compared to historical processes of refugia/recolonization in shaping immune gene polymorphism. Under the hypothesis of local adaptation, a higher differentiation for Mhc than for the mitochondrial gene was expected, whereas, under balancing selection, the opposite pattern of a lower genetic differentiation for Mhc than for the mitochon-drial gene was predicted (Spurgin & Richardson, 2010).
We focused on a specific part of the Mhc class II [i.e. exon 2 of the Dqa gene (Dqa-exon2)] because we previously found evidence of positive selection acting on this gene in M. glareolus, potentially mediated by pathogens. In particular, Bryja et al. (2006) revealed
trans-species polymorphism at this gene in
Arvicoli-nae, mainly driven by historical balancing selection. Deter et al. (2008) reported associations between parasitological data and some of the nine Dqa-exon2 alleles described in bank voles (Dqa-04,
Clgl-Dqa-09, Clgl-Dqa-12).
We first characterized the mechanisms of Dqa-exon2 molecular evolution. Although they had previously been described at the historical scale of the family Murinae (Bryja et al., 2006), it was important
to assess whether such mechanisms were similar when focusing on the spatiotemporal scale of
M. glareolus history. Such investigation was an
essen-tial prerequisite to allow further analyses of the geo-graphical patterns of sequence variation in terms of microevolutionary processes (Avise, 2000; Walsh & Friesen, 2003). We then compared mitochondrial and
Dqa-exon2 phylogeographical patterns in terms of
genetic differentiation. From previously published analyses, we considered that cytochrome b (cyt b) results provided the patterns of phylogeographical differentiation expected under the null hypothesis of neutrality (Deffontaine et al., 2005). We therefore compared the results obtained at the Dqa-exon2 with these neutral patterns. Congruent patterns would indicate that phylogeographical history was the pre-dominant force shaping the genetic spatial differen-tiation at Dqa-exon2 gene. Alternatively, incongruent patterns between the mitochondrial and the Dqa-exon2 genes would indicate that evolutionary pro-cesses acting on these genes were different. We discuss our results in the context of pathogen-mediated selection acting on Dqa-exon2 gene in
M. glareolus populations.
MATERIAL AND METHODS
STUDIED SPECIES AND SAMPLING
We analyzed 318 bank voles from 34 localities from the occidental part of the bank vole distribution range (i.e. from the Atlantic coast to Western Russia) (Table 1, Fig. 1). These samples were mainly obtained from collaborators. We checked that samples from one site were trapped during a short period of time (less than one year) and were provided by the same collaborator. For each bank vole, the end of the tail, one finger or a piece of ear was fixed in 95% ethanol as the material for DNA extraction. We added 49 voles from the French Jura mountains (Mignovillard, locality no. 20; Table 1) that were previously genotyped at the Dqa-exon 2 (Deter et al., 2008) and for which the spleen was available in RNAlater (Ambion) for RNA analyses.
GENOTYPING, CLONING,AND SEQUENCING
Genomic DNA extracts were initially obtained using Puregene DNA Purification Kit (Gentra Systems) in accordance with the manufacturer’s instructions. We further used the DNeasy Tissue Kit (Qiagen) to obtain better quality extracts. We followed the manu-facturer’s instructions and finally eluted the columns twice in 100mL of 65 °C heated AE buffer.
Amplifications of 1048 bp of cyt b were carried out in 25mL containing approximately 30 ng of DNA extract, 100mM of each dNTP, 1 mM of each primer (forward: L14723-ACCAATGACATGAAAAATCATCG
TT; reverse: H15915-TCTCCATTTCTGGTTTACAAG AC) developed by Lecompte et al. (2002), 0.8 unit of Taq polymerase (Qiagen) and 1¥ buffer containing 1.5 mM of MgCl2. Cycling conditions were: one initial
denaturation step at 94 °C for 4 min followed by 40 cycles of denaturation at 94 °C for 30 s, annealing at 50 °C for 30 s, elongation at 72 °C for 90 s, and a final extension at 72 °C for 10 min. Polymerase chain reac-tion (PCR) products were sequenced by a service provided by Macrogen.
Genotyping of the complete exon 2 of the Mhc class II gene Dqa (Dqa-exon2) was performed using single-strand conformation polymorphism (SSCP) analysis. Amplifications were carried out following the protocol described as PCR1 in Bryja et al. (2006) but using fluorescently-labelled primers (forward by 6′-FAM and reverse by HEX) and 35 cycles of denaturation/ annealing/extension. SSCP analyses of PCR products were then performed by capillary electrophoresis (CE) on a MegaBACE 1000 DNA Analysis System (Amersham Biosciences) following Bryja et al. (2005). The electropherograms were aligned and analyzed with the software GENETIC PROFILER, version 1.5 (Amersham Biosciences).
Next, we selected individuals representing all previously identified SSCP patterns to investigate sequence variation using the cloning and sequencing of genomic DNA (gDNAs) sensu Bryja et al. (2006). Briefly, we selected 38 bank voles so that each identi-fied CE-SSCP profile was represented and carried by at least three individuals. As far as possible, we chose individuals coming from different localities. The Dqa gene was amplified as described above but using nonlabelled primers and the AmpliTaq Gold DNA Polymerase (Applied Biosystems) to reduce the error rate of substitutions into the clonal sequences. The PCR products were purified by the QIAquick PCR Purification Kit (Qiagen), ligated to vectors using pGEM-T Easy Vector System (Promega) and trans-formed into JM109 Competent Cells (Promega). For each selected individual, the clones containing an insert were isolated and this insert was amplified and genotyped by CE-SSCP as described above. For het-erozygous individuals, from two to eight clones were used to obtain the sequences of the two or three expected alleles revealed by SSCP pattern of an indi-vidual. Each clone and PCR product were boiled and purified by ExoSAP-IT (USB) in accordance with the manufacturer’s instructions, then amplified by PCR using nonlabelled primers SP6 and T7. The insert was sequenced using the conditions: 4mL of Amersham sequencing premix, 0.8mM of nonlabelled SP6 primer and 10 ng of purified DNA. Deionized water was added to a 10-mL reaction volume. Sequencing reactions were carried out during 25 cycles of denaturation at 94 °C (20 s), annealing at 50 °C (20 s), and extension at 60 °C
T able 1. Map references, phylogeographical grouping, geographical locations, the number of Myodes glareolus individuals used in the genetic analyses and Dqa -exon2 and Cyt b haplotypes observed in these locations Code Grouping Geographical origin T otal number of animals Haplotypes Lit. SAMOV A Dqa -exon2 Cytochrome b(cyt b ) Dqa -exon2 Cyt b (GenBank Accession numbers) 1 W est W est-b Austria Ginzling 7 3 Clgl-Dqa *04, 08, 19, 25 HQ288328 to 330 2 W est W est Pfunds 3 1 Clgl-Dqa *08, 09, 14, 24 HQ288331 3 W est W est Belgium Beaumont 20 3 Clgl-Dqa *05, 08, 12, 16, 19, 24 HQ288332 to 334 4 Balk Balk Bulgaria Balkan Mountains 4 4 Clgl-Dqa *08, 12, 18, 19 HQ288335 to 338 5 Balk Balk Rhodopi Mountains 2 2 Clgl-Dqa *08 HQ288339-340 6 Balk Balk Rila Mountains 2 2 Clgl-Dqa *08, 19, 35 AJ639699-700 7 Balk Balk V itosha Mountains 1 1 Clgl-Dqa *08, 25 AJ639703 8 W est W est Croatia Grac ˇa c 6 6 Clgl-Dqa *08, 12, 18, 19 HQ288341 to 346 9 W est W est Czech Republic Beskydy Mountains 1 1 3 Clgl-Dqa *08, 12, 16, 19, 20, 21, 24, 35 HQ288347 to 349 10 W est W est Southern Moravia 7 3 Clgl-Dqa *04, 08, 19, 21, 35 HQ288350 to 352 1 1 East East-a Denmark Århus 7 5 Clgl-Dqa *08, 14, 18, 19 HQ288353 to 357 12 East East-a Fyn Island 10 5 Clgl-Dqa *04, 08, 12, 14, 25 HQ288358 to 362 13 East East-b Finland Ilmajoki 48 3 Clgl-Dqa *04, 08, 1 1 , 12, 14, 16, 18, 19, 21, 24, 25, 35 HQ288368-369 14 Ural Ural Kittila 1 1 Clgl-Dqa *08 HQ288370 15 East East-b Konnevesi 39 2 Clgl-Dqa *04, 08, 09, 12, 14, 16, 18, 19, 21, 35 HQ288371-372 16 W est W est France Ardennes 36 3 Clgl-Dqa *08, 09, 12, 14, 16, 18, 19, 21, 25 HQ288373 to 375 17 Basq Basq Armendarits 10 6 Clgl-Dqa *08, 09, 14, 19 HQ288373 to 378 18 W est W est Cadouin 1 1 Clgl-Dqa *19 HQ288379 19 W est W est Férel 3 3 Clgl-Dqa *08, 1 1 , 16, 19 HQ288380 to 382 20 W est W est Mignovillard 49 1 Clgl-Dqa *04, 05, 08, 09, 1 1 , 12, 14 JN547382 21 Basq Basq Néouvielle 6 6 Clgl-Dqa *08, 1 1 , 19, 22 HQ288383 to 388 22 Basq Basq Ponson-Debat 4 3 Clgl-Dqa *08, 12, 19 HQ288389-391 23 Span Span Py/Mantet 6 1 Clgl-Dqa *08, 09, 1 1 , 14, 19, 25 HQ288392 24 W est W est T ourch 4 4 Clgl-Dqa *08, 18, 19 HQ288393 to 396 25 East East-a Germany Parchim 4 4 Clgl-Dqa *08, 1 1 , 16, 19, 25 AJ867974 to 977 26 W est W est Italy T rentino 18 3 Clgl-Dqa *08, 09, 1 1 , 14, 16, 19, 24 HQ288397 to 399 27 East East-b Lithuania Alytus 3 3 Clgl-Dqa *08, 19 HQ288400-401 28 Balk Balk Macedonia Pelister Mountain 2 4 Clgl-Dqa *09, 19 AJ639660-68-70, HQ288402 29 Ural Ural Norway Narvik 2 2 Clgl-Dqa *19 HQ288403-404 30 East East-b Poland Lublin 1 1 Clgl-Dqa *08, 09, 14 HQ288405 31 Ural Ural Russia Kolodozero 5 6 Clgl-Dqa *09, 16, 18, 19, 35 HQ288406 to 41 1 32 W est W est Slovakia Košice 10 4 Clgl-Dqa *05, 08, 12, 14, 18, 19, 20, 24 AJ867948-949-959–964 33 Ural Ural Sweden Våsterbotten 19 3 Clgl-Dqa *08, 09, 14, 16, 19, 24, 25 HQ288412 to 414 34 W est W est Switzerland Gros-de-V aud 7 4 Clgl-Dqa *05, 08, 18, 19, 24, 25 HQ288415 to 418 35 W est W est United Kingdom Kielder 9 2 Clgl-Dqa *08, 09, 14, 16, 18, 19 HQ288366-367 Grouping is indicated according to literature (‘Lit.’; Def fontaine et al. , 2005, 2009; Kotlik et al. , 2006) and to spatial analysis of molecular variance (‘SAMOV A ’) performed in this study . W est, Balk, East, Ural, Basq, and Span, respectively , correspond do the W estern, Eastern, Ural, Basque, and Spanish mitochondrial lineages defined b y Def fontaine et al . (2005).
(2 min). Sequences were obtained on MegaBACE 1000 DNA Analysis System (Amersham Biosciences).
ASSESSMENT OF DQA SEQUENCE TRANSCRIPTION
Only French samples from Mignovillard (locality no. 20; Table 1) could be used for the assessment of Dqa sequence transcription because no spleen sample was available from the other localities. We selected 11 bank voles so that each Dqa-exon2 CE-SSCP profile was carried by at least three individuals. Total RNA was extracted from spleens using TRIzol/chloroform extraction. RNA was then precipitated by isopropanol, washed by 75% ethanol, and resuspended in 20mL
RNase-free water. We used 1mL of extracted RNA for reverse transcription by M-MLV reverse transcriptase (Invitrogen) in accordance with the manufacturer’s instructions. Total complementary DNA (cDNA) was diluted 1/5 to conduct specific PCR amplification with primers F and At-cDNA-Dqaex2-395-R (Bryja et al., 2006). The primer sequences are respectively located within exon 1 and exon 3, thus avoiding possible amplification of contaminating genomic DNA because the intronic sequences are quite long in rats (2678 bp between exons 1 and 2 and 426 bp between exons 2 and 3). PCR amplification was per-formed in a 50-mL volume using the conditions: 0.1 mM of each primer, 1¥ PCR buffer, 4 mM MgCl2, 0.1 mM
70°
A cyt b
29 14 5° 13 31 33 15 0° 65 35 12 11 55° 60 35 25 16 10 24 32 30 27 9 1 3 50° 5 18 21 26 23 19 17 22 34 8 7 6 28 5 4 1 2 0° 45° 20 -15°35° 0° 15° 30° 45° 40Figure 1. Maps of the Myodes glareolus samples genotyped for (A) cytochrome b (cyt b) and (B) Dqa-exon2. Each
sampling locality is indicated using the number corresponding to the reference given in Table 1. The clusters resulting from spatial analysis of molecular variance are represented using symbols associated with localities. Localities repre-sented by the same symbol belong to genetically homogeneous clusters.
dNTPs and 0.5 U of Taq polymerase (Qiagen). The thermal profile started with initial denaturation at 94 °C (2 min), followed by 35 cycles of denaturation at 94 °C (45 s), annealing at 56 °C (45 s) and extension at 72 °C (1 min), and a final extension at 72 °C for 10 min. The PCR products were then cloned and sequenced as described above. For heterozygous indi-viduals, from two to eleven clones were used to obtain the sequences of the two or three expected alleles revealed by the SSCP pattern of an individual.
DQA SEQUENCE VALIDATION AND CE-SSCP
HOMOPLASY SOLVING
Bryja et al. (2005) reported that 24.6% of the vole
Dqa sequences obtained using this protocol could be
artefacts of PCR amplification. As a result, we applied the criteria of Kennedy et al. (2002) stating that a DNA sequence can be considered as a new allele only when it is carried by at least three clones coming either from two different PCR amplifications of the same individual or from different individuals. However, this criterion can not be applied to cDNA sequences because it would have required several RNA extractions and the sequencing of many clones. Indeed, the in vivo transcription and especially in
vitro reverse-transcription strongly increase the probability of obtaining polymerization artefacts. Therefore, cDNA sequences were confirmed when they were no more than one base differing to a genomic DNA sequence that met the criteria of Kennedy et al. (2002).
B
Dqa-exon2
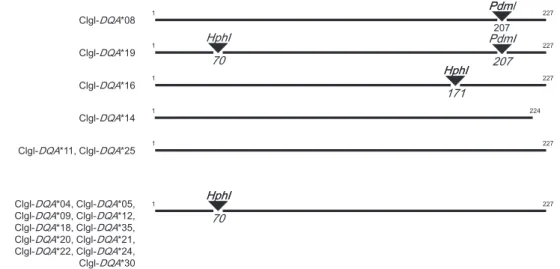
70° 29 14 5 ° 13 31 33 15 0 °6 5 35 12 11 5 5° 6 0 35 25 16 10 24 32 30 27 9 1 3 50° 5 18 21 26 23 19 17 22 34 8 7 6 28 5 4 1 2 0 °4 5 ° 20 35° 4 0 -15° 0° 15° 30° 45° Figure 1. ContinuedTwo alleles (Clgl-Dqa*08 and Clgl-Dqa*19) differed only in 1 bp and exhibited undistinguishable CE-SSCP patterns. We thus developed a restriction fragment length polymorphism (RFLP) test based on
HphI and PdmI enzymatic restrictions to
discrimi-nate these alleles, even in the presence of other alleles (Fig. 2). The precise genotype of all individuals showing the Clgl-Dqa*08/Clgl-Dqa*19 CE-SSCP pattern were analyzed by this RFLP test: Dqa-exon2 was amplified using the conditions: 0.1mM of each unlabelled primer, 7.5mL of Qiagen Multiplex PCR Master Mix and 1.5mL of extracted DNA. Deionized water was added to a 15-mL reaction volume. The thermal profile started with an initial denaturation and activation at 95 °C (15 min) followed by 40 cycles of denaturation at 95 °C (30 s), annealing at 57 °C (1 min 30) and extension at 72 °C (1 min), and a final extension at 60 °C for 30 min. Amplified Dqa-exon2 were then submitted to enzymatic digestion using the conditions: 0.8 U of HphI, 0.4 U of PdmI, 1X Buffer-Tango (Fermentas) and 10mL of amplified DNA. Deionized water was added to a 20mL reaction volume. The reaction mixture was then incubated at 37 °C for 16 h. Digestion products were finally loaded on 3% agarose electrophoresis gel containing ethidium bromide and visualized under ultraviolet light. The patterns expected for Clgl-Dqa*08 and Clgl-Dqa*19 are shown in Figure 2.
MOLECULAR EVOLUTIONARY ANALYSIS
The sequences were edited in MegaBACE Sequence Analyzer 3.0 (Amersham Biosciences) and aligned in BIOEDIT SEQUENCE ALIGNMENT EDITOR, version 7.0.5.2 (Hall, 1999) using CLUSTALX, version
1.83. We then performed molecular evolutionary analyses to search for allele clusters, which could correspond to the two Dqa copies previously highlighted by Bryja et al. (2006). Phylogenetic recon-structions were thus performed using the split-decomposition network method implemented in SPLITSTREE, version 4.10 (Huson & Bryant, 2006) based on 10 000 bootstrap iterations. We used MODELTEST, version 3.7 (Posada & Crandall, 1998; Posada, 2002) to determine the most suitable model of DNA substitution for the Dqa-exon2. Both PAUP and MODELTEST were used through PAUPUP, 1.0.3.1b graphical interface (Calendini & Martin, 2005).
The software MEGA, version 3.1 (Kumar, Tamura & Nei, 2004) was used to calculate the number of variable and/or parsimonious informative sites for both nucleic and amino acid sequences. Two comple-mentary approaches were used to analyze the evolu-tionary history of the Dqa-exon2 gene. First, we used the software PLATO, version 2.0 (Grassly & Holmes, 1997) to detect regions of alignments that do not fit the (null) phylogenetic hypothesis estimated a priori using the maximum-parsimony criterion (Fitch, 1971) implemented in PAUP, version 4.0b10 (Swofford, 2000). Briefly, this software utilizes a sliding window (here 2–100 bp) to calculate the likelihood of this null hypothesis for each site along the alignment and its associated model of evolution (as defined using MODELTEST; see above). Phylogenetically anoma-lous regions may arise either as a result of selection or of conversion/recombination. For each site with a low likelihood value, the algorithm derives a Z-statistic from Monte-Carlo simulation to evaluate the departure from this null hypothesis. Significant
Z-values reveal regions of the alignment that evolved Pdm 1 227 1 HphI 227 70 HphI Pdml 207 PdmI 207 Clgl-DQA*08 Clgl-DQA*19 1 227 1 224 HphI 171 Clgl-DQA*16 Clgl-DQA*14 1 227 HphI Clgl-DQA*11, Clgl-DQA*25 1 HphI 227 70 Clgl-DQA*04, Clgl-DQA*05, Clgl-DQA*09, Clgl-DQA*12, Clgl-DQA*18, Clgl-DQA*35, Clgl-DQA*20, Clgl-DQA*21, Clgl-DQA*22, Clgl-DQA*24, Clgl-DQA*30
Figure 2. HphI and PdmI restriction map of the 17 Dqa-exon2 alleles of Myodes glareolus. The restriction fragment
length polymorphism test based on the restriction activity of this enzymes allows discrimination between Clgl-Dqa*08 and Clgl-Dqa*19, even in the presence of other alleles.
following different substitution patterns than the rest of the sequence, thus indicating probable recombina-tion. Besides, recombination was specifically assessed using the pairwise homoplasy index (PHI) test devel-oped by Bruen, Philippe & Bryant (2006) and imple-mented in SPLITSTREE, version 4.10 (Huson & Bryant, 2006). A 100-bp window was chosen to esti-mate compatibility among sites and significance was determined with a permutation test assuming no recombination. Second, analyses of selection were performed using likelihood ratio modeling using CODEML, which is contained in the PAML, version 3.14 software suite (Yang, 1997). This method allows for variable selection intensities, measured byw (ratio of nonsynonymous to synonymous substitution rate, or dN/dS), among sites within protein-coding DNA
sequences. Data were analyzed under models M0 (one-ratio model), M1a (neutral model), M2a (selec-tion), M7 (beta distribu(selec-tion), and M8 (beta distribu-tion and selecdistribu-tion). M7 allows sites to have different values of w, calculated from the beta distribution, which ranges between 0 and 1. It therefore consti-tutes a null model for testing positive selection. M8 (beta distribution+ selection) is similar to M7 but with an additionalw category that can exceed 1. The likelihood ratio test (LRT) statistics for comparing two nested models were calculated as: LRT= 2 [ln(Lj)
– ln(Li)], and compared with a chi-squared
distribu-tion with Pj – Pidegrees of freedom, where Liand Lj
are likelihood values and Piand Pjare the numbers of
parameters of models i and j. We compared M1a with M2a and M7 with M8. If the alternative models M2a and M8, respectively, fitted the data better than M1a and M7, then some sites would be considered as being under positive selection (Yang, 1997).
Anisimova, Bielawski & Yang (2001, 2002) demon-strated, using computer simulations, that these methods of detecting adaptive evolution were conser-vative and might miss power when the data contain only a few sequences. We therefore compared these results with those obtained using a second approach developed in HYPHY software (Kosakovsky Pond, Frost & Muse, 2005) using the Datamonkey web server (http://www.datamonkey.org/). We applied the single likelihood ancestral counting (SLAC) and fixed effects likelihood (FEL) tests, which are also described as conservative, as well as the random effects likelihood (REL) test, which has higher power but may suffer from higher rates of false positives for small datasets (Kosakovsky Pond & Frost, 2005). We followed the recommendations by setting high a-levels of 0.25 for the SLAC and FEL methods, and a Bayes factor cut-off of 50 for the REL method. We considered that a codon was evolving under selection when it was identified by at least two or three methods (Kosakovsky Pond & Frost, 2005).
Codons identified as evolving under positive selec-tion using the methods implemented in PAML and HYPHY software were finally compared with amino acid positions involved in antigen binding sites (ABS). These amino acids were those previously identified by Bryja et al. (2006) on the basis of the X-ray crystal-lography study of the murine class II histocompatibil-ity molecule I-Ak (Fremont et al., 1998), I-Ad (Scott et al., 1998), and I-Ag7 (Latek, Petzold & Unanue,
2000). We also included residue 31 because it was found to evolve under positive selection in rodent species analyzed by Bryja et al. (2006) and Pfau et al. (1999). We therefore considered as ABS the amino acids 11, 22, 24, 31, 32, 52, 53, 54, 55, 58, 61, 62, 65, 66, 68, 69, 72, 73, and 76 (numbering of amino acid residues sensu Fremont et al., 1998).
PHYLOGEOGRAPHICAL ANALYSIS
The genetic variation of the mitochondrial cyt b gene was investigated on the basis of the 90 sequenced individuals and 14 sequences downloaded from the GenBank database (Table 1) (Deffontaine et al., 2005). Previous phylogeographical studies of M. glareolus based on cyt b (Deffontaine et al., 2005, 2009; Kotlik
et al., 2006) have shown that there was a strong
geographical structure over Europe, with several well defined mitochondrial lineages, and a weak genetic differentiation among localities within these lineages. Therefore, we considered that including only few samples per locality would not limit our ability to detect the phylogeographical structure of M. glareolus populations based on cyt b sequences. We then com-puted both analysis of molecular variance (AMOVA: Excoffier, Smouse & Quattro, 1992) and spatial analy-sis of molecular variance (SAMOVA: Dupanloup, Schneider & Excoffier, 2002) to characterize the pat-terns of genetic divergence between sampling areas across the range of M. glareolus. We respectively used the software ARLEQUIN, version 3.11 (Excoffier, Laval & Schneider, 2005) and SAMOVA (Dupanloup
et al., 2002). The AMOVA method implies an a priori
definition of groups of localities among which the genetic differentiation will be estimated, whereas the SAMOVA method aims to cluster geographically homogeneous populations into a user-defined number of groups (K) so that the proportion of total genetic variance observed between groups (FCT) is maximized.
For the AMOVA procedure, localities with only one individual were removed from the analyses (Table 1). The remaining 28 populations were assigned to one of the seven geographical groups defined by Deffontaine
et al. (2005), Kotlik et al. (2006), and Deffontaine et al. (2009) on the basis of cyt b sequences
(Western-European, Basque, Spanish, Italian, Eastern-European, Balkan, and Ural lineages). We estimated
the differentiation indicesFSC,FCT, andFST,which are
analogous to Wright’s F-statistics. Their significance was evaluated using nonparametric permutation pro-cedures, with the type of permutation differing for each covariance component (Excoffier et al., 1992). SAMOVAs were computed on the whole dataset for
K-values ranging from 2 to 20. We searched for the
optimum among-group differentiation index (FCT)
with 100 random initial conditions. Among the 19 configurations obtained, the one that showed the maximum intergroup variance FCT, or the minimum
intragroup molecular varianceFSC, was likely to
cor-respond to the most plausible geographical structure (I. Dupanloup, pers. comm.). Both approaches were computed separately for the cyt b and the Dqa-exon2 genes.
RESULTS
DQA-EXON2 ALLELIC DIVERSITY AND
NUMBER OF TRANSCRIBED COPIES
Among the 318 bank voles genotyped on genomic DNA using CE-SSCP, 137 carried a single allele, 133 carried two alleles, 45 carried three alleles, and three carried four alleles. This corroborated the presence of at least two copies of Dqa-exon2 in the bank vole (Bryja et al., 2006).
We genotyped 320 clones derived from the genomic DNA of 38 bank voles. On the basis of the CE-SSCP profiles, we selected and sequenced 109 of these
clones. Using Kennedy’s criteria (2002), we identified and confirmed 16 different 227 bp sequences of the
Dqa-exon 2. We did not succeed in sequencing two
CE-SSCP profiles. All sequences were associated with a single distinguishable CE-SSCP pattern, except Clgl-Dqa*08 and Clgl-Dqa*19, which were unambigu-ously separated by the RFLP test (Fig. 2).
We sequenced cDNA fragments of 52 clones derived from 11 bank voles exhibiting diverse CE-SSCP pat-terns. We revealed six transcribed sequences of the
Dqa-exon 2 gene. Among them, five were identical to
genomic DNA sequences (Clgl-Dqa*04, Clgl-Dqa*05, Clgl-Dqa*08, Clgl-Dqa*09, and Clgl-Dqa*14). The allele Clgl-Dqa*30 could only be amplified using cDNA primers and was found in one of these 11 voles. This indicated that gDNA PCR might miss alleles as a result of mutations occurring at primer sites. In total, we therefore described 17 sequences of Dqa-exon2 and the transcription was confirmed for six of them. None of the other 11 sequences exhibited stop codons or shifts in the reading frame (Fig. 3). Despite the impossibility to assign alleles to specific copies (see below), we could conclude that both copies were transcribed as one individual exhibited three cDNA alleles (Clgl-DQA*08, *09, *14).
MOLECULAR EVOLUTIONARY ANALYSES
OF DQA-EXON2
Among the 227 nucleotide positions of the 17 Dqa-exon2 sequences confirmed in the present study, 97
Figure 3. Alignment of the 17 Dqa-exon2 amino acid sequences of Myodes glareolus and their corresponding GenBank
accession numbers. Dots indicate identity in the amino acid sequence of the Clgl-Dqa*04. Numbering of amino acid residues is performed sensu Brown et al. (1993). Rectangles indicate positively selected codons (w = 3.939), inferred by likelihood ratio modeling in the software CODEML (Yang, 1997). Grey rectangles indicate positively selected codons with a = 1%; white rectangles indicate positively selected codons with a = 5%. The asterisks indicate amino acids considered as antigen binding sites.
sites were variable and 66 were parsimony-informative. All 17 amino acid sequences were dif-ferent. We also revealed a high nonsynonymous substitution rate. Amino acid sequences exhibited 41 variable sites over 76. Among them, 33 were parsimony-informative.
The best substitution model derived from MODELT-EST was the Hasegawa–Kishino–Yano model with a gamma shape parameter estimated as 0.3787, and a proportion of invariant sites estimated as 0 (HKY+ G; Hasegawa, Kishino & Yano, 1985). The network based on nucleotide sequences exhibited a star-like topology and did not reveal any obvious allele cluster (Fig. 4). Because we would not assign alleles to specific copies, we performed further statistical analyses without dis-tinguishing the Dqa-exon2 copy.
The sliding window analysis implemented in PLATO did not detect any significant departure from the null homogeneous phylogenetic model for the sequences. This result indicated the absence of recom-bination in our sequences. This absence of recombi-nation was confirmed using the PHI test (P= 0.387). LRT tests suggested that the models M2a and M8, which assume selection, fitted the data significantly better than M1a and M7, respectively (Table 2). The results of model M8 suggested that 14 codons were positively selected (w2= 3.930), ten of them with a = 1%; the four others with a = 5% (Table 3). Twelve of these codons belonged to one of the two a-helix
from the extra-membranous structure of the protein that is involved in antigen binding (codons 11, 24, 31, 52, 53, 58, 62, 65, 66, 68, 72, 76). Two of the amino acids that appeared to be positively selected with a = 5 % have not been cited in the literature as being involved in the ABS.
Using the SLAC, FEL, and REL methods in HYPHY, we found strong evidence of positive selec-tion for 13 codons. Nine of them were also found using the CODEML method (codons 24, 31, 50, 52, 62, 65, 66, 68, 72, 73). Among the four codons that were not previously identified using CODEML, two corre-sponded to ABS positions (codons 22, 73).
PHYLOGEOGRAPHICAL ANALYSIS
A total of 73 haplotypes was identified among the 106 bank vole sequenced. Of the 1048 bp sequenced, 139
Clgl-DQA*24 Clgl-DQA*21 Clgl-DQA*09 g 96 Clgl-DQA*05 Clgl-DQA*35 Cl lDQA*12 Clgl-DQA*25 Clgl-DQA*11 82 97 94 97 63 60 Clgl-DQA*18 Clgl-DQA*12 100 85 76 100 100 Clgl-DQA*04 100 100 100 100 100 100 Clgl-DQA*08 Clgl-DQA*19 Clgl-DQA*22 Clgl-DQA*30 Clgl-DQA*16 Clgl-DQA*14 Clgl-DQA*20
Figure 4. Network generated by split decomposition using the set of 17 Dqa-exon2 alleles of Myodes glareolus, with
branch lengths included. Bootstrap values (%) are only indicated when greater than 50.
Table 2. Summary of the likelihood-ratio tests
Models compared d.f. Test statistic Significance
M1a versus M2a 2 71.63 P< 0.001
M7 versus M8 2 24.93 P< 0.001
Likelihood-ratio tests were performed for evaluating the
significance of the difference of likelihood between
maximum-likelihood models applied on Dqa-exon2 in
sites were variable and 133 were parsimony informa-tive. The average transitions/transversions ratio was equal to 9.14 and the base composition was of 28.0% of T, 29.0% of C, 29.7% of A and 13.4% of G. Although the number of cyt b haplotypes per locality may appear to be high, it is important to note that the nucleotidic diversity remained very low (over the whole dataset: p = 0.024), especially with regard to the one observed at the Mhc gene (over the whole dataset: p = 0.140). Population structure analyses based on the cyt b provided congruent results
com-pared to the study by Deffontaine et al. (2005). AMOVA showed that most of the total genetic varia-tion was distributed among phylogroups (74.19%) and that a lower percentage (6.29%) corresponded to variation among localities within these phylogroups (Table 4). Moreover, F statistics suggested that the among-group genetic differentiation was significant (FCT= 0.74, P< 10-3), as well as the among-localities
within group differentiation (FSC= 0.24, P< 10-3)
(Table 4). By contrast to the cyt b pattern, almost all the genetic variation of the Dqa-exon2 was
Table 3. Results of maximum likelihood models of Dqa-exon2 in Myodes glareolus
Model code Log-likelihood Parameter estimates Positively selected sites
M0 (one-ratio) -1380.720 w = 0.856 None
M1a (neutral) -1332.122 p0= 0.568, w0= 0.063, w1= 1 Not allowed
M2a (selection) -1309.091 p0= 0.474, p1= 0.352, w0= 0.051,
w1= 1, w2= 4.230
11, 12, 24, 31, 50, 52, 53, 58, 62, 65, 66, 68, 72, 76
M7 (beta) -1333.445 p= 0.125, q = 0.143 Not allowed
M8 (beta&w) -1308.510 p0= 0.820, p = 0.193, q = 0.294
ws= 3.939
11, 12, 24, 31, 50, 52, 53, 58, 62, 65, 66, 68, 72, 76
Data were analyzed under models M0 (one-ratio model), M1a (neutral model), M2a (selection model), M7 (beta distribution), and M8 (beta distribution and selection) using the software CODEML (Yang, 1997). These models differ in how sites are
distributed into categories of differentw-values (ratio of nonsynonymous to synonymous sites). Sites inferred under selection
at the 99% level by the M2a and M8 models are listed in bold; numbering of nucleic acids sensu Fremont et al. (1998).
Table 4. Results of the analysis of molecular variance based on cytochrome b (cyt b) and Dqa-exon2 in Myodes glareolus
Source of variation Variance components Percentage of variation F statistic P Cyt b Literature grouping (five groups represented out
of the seven described in the literature)
Among groups 11.43 74.19 FCT= 0.74 < 0.001
Among localities within groups 0.97 6.29 FSC= 0.24 < 0.001
Among individuals 3.01 19.52 FST= 0.80 < 0.001
SAMOVA grouping (eight groups)
Among groups 11.50 75.03 FCT= 0.75 < 0.001
Among localities within groups 0.89 5.79 FSC= 0.23 < 0.001
Among individuals 2.94 19.19 FST= 0.81 < 0.001
Dqa-exon 2
Literature grouping (five groups represented out
of the seven described in the literature)
Among groups 0.14 1.13 FCT= 0.03 0.14
Among localities within groups 0.41 3.33 FSC= 0.04 < 0.001
Among individuals 11.81 95.54 FST= 0.01 0.03
SAMOVA grouping (eight groups)
Among groups 0.94 7.46 FCT= 0.08 < 0.001
Among localities within groups -0.38 -3.05 FSC= -0.04 0.74
Among individuals 12.01 95.59 FST= 0.04 < 0.001
The genetic differentiation was estimated among groups of localities defined either on the phylogeographical groups proposed from mitochondrial data in Deffontaine et al. (2005, 2009) and Kotlik et al. (2006) (Literature grouping: Western, Balkans, Eastern, Ural, and Basque groups; Table 1) or on the most plausible geographical structure further defined by spatial analysis of molecular variance (SAMOVA grouping). Because the percentage of variation among localities within groups is obtained by subtraction, it may be slightly negative.
distributed among individuals (95.64%), whereas both the among-group and among-locality within group differentiation appeared extremely low (FCT= 0.03, P= 0.14; FSC= 0.04, P< 10-3) when
assigning populations to the phylogroups defined in the literature (Table 4).
As shown by Dupanloup et al. (2002), the results from the SAMOVA procedure confirmed that, when the number of groups (K) increased, the FSC index
(among-locality within group differentiation) progres-sively decreased. This was observed for both the
cyt b and the Dqa-exon2 genes (Fig. 5). Because the
FCT estimates showed no obvious maximum (they
remained more or less constant for the cyt b and described a parabola for the Dqa-exon2), we decided to consider only theFSCvalues for determining K, the
most likely number of groups. Concerning the cyt b, the relationship betweenFSCvalues and K showed an
important slope disruption for K= 8 (Fig. 5A). The structure of these eight groups almost exactly matched the group structure proposed in the AMOVA analyses and based on phylogroups (Deffontaine
et al., 2005, 2009; Kotlik et al., 2006). The Ural,
Spanish, Basque, and Balkan phylogroups were per-fectly preserved. The East-European phylogroup was split into two groups (Fig. 1A). The West-European phylogroup was exactly conserved, except one popu-lation that formed a separated group.F statistics and the percentage of variation obtained for these eight groups were very close to those estimated using AMOVA (Fig. 5A, Table 4). The results were quite different for the Dqa-exon2. The slope disruption was observed for K= 8 (Fig. 5B, Table 4). The composi-tion of these groups differed completely from the one defined using cyt b gene and showed no obvi-ous realistic geographical grouping (Fig. 1B). The 1 A Cyt b 0.6 0.8 0 2 0.4 0 . φ sc φ ct φ st -0.2 2 3 4 5 6 7 8 9 10 11 12 13 14 15 16 17 18 19 20 Number of groups (K) B Dqa-exon 2 0.1 0.15 0.2 -0.05 0 0.05 0 2 -0.15 -0.1 φ sc φ ct φ st Dif ferentiation indices Dif ferentiation indices - . 2 3 4 5 6 7 8 9 10 11 12 13 14 15 16 17 18 19 20 Number of groups (K)
Figure 5. Among-groups (FCT), among-populations within group (FSC), and among-individuals (FST) differentiation
indices estimated for (A) cytochrome b (cyt b) and (B) Dqa-exon2, considering K numbers of groups of populations of
Myodes glareolus. The groups were constituted using spatial analysis of molecular variance, which aims to cluster
geographically homogeneous populations so that the proportion of total genetic variance observed between groups (FCT)
localities Beaumont and Ardennes, which are geo-graphically close and belong to the same mitochon-drial lineage, did not cluster together using Mhc data. The same result holds for Ilmajoki and Konnevesi in Finland. This absence of a realistic geographical grouping was confirmed by the low genetic differen-tiation values observed among groups and among localities within group when performing the AMOVA on this grouping (FSC= -0.03, FCT= 0.07, FST= 0.04)
(Table 4). It is highly unlikely that potential null alleles could have been responsible for this pattern of low population structure observed at Mhc. Null alleles are expected to increase the values of between population differentiation estimates (Slatkin, 1995; Paetkau et al., 1997; Chapuis & Estoup, 2007). There-fore, the phylogeographical structure observed at Mhc might be over-estimated as a result of null alleles and, consequently, could be even lower than the one observed at the cyt b gene if we could correct for these null alleles.
DISCUSSION
MYODES GLAREOLUSDQA-EXON2POLYMORPHISM It is well demonstrated that Mhc genes are some of the most polymorphic coding loci known in mammals (Hedrick, 2002). Among this polymorphism, both genetic diversity at existing loci and variation in the number of expressed loci are important because they may contribute to variability in the number of differ-ent MHC proteins per individual. Our study revealed that these two processes were involved in M.
glare-olus Dqa-exon2 polymorphism.
We managed to detect 17 different sequences using both CE-SSCP genotyping and sequencing. Therefore,
Dqa-exon2 was as polymorphic in M. glareolus, as
had already been shown in other rodents (Pfau et al., 1999). The transcription of six of these sequences had also been proved in the present study, as well as the transcription of the two copies of Dqa-exon2. Because none of the 11 other sequences exhibited stop codons or frame shift mutations, we assumed that all these sequences were transcribed and coded for a functional protein involved in the immune response of M.
glare-olus. Increasing the number of individuals sampled
for RNA would probably allow the assesment of the transcription of most of these sequences. Our results indicated that there was variable selective pressure acting along the Dqa-exon2 gene of M. glareolus and that a number of sites experienced positive selection. According to previous studies (Fremont et al., 1998; Scott et al., 1998; Pfau et al., 1999; Latek et al., 2000; Bryja et al., 2006), most of the 14 codons that were positively selected appeared to be involved in the antigen biding site of the protein. Nevertheless, the
fact that M. glareolus protein structure was only com-prehended by analogy with related species could induce errors. Indeed, this protein structure, and consequently the ABS that evolve under positive selection, is expected to differ between taxa (Madden, 1995). Besides, we did not find any sites evolving under purifying selection, as observed in some mam-malian species by Furlong & Yang (2008).
We confirmed that Dqa-exon2 was duplicated in
M. glareolus (Bryja et al., 2006), although neither
CE-SSCP genotyping, nor phylogenetic reconstruc-tions enabled us to assign alleles to one or another copy of the gene. Only few individuals appeared to carry three or four alleles, potentially highlighting the presence of several null alleles. The use of different primer sets, especially during cDNA sequencing, because the two copies were obviously transcribed, should have provided the opportunity to detect such troubles. However, only one new allele had been revealed when applying cDNA primers. This result invalidated the hypothesis of many non-amplified alleles. Copy number variation (CNV) at the scale of the species was another plausible possi-bility explaining the low number of individuals car-rying more than two Dqa-exon 2 alleles. CNV is a well-known phenomenon, mostly documented in pri-mates (Perry et al., 2008) and over-represented among genes encoding proteins with signalling roles or with regulatory, structural or binding functions (Nguyen, Webber & Ponting, 2006). Bryja et al. (2006) showed that two other species of voles shared this Dqa duplication, whereas only one copy of this gene had been found in other rodents (Pfau et al., 1999; Sommer, Scwab & Ganzhorn, 2004; Bryja et al., 2006). Therefore, they concluded that this duplication is Arvicolinae-specific and should have taken place after the divergence between voles and the other rodents, that is between 5.5 and 9.3 Mya (Michaux & Catzeflis, 2000; Steppan, Adkins & Anderson, 2004). After this duplication event, the most plausible explanation for the observed intraspecific CNV was the heritable secondary loss of one of the copies, in some individuals. Because we have found individuals carrying only one or two alleles all over Europe and among all seven mitochondrial phylogroups (results not shown), we could affirm that the hypothetical secondary loss of one copy of the gene resulting in duplication polymorphism had arisen before the dif-ferentiation of these phylogroups (2.88–3.07 Mya; Deffontaine et al., 2005). Besides, it is also likely that selection could have maintained balancing polymor-phism in the number of Dqa-exon2 genes in ancestors of Arvicolinae. Parasite-mediated selection acting on the number of Mhc gene copies has, for example, been observed in sticklebacks (Eizaguirre & Lenz, 2010).
PHYLOGEOGRAPHICAL PATTERNS OF
DQA-EXON2 POLYMORPHISM
During the Quaternary, palaearctic species experi-enced substantial changes as a result of climatic fluctuations in their distribution area (Webb & Bar-tlein, 1992; Hewitt, 2000). The genome of M. glareolus was stamped by this history, especially in terms of phylogeography. Previous studies based on the cyt b gene highlighted seven phylogroups corresponding to glacial refugia (Deffontaine et al., 2005; Kotlik et al., 2006). The present study clearly reinforced these results by showing that most of the genetic variation observed at the M. glareolus cyt b gene was distrib-uted among these a priori defined geographical groups. Moreover, using a clustering method that did not rely on this a priori, we found a spatial genetic structure that almost perfectly matched these previ-ous studies. The splits observed in the structure of the Balkan and East-European groups were attri-butable to the geographical discontinuity of sampling, resulting in absence of data about intermediate genetic composition between distant populations, which could be construed by SAMOVA as genetic differentiation.
Unexpectedly, we were unable to detect any similar geographical distribution of the Dqa-exon2 genetic variation. First, most of this genetic variation was distributed among individuals, and the percentage of variation distributed among the a priori defined phy-logroups was extremely low. Second, the genetic structure maximizing the Dqa-exon2 differentiation among groups did not appear to correspond to any geographical reality. Based on spatial molecular analyses (SAMOVA) of Dqa genetic variability, we found eight geographically incoherent groups and a very low level of among-group differentiation. We concluded that there was no detectable spatial genetic structure at the Dqa-exon2 gene in M. glareolus, even at this biogeographical scale. Besides, we demon-strated an important genotypic diversity within the phylogroups defined from the literature: most of the alleles were present in all of them (Table 1). Previous studies of Mhc genetic diversity at large geographical scales invariably highlight signs of phylogeographical history, even when genes were under selection (Berg-gren et al., 2005; Langefors, 2005; Prugnolle et al., 2005). Berggren et al. (2005) showed evidence of selec-tion shaping Mhc polymorphism, although on diver-sity analyses only and not on spatial differentiation. The clear incongruence observed between the phylo-geographical patterns provided by cyt b and Dqa-exon2 in M. glareolus was thus a brand new result. It may have several non-exclusive origins, related to the methods used, to neutral evolutionary and demo-graphic processes or to selection acting on Mhc genes.
First, the method used to look for a genetic structure of M. glareolus populations did not take into account allelic frequencies. Although the use of such method-ologies could result in a poorer definition than quan-titative approaches (Charrier et al., 2006), we were confident that these tools were accurate enough to detect a genetic structure at the scale of the reparti-tion area of a species because their relevance had been demonstrated at the scale of populations (Gum, Gross & Kuehn, 2005; Pilot et al., 2006). Second, as a result of both the uniparental inheritance and the haploidy of the cytoplasmic genome, mitochondrial DNA effective population size is four-fold smaller than for nuclear genome. Consequently, the higher evolutionary rate (Brown, George & Wilson, 1979), as well as the lower population size, for the mitochon-drial marker could allow the detection of recent phy-logeographical signals, whereas slow-evolving nuclear markers could not. Although our results obviously fitted into the scheme of this scenario, this explana-tion alone could not explain the patterns observed. The evolutionary rate of nuclear markers could be sufficiently high to provide a detectable genetic dif-ferentiation between phylogroups, as a result of the last glaciation. This assumption is supported by our recent studies based on neutral nuclear microsatel-lites (Guivier et al., 2010). Indeed, we found strong genetic differentiation between European populations of M. glareolus sampled among the different mito-chondrial phylogroups of Deffontaine et al. 2005, 2009). However, the mutation rate of Mhc genes is far lower than those of microsatellites (the muta-tion rate at DRB1 locus in humans is estimated to be 6.53¥ 10-10per site per year; Ohashi et al., 2006) and
might not be sufficiently high to produce differentia-tion. Third, sex-biased dispersal could be invoked to explain incongruence between Mhc and cyt b phylo-geographical patterns. However, although territorial-ity had been documented in M. glareolus (Bujalska, 1970), this lineage sampling bias was only plausible at a local (i.e. population) scale (Prugnolle & de Meeus, 2002) and could not explain a total absence of genetic differentiation at a continental scale. Lastly, the incongruent distribution of genetic variation observed at cyt b and Dqa-exon2 could be related to differences of selective pressure acting on the mito-chondrial and nuclear genomes. Mitomito-chondrial DNA variations are implicitly supposed to be neutral in most phylogeographical studies (Avise et al., 1987), and especially in mammals (Nabholz et al., 2008). Moreover, Deffontaine et al. (2005) demonstrated that
cyt b gene did not reject the neutral model of
evolu-tion in M. glareolus. Besides, our molecular analyses clearly evidenced positive selection acting on the
Dqa-exon2 gene in M. glareolus. Such selection could
geographical distribution. In particular, Muirhead (2001) and Schierup, Vekemans & Charlesworth (2000) predicted lower spatial genetic differentiation for genes evolving under balancing selection than for neutral markers.
Several factors could potentially drive this evolu-tion of Mhc genes, including infectious agents, differ-ential abortion, and mating preferences (Apanius
et al., 1997). Because of the central role of Mhc genes
in the vertebrate immune system and the ubiquitous nature of this immune function in different taxa (Klein & O’Huigin, 1994), it is generally assumed that the main selective pressures affecting Mhc arise from parasites (Klein & O’Huigin, 1994; Prugnolle et al., 2005). Therefore, parasitism-driven balancing selec-tion appeared to be most likely hypothesis explaining this result, as well as its incongruence with the mito-chondrial phylogeographical pattern observed. It is likely that the distribution of Dqa-exon2 genetic variation resulted more from many-to-many parasite coevolution than from one-to-one gene-parasite coevolution (Gouy de Bellocq et al., 2008). Indeed, in natural populations, bank voles carried simultaneous infections of a variety of parasites (Behnke et al., 2001, 2008; Deter et al., 2008; Ribas Salvador et al., 2011). Previous studies based on
M. glareolus or other Arvicolinae species have
pro-vided evidence of parasite-mediated balancing selec-tion acting on Mhc class II genes but they only concerned small geographical scales (Deter et al., 2008; Tollenaere et al., 2008; Guivier et al., 2010; Kloch et al., 2010). Moreover, although each MHC glycoprotein has a degree of peptide binding specific-ity, it may bind to different peptides originating from different varieties of parasites (Altuvia & Margalit, 2004). Spatiotemporal variations in selective pres-sures experienced by the different lineages of
M. glareolus across Europe, as well as the important
local differentiation of parasites communities (Ribas Salvador et al., 2011) that could be maintained con-sidering the limited gene flow of M. glareolus (Gliwicz & Ims, 2000), are thus likely to mediate balancing selection at Mhc genes. A potential consequence would then be the weakening of the influence of history at the expense of the one of parasite-mediated selection in shaping Mhc phylogeographical pattern. Analyzing local host adaptations to these parasite communities and their changes through space and time could now provide a better understanding of the balancing selection acting on Mhc polymorphism (Charbonnel & Pemberton, 2005; Dionne et al., 2007; Ekblom et al., 2007; Oliver et al., 2009). Next-generation sequence technologies will soon provide the opportunity to evaluate in more detail the genetic diversity of parasite communities within the host, which should increase our understanding of the
microevolutionary processes shaping Mhc gene varia-tion (Alcaide, 2010).
It was reasonable to investigate whether the han-tavirus PUUV could have influenced the M. glareolus
Dqa phylogeographical pattern. On the one hand,
hantaviruses experienced a long coevolution with their specific hosts (Hughes & Friedman, 2000) and, on the other hand, PUUV phylogeography reflected the evolutionary and biogeographical history of
M. glareolus, at least in Fennoscandia (Asikainen et al., 2000; Johansson et al., 2008; Razzauti et al.,
2009). Divergence between M. glareolus (mitochon-drial) and PUUV phylogeographical patterns were found, although only at local scales (e.g. in Scandina-via; Nemirov et al., 2010). However, the present study revealed a complete incongruence between M.
glare-olus Mhc and cyt b phylogeography patterns over
Europe. Therefore, the phylogeography of M.
glare-olus based on the Dqa-exon2 gene did not appear to
reflect the global risks associated with this specific pathogen at a large geographical scale. This corrobo-rated the results of Guivier et al. (2010), who found associations between Mhc variants and susceptibility to PUUV infections at the Drb-exon 2 gene but not at the Dqa-exon2 gene. In M. glareolus at least, the evolution of the Dqa-exon2 gene must better be inves-tigated with regard to pathogen community structure and diversity.
ACKNOWLEDGEMENTS
We thank G. Amori, F. Catzeflis, C. Feliu, MG. Fili-pucci, R. Fons, J. Goüy de Bellocq, H. Henttonen, M. Heroldová, P. Kotlík, X. Lambin, R. Libois, E. Magnanou, C. Nieberding, G. Olsson, JP. Quéré, F. Sauvage, J. Searle, R. Sommer, M. Stanko, K. Tersago, and P. Trontelj who kindly provided the bank vole samples. We also thank warmly Isabelle Dupanloup for advices in phylogeographical analyses, especially concerning SAMOVA. This work received financial support from the Institut National de la Recherche Agronomique, and was partially funded by the EU grant GOCE-2003–010284 EDEN. The paper is catalogued by the EDEN Steering Committee as EDEN0138 (http://www.eden-fp6project.net/). The content of this paper does not represent the official position of the European Commission and is entirely under the responsibility of the authors.
REFERENCES
Alcaide M. 2010. On the relative roles of selection and
genetic drift in shaping MHC variation. Molecular Ecology
19: 3842–3844.
Alcaide M, Edwards SV, Negro JJ, Serrano D, Tella JL. 2008. Extensive polymorphism and geographical variation
at a positively selected MHC class II B gene of the lesser kestrel (Falco naumanni). Molecular Ecology 17: 2652– 2665.
Altuvia Y, Margalit H. 2004. A structure-based approach for
prediction of MHC-binding peptides. Bioinformatics in
Vaccine Design 34: 454–459.
Anisimova M, Bielawski JP, Yang ZH. 2001. Accuracy and
power of the likelihood ratio test in detecting adaptive molecular evolution. Molecular Biology and Evolution 18: 1585–1592.
Anisimova M, Bielawski JP, Yang ZH. 2002. Accuracy
and power of Bayes prediction of amino acid sites under positive selection. Molecular Biology and Evolution 19: 950– 958.
Apanius V, Penn D, Slev PR, Ruff LR, Potts WK. 1997.
The nature of selection on the major histocompatibility complex. Critical Reviews in Immunology 17: 179–224.
Asikainen K, Hanninen T, Henttonen H, Niemimaa J, Laakkonen J, Andersen H, Bille N, Leirs H, Vaheri A, Plyusnin A. 2000. Molecular evolution of Puumala
han-tavirus in Fennoscandia: phylogenetic analysis of strains from two recolonization routes, Karelia and Denmark.
Journal of General Virology 7: 2833–2841.
Avise JC. 2000. Phylogeography: the history and formation of
species. Cambridge, MA: Harvard University Press.
Avise JC, Arnold J, Ball RM, Bermingham E, Lamb T, Neigel JE, Reeb CA, Saunders NC. 1987. Intraspecific
phylogeography: the mitochondrial DNA bridge between population genetics and systematics. Annual Review of
Ecology and Systematics 18: 489–522.
Barreiro LB, Patin E, Neyrolles O. 2005. The heritage of
pathogen pressures and ancient demography in the human innate-immunity CD209/CD209L region. American Journal
of Human Genetics 77: 869–886.
Behnke JM, Bajer A, Harris PD, Newington L, Pidgeon E, Rowlands G, Sheriff C, Kulis-Malkowska K, Sinski E, Gilbert FS, Barnard CJ. 2008. Temporal and
between-site variation in helminth communities of bank voles (Myodes glareolus) from N.E. Poland. 1. Regional fauna and component community levels. Parasitology 135: 985–997.
Behnke JM, Barnard CJ, Bajer A, Bray D, Dinmore J, Frake K, Osmond J, Race T, Sinski E. 2001. Variation in
the helminth community structure in bank voles
(Clethri-onomys glareolus) from three comparable localities in the
Mazury Lake District region of Poland. Parasitology 123: 401–414.
Berggren KT, Ellegren H, Hewitt G, Seddon JM. 2005.
Understanding the phylogeographic patterns of European hedgehogs, Erinaceus concolor and E. europaeus using the MHC. Heredity 95: 84–90.
Bernatchez L, Landry C. 2003. MHC studies in nonmodel
vertebrates: what have we learned about natural selection in 15 years. Journal of Evolutionary Biology 16: 363–377.
Brown WM, George M, Wilson AC. 1979. Rapid evolution of
animal mitochondrial DNA. Proceedings of the Natural
Academy of Sciences of the United States of America 76:
1967–1971.
Brown JH, Jardetzky TS, Gorga JC, Stern LJ, Urban
RG, Strominger JL, Wiley DC. 1993. Three-dimensional
structure of the human class II histocompatibility antigen HLA-DR1. Nature 364: 33–39.
Bruen TC, Philippe H, Bryant D. 2006. A simple and
robust statistical test for detecting the presence of recom-bination. Genetics 172: 2665–2681.
Bryja J, Galan M, Charbonnel N, Cosson JF. 2006.
Dupli-cation, balancing selection and trans-species evolution explain the high levels of polymorphism of the DQA MHC class II gene in voles (Arvicolinae). Immunogenetics 58: 191–202.
Bryja J, Galan M, Charbonnel N, Cosson J-F. 2005.
Analysis of major histocompatibility complex class II gene in water voles using capillary electrophoresis-single stranded conformation polymorphism. Molecular Ecology
Notes 5: 173–176.
Bujalska G. 1970. Reproduction stabilizing elements in an
island population of Clethrionomys glareolus (Schreber, 1780). Acta Theriologica 15: 381–412.
Calendini F, Martin JF. 2005. PaupUP, version
1.0.2032.22590 Beta. A free graphical frontend for Paup* Dos software. Program distributed by the authors.
Celada F, Seiden PE. 1992. A computer model of cellular
interactions in the immune system. Immunology Today 13: 56–62.
Chapuis M-P, Estoup A. 2007. Microsatellite null alleles
and estimation of population differentiation. Molecular
Biology and Evolution 24: 621–631.
Charbonnel N, Pemberton J. 2005. A long-term genetic
survey of an ungulate population reveals balancing selection acting on MHC through spatial and temporal fluctuations in selection. Heredity 95: 377–388.
Charrier G, Durand J-D, Quiniou L, Laroche J. 2006. An
investigation of the population genetic structure of pollack (Pollachius pollachius) based on microsatellite markers.
ICES Journal of Marine Science 63: 1705–1709.
Cooke GS, Hill AVS. 2001. Genetics of susceptibility to
human infectious disease. Nature Review Genetics 2: 967– 977.
De Boer RJ, Perelson AS. 1993. How diverse should the
immune system be? Proceedings of the Royal Society of
London Series B, Biological Sciences 252: 171–175.
Deffontaine V, Ledevin R, Fontaine MC, Quéré J-P, Renaud S, Libois R, Michaux JR. 2009. A relict bank vole
lineage highlights the biogeographic history of the Pyrenean region in Europe. Molecular Ecology 18: 2489–2502.
Deffontaine V, Libois R, Kotlik P, Sommer R, Nieberd-ing C, Paradis E, Searle JB, Michaux JR. 2005. Beyond
the Mediterranean peninsulas: evidence of central Euro-pean glacial refugia for a temperate forest mammal species, the bank vole (Clethrionomys glareolus). Molecular Ecology
14: 1727–1739.
Deter J, Bryja J, Chaval Y, Galan M, Henttonen H, Laakkonen J, Voutilainen L, Vapalahti O, Vaheri A, Ribas Salvador A, Morand S, Cosson JF, Charbonnel N. 2008. Association between the DQA MHC class II gene
and Puumala virus infection in Myodes glareolus, the bank vole. Infection, Genetics and Evolution 8: 450–458.