Glob Change Biol. 2021;00:1–21. wileyonlinelibrary.com/journal/gcb | 1 DOI: 10.1111/gcb.15471
R E S E A R C H R E V I E W
Ecotrons: Powerful and versatile ecosystem analysers for
ecology, agronomy and environmental science
Jacques Roy
1| François Rineau
2| Hans J. De Boeck
3| Ivan Nijs
3| Thomas Pütz
4|
Samuel Abiven
5,6| John A. Arnone III
7| Craig V. M. Barton
8| Natalie Beenaerts
2|
Nicolas Brüggemann
4| Matteo Dainese
9| Timo Domisch
10| Nico Eisenhauer
11,12|
Sarah Garré
13| Alban Gebler
11| Andrea Ghirardo
14| Richard L. Jasoni
7|
George Kowalchuk
15| Damien Landais
1| Stuart H. Larsen
16| Vincent Leemans
13|
Jean-François Le Galliard
6,17| Bernard Longdoz
13| Florent Massol
6|
Teis N. Mikkelsen
18| Georg Niedrist
9| Clément Piel
1| Olivier Ravel
1| Joana Sauze
1|
Anja Schmidt
11| Jörg-Peter Schnitzler
14| Leonardo H. Teixeira
19| Mark G. Tjoelker
8|
Wolfgang W. Weisser
20| Barbro Winkler
14| Alexandru Milcu
1,211Ecotron Européen de Montpellier, Univ Montpellier, CNRS, Montferrier sur Lez, France
2Environmental Biology, Centre for Environmental Sciences, Hasselt University, Diepenbeek, Belgium 3Plants and Ecosystems (PLECO), University of Antwerp, Wilrijk, Belgium
4Institute of Bio- and Geosciences, IBG-3: Agrosphere, Forschungszentrum Jülich GmbH, Jülich, Germany 5Laboratoire de Géologie, Département de Géosciences, Ecole normale supérieure (ENS), Paris, France 6CEREEP-Ecotron Ile De France, ENS, CNRS, PSL Research University, Saint-Pierre-lès-Nemours, France 7Division of Earth and Ecosystem Sciences, Desert Research Institute, Reno, NV, USA
8Hawkesbury Institute for the Environment, Western Sydney University, Penrith, NSW, Australia 9Eurac Research, Institute for Alpine Environment, Bolzano/Bozen, Italy
10Natural Resources Institute Finland (Luke), Natural Resources, Joensuu, Finland 11German Centre for Integrative Biodiversity Research (iDiv), Halle-Jena-Leipzig, Germany 12Institute of Biology, Leipzig University, Leipzig, Germany
13Gembloux Agrobio Tech, TERRA Research Center, University of Liege, Gembloux, Belgium
14Research Unit Environmental Simulation, Institute of Biochemical Plant Pathology, Helmholtz Zentrum München, Neuherberg, Germany 15Ecology & Biodiversity, Institute of Environmental Biology, Utrecht University, Utrecht, Netherlands
16Bio-Protection Research Centre, Lincoln University, Christchurch, New Zealand 17Institut d'Ecologie et des Sciences de l'Environnement, CNRS, Paris, France
18Environmental Engineering, Air, Land & Water Resources, Denmark Technical University, Lyngby, Denmark 19Restoration Ecology, School of Life Sciences Weihenstephan, Technical University of Munich, Freising, Germany 20Terrestrial Ecology, School of Life Sciences Weihenstephan, Technical University of Munich, Freising, Germany 21Centre d'Ecologie Fonctionnelle et Evolutive, Univ Montpellier, CNRS, Univ Paul Valéry, EPHE, IRD, Montpellier, France
This is an open access article under the terms of the Creative Commons Attribution-NonCommercial-NoDerivs License, which permits use and distribution in any medium, provided the original work is properly cited, the use is non-commercial and no modifications or adaptations are made.
© 2020 The Authors. Global Change Biology published by John Wiley & Sons Ltd Correspondence
Jacques Roy, Ecotron Européen de Montpellier, Univ Montpellier, CNRS, Montferrier sur Lez, France. Email: [email protected]
Abstract
Ecosystems integrity and services are threatened by anthropogenic global changes. Mitigating and adapting to these changes require knowledge of ecosystem func-tioning in the expected novel environments, informed in large part through
Present address
Sarah Garré, Research Institute for Agriculture Fisheries and Food (ILVO), Melle, Belgium
Anja Schmidt, Department of Community Ecology, Helmholtz Centre for
Environmental Research – UFZ, Halle, Germany
Funding information
Centre National de la Recherche Scientifique; Agence Nationale de la Recherche, Grant/Award Number: ANR-11-INBS-0001; FEDER 44135 Montpellier; Occitanie Region; Universiteit Hasselt, Grant/Award Number: BOF12BR01, BOF15AF01 and BOFR3997; Regional Landcape Kempen and Maasland; Limburg Sterk Merk, Grant/Award Number: 271; FSR Flanders, Grant/Award Number: G0H4117N; FWO, Grant/Award Number: G0H4117N and I000719N; Flemish Government : Hermes
experimentation and modelling. This paper describes 13 advanced controlled en-vironment facilities for experimental ecosystem studies, herein termed ecotrons, open to the international community. Ecotrons enable simulation of a wide range of natural environmental conditions in replicated and independent experimental units while measuring various ecosystem processes. This capacity to realistically control ecosystem environments is used to emulate a variety of climatic scenarios and soil conditions, in natural sunlight or through broad-spectrum lighting. The use of large ecosystem samples, intact or reconstructed, minimizes border effects and increases biological and physical complexity. Measurements of concentrations of greenhouse trace gases as well as their net exchange between the ecosystem and the atmos-phere are performed in most ecotrons, often quasi continuously. The flow of matter is often tracked with the use of stable isotope tracers of carbon and other elements. Equipment is available for measurements of soil water status as well as root and canopy growth. The experiments ran so far emphasize the diversity of the hosted research. Half of them concern global changes, often with a manipulation of more than one driver. About a quarter deal with the impact of biodiversity loss on eco-system functioning and one quarter with ecoeco-system or plant physiology. We discuss how the methodology for environmental simulation and process measurements, es-pecially in soil, can be improved and stress the need to establish stronger links with modelling in future projects. These developments will enable further improvements in mechanistic understanding and predictive capacity of ecotron research which will play, in complementarity with field experimentation and monitoring, a crucial role in exploring the ecosystem consequences of environmental changes.
K E Y W O R D S
biodiversity, controlled environment facilities, ecosystem functioning, ecosystem process measurements, environmental simulations, experimentation, global change, research infrastructures
1 | INTRODUCTION
In the face of rapid climate change and biodiversity loss, the goods and services provided by ecosystems are under increasing threat (Pecl et al., 2017; Scheffers et al., 2016), and securing their fu-ture delivery is one of today's most pressing challenges (Arneth et al., 2019; Challinor et al., 2017; Díaz et al., 2019; Wheeler & Von Braun, 2013). To do so, we need a better understanding of the fundamental processes underpinning ecosystem functions and services and of how these processes will be altered in the novel environments of the future. This understanding will foster the development of mitigating management strategies through inno-vation and adaptation. Ecosystem science is developing at a fast rate, taking advantage of progress in other scientific disciplines (e.g. genomics, metabolomics, phenomics, spectronomics, etc.) and of development of new technologies (e.g. metabarcoding, new laser gas/isotope analysers, high-resolution proximate and remote sensing, etc.). What is now expected from ecosystem science is a stronger adoption of interdisciplinary approaches connecting
theory, experiments, field observations, modelling and simulation to address pressing questions on the future of ecosystems and societal welfare (Hanson & Walker, 2020; Mauser et al., 2013) and the complexity of biodiversity–ecosystem feedbacks (Abiven et al., 2017).
In this context, controlled environment facilities (CEFs), such as growth chambers and advanced greenhouses, have become stan-dard tools to simulate different environmental conditions and disen-tangle their influences on ecosystem functioning. These have been used, for example, to reveal the underlying mechanisms of observed overall responses, for model parametrization and for theory testing (Clobert et al., 2018; Hanson & Walker, 2020; Kreyling et al., 2014). CEFs have been steadily improved through the use of better lighting systems, the regulation of additional parameters, such as CO2 and ozone, user-friendly computerized environmental control and the possibility of remote operation and security checks. During the last three decades, however, a more innovative step forward has been achieved through the development of a more heavily instrumented type of CEF: herein termed ecotrons. We define an ecotron as an
experimental facility comprising a set of replicated enclosures de-signed to host ecosystems samples, enabling realistic simulations of aboveground and belowground environmental conditions while automatically measuring ecosystem processes. Therefore, ecotrons provide continuous information on ecosystem functioning (fluxes of energy and matter).
This principle of using enclosures (a lysimeter for the soil and an aerial compartment around the canopy) for simultaneous environ-mental control and process measurement has been pioneered, at the canopy level, by field physiologists as early as the 1930s (Thomas & Hill, 1937), but most of these sunlit facilities were developed from the 1960s (Liu et al., 2000). Starting with the München ExpoSCREEN (Payer et al., 1986), the Imperial College ecotron in Silwood Park (Lawton, 1993) and the Desert Research Institute EcoCELLs in Reno (Griffin et al., 1996), larger permanent infrastructures, open to national and international collaboration, were constructed. Four ecotrons were built between 1985 and 2006, eight between 2010 and 2020 and two more are under construction. A more thorough historical background with the etymology of the word ecotron is provided in the Supporting Information file ‘Ecotron-related facil-ities’. These ecotrons can be seen as a new means of performing ecological research through centralized, shared and heavily instru-mented research facilities mirroring practices in other disciplines such as astronomy and physics (Granjou & Walker, 2016; Rineau et al., 2019).
This paper reviews the characteristics of existing ecotrons (or ecotrons under construction), focusing on their environmental con-trol capacities and the design and technology underpinning ecosys-tem process measurements. Since most of them are open to national and international collaboration, we also outline the advantages and prospects of using the listed ecotrons. An analysis of the experi-ments conducted so far reveals the large range of research topics that can be addressed in these infrastructures, but we also address their limitations, emphasizing the necessary complementarity be-tween ecotrons and other experimental or observational facilities for the pursuit of predicting, mitigating and adapting to ongoing global environmental changes. Finally, we discuss the perspectives on the future development of ecotrons and the need to combine their experiments with modelling efforts.
2 | THE FEATURES OF ECOTRONS
Advantages of ecotrons are increasingly acknowledged by the sci-entific community and funding bodies, as indicated by the growing investment of research institutes and universities in such new facili-ties. However, part of the scientific community is not up to date with the more recently developed features and is not fully aware of the advantages and trade-offs of ecotron experiments relative to green-house or field experimental approaches. Throughout this section, we discuss the features of ecotrons showing that in addition to de-veloping specific technologies, their strength is to cumulate many of the advantages found in some of these other experimental facilities.
2.1 | More realistic experiments, across a broad
range of environmental conditions
Ecosystem experiments can be conducted in settings that vary in realism, environmental control and replication of experimental units, along previously described trade-offs (De Boeck et al., 2015; Diaz et al., 2003; Stewart et al., 2013). Here we define realism as pro-viding conditions as close as possible to the complexity of natural environments, whether in the past, present or predicted future. This implies the capability to simulate natural ranges, dynamics and com-binations of abiotic and biotic variables. Especially in global change research, realism also includes the need to impose experimental treatments going beyond the historical record (Hanson & Walker, 2020), and even beyond the current model-predicted climate change scenarios (De Boeck et al., 2020).
Generally, confined ecosystems have a reduced spatial and bi-ological complexity, are surrounded by walls and have modified physics (e.g. energy exchange), compared with natural ecosystems. Ecotrons deal with these issues via a series of features that set them apart from typical growth chambers and which render the exper-imental conditions closer to field conditions. One such feature is using large ecosystem samples hosted in large enclosed atmospheric volumes (see details on the features in Section 3), thus incorporat-ing more aboveground and belowground biological complexity and spatial heterogeneity. Whenever possible and suitable, intact soil monoliths are extracted in situ and inserted in the ecotron enclo-sures, thus preserving soil physicochemical properties, soil biota and vegetation. Getting closer to realistic outdoor conditions is important, as there is accumulating evidence that the use of small and simplified systems such as pots or small containers brings iden-tified biases (Poorter et al., 2012) or unideniden-tified laboratory-specific artefacts (e.g. Massonnet et al., 2010; Milcu et al., 2018) that may generate results with less external validity (i.e. results which can be generalized with less confidence; Poorter et al., 2016).
Another feature that improves experimental realism is the capac-ity of most ecotrons to simulate a wider range of environmental pa-rameters than is usually the case in growth chambers, or in some of the earlier ecotrons (e.g. Silwood Park ecotron; Lawton et al., 1993). The following conditions can be reached, although not in all facilities (details in the section referred to above): freezing or near-freezing air temperatures maybe achieved through the use of refrigeration, such as compressed gas expansion within the air circuit; very low air rela-tive humidity achieved by injecting dry air; replicating the in situ soil matrix potential at the bottom of the soil column that affects evapo-transpiration (Groh et al., 2016) and replicating the in situ soil tem-perature gradient that affects soil respiration as well as plant growth (Füllner et al., 2012). To improve realism, some ecotrons take advan-tage of natural sunlight while only reducing light intensity to a minor extent including in the UV range, while others combine light-emit-ting diodes (LED) or a mixture of metal halide/quartz halogen lamps and fluorescent tubes (as cited in Ghirardo et al., 2020) to achieve a radiation spectrum approaching that of the sun. Taken together, these features considerably step up the realism of environmental
control and allow for the simulation of past or future environmen-tal conditions and climatic extremes with improved accuracy and precision. As a result of the realism of the simulated environmental conditions combined with the incorporation of more aboveground and belowground complexity, ecotron experiments are often much closer to field experiments than most typical CEF experiments.
2.2 | Disentangling ecosystem mechanisms
through confinement and replication
The ecotrons' capacity to independently manipulate biotic as well as abiotic variables comes with many advantages, the most impor-tant one being the disentanglement of the ecological effects of vari-ables that often co-vary in natural settings. For example, drought and co-varying factors such as temperature, vapour pressure defi-cit and sunlight (De Boeck & Verbeeck, 2011), or atmospheric CO2 and its effect on leaf and canopy temperature (Leuzinger & Körner, 2007), can be independently controlled and their impacts untwined. Similarly, treatments that manipulate soil biota presence and diver-sity can be relatively easily established in ecotrons, a manipulation challenging in the field without disturbing the ecosystem and risking contamination from the surroundings. Combining soil sterilization techniques and subsequent inoculation of specific species or groups of species, ecotrons are a powerful tool for exploring the effects of specific biota on ecosystems (Bradford et al., 2002). Another over-looked feature of ecotrons is their inherent capacity to incorporate environment-biotic feedbacks as well as the possibility to impose feedbacks as experimental treatments. For the first aspect, we em-phasize the fact that the large size of the experimental systems will inherently incorporate more of the natural biological diversity of the model system. Hence, more key taxa that will be present and will realistically respond to the experimental treatments and feedback on soil properties or other taxa, a response likely less to occur with smaller pot-size systems. For the second aspect, while some of these feedbacks can be performed in the field and in classical CEFs (e.g. plant–soil biota feedbacks; Van der Putten et al., 2013), other feed-backs require greater control over the environmental variables. For example, using materially closed systems in the former Silwood Park ecotron, Milcu et al. (2012) established CO2-temperature feedback treatments in a simplified physical model of the terrestrial C cycle. The temperature of the experimental systems was continuously ad-justed depending on the emerging CO2 concentration of the units (using the most likely CO2-temperature sensitivity) resulting from the combination of simulated anthropogenic emissions, photosyn-thesis and plant and soil respiration.
Disentangling the ecological effects of different variables requires multiple identical and independently controlled experimental units. Lack of replication at the unit level can lead to biased parameter esti-mates (Porter et al., 2015), because any confounding chamber effect is not taken into account (Potvin & Tardif, 1988). Given that the high construction cost can limit the number of ecotron experimental units, several facilities opted for a minimum of 12 units, since it allows the
establishment of treatments with 6, 4 and 3 replicates per treatment combination for experimental designs with 2, 3 and 4 treatment com-binations, respectively. Such a series of experimental units also suits gradient experiments with many different, un-replicated treatment levels, to which a regression-type analysis is applied instead of an analysis of variance requiring replication. Gradient experiment is an underused methodology appropriate for identifying thresholds, tip-ping points and response functions (Kreyling et al., 2018).
2.3 | A major focus on measurements of
ecosystem processes
Next to the capacity to simulate and measure multiple environ-mental conditions, the most compelling characteristic of ecotrons is their focus on non-destructive, automatic, real-time measure-ments of ecosystem-level processes. Some ecotrons are specifi-cally designed to use the confinement of the ecosystem as large gas exchange chambers (e.g. Barton et al., 2010; Milcu et al., 2016), analogous to leaf chambers in portable photosynthesis systems. This allows the measurement of the net ecosystem exchange (NEE) between the terrestrial compartment and the atmosphere for various molecules (CO2, N2O, CH4, H2O, O3, NOx, volatile or-ganic compounds [VOCs]) using either a static non-steady state or a dynamic (flow-through) steady-state approach. Both approaches are feasible but they require that one single ecosystem is hosted within each chamber, in stark contrast with CEFs where different model systems (set-ups in pots or containers) are incubated side by side. These NEE rates are measured at high frequency (every 10–20 min), capturing both the short-term and the cumulative long-term responses of elemental budgets with a high degree of confidence (e.g. Roy et al., 2016). Ecotrons offer the possibility to balance all fluxes: the inflow, stock and outflow can be precisely quantified for most components of the soil/plant/atmosphere system, including energy. Furthermore, the recent availability of multi-gas and multi-isotopologue laser analysers enables simulta-neous measurements of the molecules listed above, as well as their isotopologues (e.g. Braden-Behrens et al., 2017; Braendholt et al., 2019; McManus et al., 2015). Examples of processes estimated by the measurements of isotopic fractionation and isotopomers in-clude canopy conductance and respiration as well as the coupling of CO2 and H2O cycles via δ13C and δ18O of CO
2 (Harwood et al., 1999), nitrification and denitrification processes via δ15N, δ18O and isotopomers of 15N, that is, the 15N site preference (SP) in N
2O (Baggs, 2008; Butterbach-Bahl et al., 2013), and tracing ecosystem water fluxes and disentangling evapotranspiration via δ2H, δ18O of H2O (liquid and vapour; Oerter & Bowen, 2017).
Other ecotrons focus on automatic measurements of ecosystem properties that are not related to ecosystem gas exchange. These in-clude root growth using minirhizotrons (Möller et al., 2019), invertebrate and plant community composition using novel imaging techniques like computerized trap systems, video cameras or radio frequency identifi-cation (Dell et al., 2014; Dombos et al., 2017), thermography to analyse
the heterogeneity of transpiration, and hyperspectral reflectance for canopy biomass and chemical content (Tan et al., 2018; Xie et al., 2020). Similar to what is done in other experimental settings, in all ecotron experiments the automatic measurements are complemented by low-frequency samplings of soil, plants, soil solution, leachate, etc., for further analysis of fauna and microbe diversity, elemental and iso-topic composition of soil, water and plant material, delivering a more complete understanding of the impact of the experimental treatments. These complementary analyses are generally performed by the hosted teams and are often not the responsibility of the ecotron facility.
2.4 | Experimental flexibility
While generally costly to build, run and maintain, ecotrons offer significant experimental flexibility. First, they can host many dif-ferent types of treatments (climate, atmospheric composition and pressure, pollution, soil types, trophic levels, biodiversity within trophic levels, ecosystem management, etc.). For some of these treatments which are outside of the range of current environmen-tal conditions, specific regulations have been insenvironmen-talled, for exam-ple decreased CO2 in air using scrubbing molecular sieves to reach pre-industrial CO2 concentrations; ozone fumigation produced by an ozone generator plugged on pure oxygen gas bottles; low oxygen concentration through dilution with nitrogen and simultaneous re-adjustment of CO2 concentration. Furthermore, unlike field facilities which are bound to a specific ecosystem, in ecotrons the targeted model system can change from one experiment to the other, ranging from agricultural systems to grasslands, peatlands, shrublands and regenerating forest (saplings), essentially any ecosystem type where plant stature fits the height of the units. However, the flexibility to host various ecosystem types in consecutive experiments often trades off against their duration. One solution is to bring ecosystem samples extracted from long-term field experiments to the ecotron for short-term, more thorough, physiological measurements (i.e. use the ecotron as an ecosystem analyser, e.g. Milcu et al., 2014) or for applying complementary treatments. Ecotrons are often also flex-ible in terms of dimensions. The size of the lysimeters and the height of the canopy enclosures can often be tuned to the particular exper-iment. In some ecotrons, the main experimental unit can be divided into subunits to vary their connectivity, thus allowing the study of spatial and meta-population dynamics (Eisenhauer & Türke, 2018). Some ecotron platforms can work with either sunlight or artificial light (e.g. Resco de Dios et al., 2016). Another element of flexibility is the option for hosted research teams to temporarily install supple-mentary costly instruments in the ecotron air circuits, such as VOCs or NOx analysers to bring added value by answering additional questions. The length of the experiments carried out in ecotrons so far is variable as it depends on the addressed scientific question. It can be relatively short (e.g. 4 months), especially when samples from long-term field experiments are used (see section Complementarity between ecotron and field experiments) or can last up to 3 years. The average length of experiments run so far is 1 year.
2.5 | Open access to the infrastructure
The physical sciences traditionally share their state of the art, large and costly infrastructures with hundreds of scientists from all over the world. Since ecotrons are also costly to build and run, albeit to a lesser scale, the experiments often include international teams as-sembled in large consortia. This arrangement facilitates the interac-tion among scientists with the complementary expertise needed to perform interdisciplinary research projects, for example, plant and animal ecologists, hydrologists, microbiologists, chemists, modellers, data scientists, etc. Therefore, most ecotrons work with open access calls. In most cases, ecotron experiments do not require a permanent presence of personnel from the external teams running an experi-ment: most of the environmental controls and key process measure-ments are automated, and the ecotron personnel regularly check the proper functioning of the instruments. Moreover, data are accessible in quasi real-time via dedicated web interfaces. The external team is mainly involved in setting up the experiment and specific measure-ment campaigns. The most ambitious experimeasure-ments, however, rely on a dedicated post-doc and/or technician located at the ecotron.
Although open to private companies, most ecotrons are pri-marily running projects involving researchers from universities and/or research institutes and supported by public funding. The facilities charters may impose an open access data policy after a short embargo period. This access is often organized at the na-tional level (nodes coordinating sets of ecosystem experimental facilities) or international level (e.g. the European ESFRI infrastruc-ture AnaEE—Analysis and Experimentation on Ecosystems—www. anaee.eu, which includes several ecotrons). In Europe, the Cluster of Environmental Research Infrastructures (ENVRI) is developing a project (https://envri.eu/home-envri -fair) to feed the data from its constituent infrastructures (AnaEE and others) to the European Open Science Cloud.
2.6 | Choosing between running experiments in
CEF, field or ecotron
In the context of the former Silwood Park ecotron, Lawton (1995) ar-gued that ‘model laboratory systems (real organisms interacting in the laboratory) are a halfway house between mathematical models and the full complexity of the field’. Current ecotron facilities, through their improved realism, are much closer to experimental field condi-tions. However, a comparison among experimental systems should include multiple criteria to inform choice of the facility best fit for the purpose: hypotheses that require environmental conditions techni-cally difficult to achieve in the field and/or intensive process meas-urements would be better tested in ecotron experiments, as long as the number of drivers remains low. Hypotheses testing that requires a high level of realism and a large number of treatments or replicates would be best done in field experiments, at least when the appli-cation of treatments does not require expensive technology. CEF experiments appear to have considerably more limitations, but are
certainly needed for rapid preliminary trials or when field or ecotron experiments are not available or are too costly to run.
3 | THE CHAR ACTERISTICS OF CURRENT
ECOTRONS
We identified 13 facilities having the defining features of ecotrons, including 11 facilities in Europe, one in North America and one in Australia (Tables 1A and 1B; Figure 1). Two were operational since the 1980s and 1990s, but most of them opened between 2010 and 2020, and two additional ones are currently being built. The Supporting Information file ‘Ecotrons description’ describes each facility, with website links, pictures, contextual information, spe-cific technical details, contacts for collaboration and a short list of
key publications. In another Supporting Information file (‘Ecotron-related facilities’), some CEFs are described which paved the way for the development of current ecotrons (the phytotrons of the 1950s and 1960s, the sunlit growth chambers, the Closed Ecological Life Support Systems, the early ecotrons) or facilities which are now being developed for aquatic ecosystem research and plant phenotyping.
Design differences among ecotrons reflect the scientific and stra-tegic objectives of the funding organizations. The average construction cost of the most recent (2010 and after) ecotron platforms is 6 M€ with a large range of variation (3–10 M€) revealing differences in the number or size of the experimental units or in their control and measurement capacities. For a given amount of available funds, there are unavoidable trade-offs among (i) the number of controlled environmental parame-ters (with light quality and isotopes being the most complex/expensive ones to control); (ii) the number of processes measured in real time by
TA B L E 1 A Administrative and structural characteristics of the ecotrons. Additional information on each facility (including, in some cases, specific capacities of a subgroup of experimental units) are given in the Supporting Information file ‘Ecotrons descriptions’
Ecotron short name Owner Town, country
Opening
year Access Staff
No. climate controlled cells Area each cell m2 ExpoSCREEN, München Helmholtz Zentrum München Neuherberg, Germany 1985 ● 3 4 6
EcoCELLs, Reno Desert Research
Institute
Reno, Nevada USA 1995 ● 0.25 4 40.5
Whole Tree Chambers,
Richmond Western Sydney University Richmond, NSW, Australia 2006 ○ 1 12 8.3
Montpellier Ecotron, Macrocosms
CNRS (INEE) Montferrier sur Lez, France
2010 ● 2.7 12 20
IledeFrance Ecotron Ecolab, Nemours
CNRS (INEE) Saint- Pierre- lès- Nemours, France
2017 ● 3.5 15 4.5
iDiv Ecotron, Leipzig iDiv, Leipzig University
Bad Lauchstädt, Germany
2017 ○ 1.5 24 2
TUMmesa, München Technical University Munich
Freising, Germany 2017 ○ 1 8 8
UHasselt Ecotron,
Hasselt Hasselt University Maasmechelen, Belgium 2018 ○ 2.7 12 19
TERRA Ecotron, Gembloux
Liège University Gembloux, Belgium 2018 ● 2 6 20.3
Montpellier Ecotron, Mesocosms
CNRS (INEE) Montferrier sur lez, France
2018 ● 2.7 18 1
TerraXcube, Bolzano Eurac Research Bolzano/Bozen,
Italy
2020 ● 2 4 9
AGRASIM, Jülich Forschungszentrum
Jülich
Jülich, Germany 2021– 2022 ○ 3 4 2.6
Antwerp Ecotron University of
Antwerp Antwerp, Belgium 2021 −2022 ● 1 Not set 4
Notes: Access, ● open calls (see Supporting Information file ‘Ecotrons individual descriptions’ for links to these calls) with occasional in- house
collaborative projects; o in- house projects with external collaborations; Staff, Number of persons/year (permanent or on temporary contract) fully dedicated to the functioning of the ecotron. (e.g. 1 means that there is the equivalent of one technical person working 12 months full time for the facility).
Number of cells, The cells provide (independently from each other) the climate control over a single lysimeter (they are then called enclosures) or over several lysimeters (in that case they are then called chambers).
Area cell, Area of each enclosure or chamber allowing the climate control. It is the lysimeter(s) area plus, if present, a walking area around the lysimeter(s).
automated systems (with soil respiration, trace gas emission, isotope fractionation and faunal activity being the most complex/expensive ones to measure); (iii) the number of replicated units, and (iv) the size of
these units. The ecotrons planning phase took 2.5 years in average and the building phase (including tests) 3.5 years. Average annual running costs in 2019 were ≈140 k€ (with 80 k€ for the maintenance and small
TA B L E 1B Continued
Ecotron short name
No. lysimeters/
cell* Area each lysimeter m2 Air volume** m3 External air flux*** m3/min Air internal recirculation m3/min Plant height max m Soil depth max m Soil weight/
lysimeter Biosafety level
ExpoSCREEN, München
4 0.6 0.5** 1.3 to 2.7 None 0.8 ≤0.7 0.5 t 1
EcoCELLs, Reno 1 9 or 11 130 13 to 130 ~660 2.4 1.8 36 t 1
Whole Tree Chambers, Richmond 1 8.3 53 0.6 180 9 1 In situ 1 Montpellier Ecotron, Macrocosms 1 2 or 4 or 5 35 2.7 70 3 0.6– 2 3 to 15 t 1 IledeFrance Ecotron Ecolab, Nemours 1* 1.3 13 0 to 200 0– 1.25 1.5 0.8 ≤ 2 t 1
iDiv Ecotron, Leipzig 1* 0.2 3 <6 None 1.5 (1.2) 0.8 0.2 t 1
TUMmesa, München 4* 0.38 36 1.9 83 1.5 0.8 238 kg 1 UHasselt Ecotron, Hasselt 1 3.14 222 0 60 2.5 1.4 5– 12 t 1 TERRA Ecotron, Gembloux 1* 2 65 45 1– 3.2 1.5 1.5 6 t 2 Montpellier Ecotron, Mesocosms 1 1 4 0– 0.5 10 1.8 1 0.3– 2 t 1 TerraXcube, Bolzano 4 0.13 27 1.7 60 2.5 0.4 60 kg 2 AGRASIM, Jülich 1 1 6.9 0.02– 1 ≤27 2.5 1.4 ≤3 t 1 Antwerp Ecotron 1 1 7 0.3– 2.5 25 1 1 ≤2 t 1
Biosafety: Level 1: washing hands upon entering and exiting the lab; potentially infectious material decontaminated before disposal; lab must have a door which can be locked to limit access.
Level 2: items of level 1 plus: advanced training for personnel and scientists; limited access to the laboratory; extreme precautions to be taken with contaminated items; use of physical containment equipment when aerosols or splashes may occur.
*A higher number of smaller lysimeters can also be used. When available (*) this option is detailed in the Supporting Information file ‘Ecotrons individual descriptions’.
**The volume of the chamber permanently enclosing the canopy above each lysimeter, otherwise indicates the volume of the whole cell. ***The facilities with 0 external air flux works (or can work) in a close system mode while the other facilities work in an open system mode (cf. principles of gas exchange measurements).
F I G U R E 1 Left to right and top to bottom: UHasselt ecotron (Hasselt Belgium), EcoCELLs (Reno USA), Whole Tree Chambers (Richmond Australia), iDiv Ecotron (Leipzig Germany), TUMmesa (München Germany), IleDeFrance ecotron Ecolab (Nemours France), ExpoSCREEN (München Germany), TERRA ecotron (Gembloux Belgium), TerraXcube (Bolzano Italy), and Macrocosms and Mesocosms platforms of the European Montpellier Ecotron (France)
improvements and 60 k€ for the consumables of which electricity, with a consumption around 600 MWh, partly green, constitutes the major part). Personnel annual cost averaged ≈160 k€ (for an average 2 full-time equivalent).
3.1 | Controlled environmental parameters
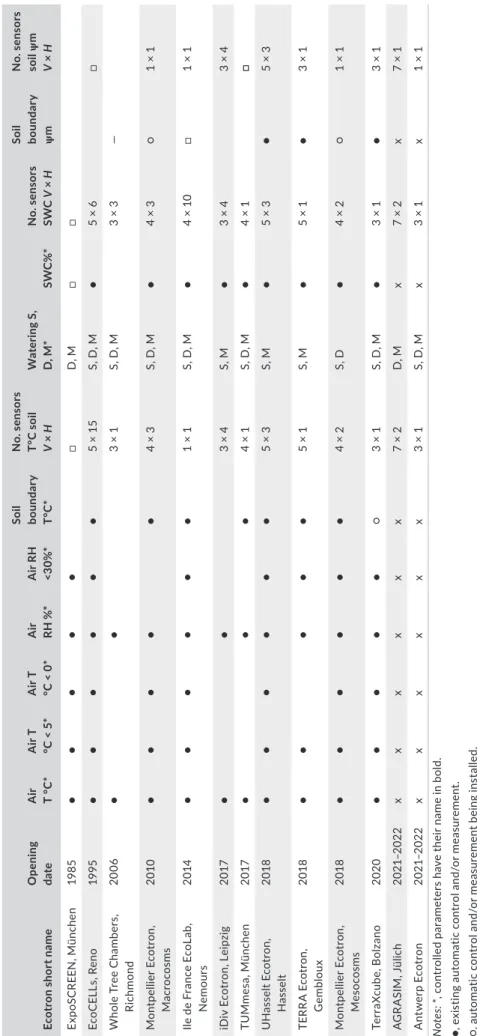
The environmental parameters controlled in these ecotrons are sum-marized in Tables 2A and 2B. Among the climatic conditions, air tem-perature and relative humidity are regulated, as in most CEFs, with low temperature (below 5°C) being achievable in almost all facilities, and freezing temperature and air humidity below 30% attainable in nine out of 13 facilities, thus allowing the simulation of winter cli-matic conditions of most temperate regions when needed. Since light intensity and quality have been a major concern regarding the ex-ternal validity of CEFs, these parameters have been given high pri-ority in ecotron design. High light levels are achieved in the sunlit ecotrons, thanks to high overall transmissivity (≈0.9 on average) of the canopy enclosures. This transmissivity, calculated over 24 h with sensors inside and outside the enclosures, is very high compared to glasshouses. This is due to a high transmissivity of the covering mate-rial, a low inter-cell shading, a dome like shape and very light support-ing structures. In facilities with artificial light, when the ground-lamp distance is adjustable, the photosynthetic photon flux density (PPFD) averaged across ecotrons is 1100 µmol m−2 s−1 at 50 cm from the light sources. Otherwise, when the distance is not adjustable, the PPFD range across ecotrons is 340–1300 µmol m−2 s−1 at 50 cm above the ground level. Maximum PPFD outside can be significantly higher on clear summer days, but while PPFD is the most relevant variable for instantaneous photosynthesis, many plant traits at higher levels of integration are better related to the daily light integral (DLI), the PPFD integrated over a day (Poorter et al., 2019 and references therein). In June, the highest average DLI is 45 mol m−2 day−1 at a latitude of 40°N (Poorter et al., 2019). This can be obtained in ecotrons with only 11.5 h of constant light at a PPFD of 1100 µmol m−2 s−1. In ad-dition, all ecotrons running with artificial lights have dimmable lamps or step switching of the lamps to simulate typical daily light courses. Although Poorter et al. (2016) emphasized the impossibility to reach, in growth chambers, the high photothermal ratio found outside in spring at most latitudes (high light at low temperatures), photother-mal ratios were found to match these field values both in a sunlit ecotron (Montpellier Macrocosms) and in an artificially lit ecotron (Gembloux Terra ecotron), for example on April days with a DLI > 20.
Although rarely documented, light homogeneity across the hori-zontal plane is often also of concern in CEFs due to lamp positions or light interception by greenhouses structures. In the listed ecotrons, the variation coefficient of PPFD is typically below 10%. With ar-tificial light, the vertical extinction profile of light in the canopy is much stronger than in nature due to the quadratic loss of light with increasing distance from the lamps. In tall canopies, supplemental vertical strings of LEDs can compensate for this. Surrounding the sides of the canopy with a vertical shading cloth of adjustable height
and transmissivity is recommended to prevent light and turbulent air from entering the canopy sideways. Aboveground edge effects can be minimized that way, but belowground edge effects are unavoid-able and are only lessened by the large area to circumference ratio of typical ecotron lysimeters. Light quality, which also strongly impacts the external validity of CEF studies, is considerably improved in some artificially lit ecotrons using LED arrays providing a continuous light spectrum close to the solar spectrum with most of the physiolog-ically active wavelength in adequate proportions (although UVB is often still missing). Given the increasing recognition of the impor-tance of UV radiation (Ulm & Jenkins, 2015; Verdaguer et al., 2017), in addition to the red: far red ratio, for the growth and development of plants (Galvão & Fankhauser, 2015) and for some trophic inter-actions (e.g. Moreno et al., 2009), these light quality parameters are reported in Tables 2A and 2B. The average proportion of UV in the UV +PPFD spectrum, calculated from data in µmol m−2 s−1, is 3.8% in the ecotrons with artificial light (range: 0.3–8.6) compared with 6.6% in the standard AM1.5 solar spectrum, and the red: far red ratio is on average 1.7 (range: 1–3.5) compared to 1.1 in the AM1.5 solar spectrum.
Despite relatively high air internal recirculation in most ecotrons (often two to three cell volumes per min), air speed at the canopy level is generally below 2 m s−1. Such values are common over short statured vegetation such as agricultural crops or tree nurseries (mostly between 0.5 and 1 m s−1, and rarely exceeding 3 m s−1; Day & Parkinson, 1979; Barnard & Bauerle, 2016), which are the vegetation types typically studied in ecotrons.
Air CO2 concentration is nowadays controlled in most CEFs and in all the ecotrons, except one. This control is important not only for studies simulating future CO2 concentrations but also to prevent variation in daytime CO2 concentration when plant photosynthesis is active (Bernier et al., 1994; Romer, 2001). The one ecotron lacking routine control of air CO2 concentration overcomes this by a high external air flux to cell air volume ratio. Pre-industrial CO2 concen-trations can be simulated in half the ecotrons by scrubbing the in-coming air with a CO2 removal system. This opens the opportunity to label the organic matter synthesized during the whole experi-ment by continuously injecting CO2 with a specific δ13C signature (depleted or enriched). Ozone concentration is controlled in three ecotrons while NOx is controlled in a single ecotron.
Due to the high content of dissolved nitrogen often found in tap water, all ecotrons, except 3, are using deionized water to simulate rainfall. Two of them have the capacity to add specific ions to the deionized water and two can alternatively use stored rainwater. Dew is generally not observed on the ecotron canopies. Snow cannot be generated within ecotrons, but can be brought in from outside.
3.2 | In-house measured processes in standard
operation mode
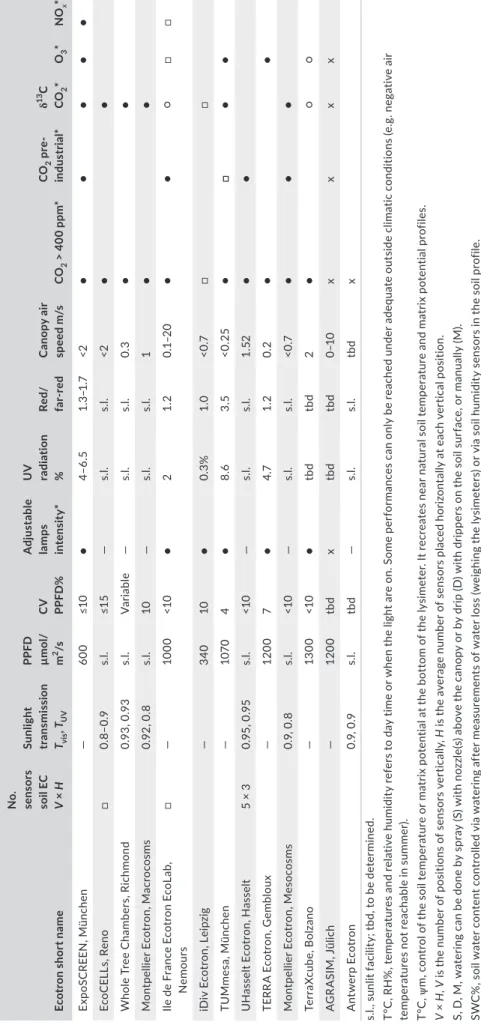
The in-house measured processes in the ecotrons are summarized in Table 3. Overall, 18 different ecosystem processes are assessed,
TA B LE 2 A C on tr ol le d e nv iro nm en ta l p ar am et er s i n e ac h o f t he e co tr on s* Ec ot ro n s ho rt n ame O pe nin g da te A ir T °C* A ir T °C < 5 * A ir T °C < 0 * A ir RH %* A ir R H <3 0%* So il bou nd ar y T° C * N o. s ens or s T° C s oi l V × H W at er in g S , D, M * SW C %* N o. s ens or s SWC V × H So il bou nd ar y ψ m N o. s ens or s so il ψ m V × H Ex po SC RE EN , M ün ch en 19 85 ● ● ● ● ● □ D, M □ □ Ec oC EL Ls , R en o 19 95 ● ● ● ● ● ● 5 × 15 S, D , M ● 5 × 6 □ W ho le T re e C ha m be rs , Rich m on d 20 06 ● ● 3 × 1 S, D , M 3 × 3 — M on tp ellie r E co tr on , M ac ro cos ms 20 10 ● ● ● ● ● 4 × 3 S, D , M ● 4 × 3 ○ 1 × 1 Ile d e F ra nc e E co La b, N em ou rs 20 14 ● ● ● ● ● ● 1 × 1 S, D , M ● 4 × 10 □ 1 × 1 iD iv E co tr on , L ei pz ig 20 17 ● ● 3 × 4 S, M ● 3 × 4 3 × 4 TUM me sa , M ünc hen 20 17 ● ● ● 4 × 1 S, D , M ● 4 × 1 □ U H as se lt E co tr on , H ass elt 20 18 ● ● ● ● ● ● 5 × 3 S, M ● 5 × 3 ● 5 × 3 TE RR A E co tr on , G emb lou x 20 18 ● ● ● ● ● 5 × 1 S, M ● 5 × 1 ● 3 × 1 M on tp ellie r E co tr on , Me so co sm s 20 18 ● ● ● ● ● ● 4 × 2 S, D ● 4 × 2 ○ 1 × 1 Te rr aX cu be , Bo lza no 2020 ● ● ● ● ● ○ 3 × 1 S, D , M ● 3 × 1 ● 3 × 1 A G R A SI M , J ül ich 202 1– 202 2 x x x x x x 7 × 2 D, M x 7 × 2 x 7 × 1 A nt w er p E co tr on 202 1– 202 2 x x x x x x 3 × 1 S, D , M x 3 × 1 x 1 × 1 N ote s: *, c on tr ol le d p ar am et er s h av e t he ir n am e i n b ol d. ●, e xi st in g a ut om at ic c on tr ol a nd /o r m ea su re m en t. ○, a ut om at ic c on tr ol a nd /o r m ea su re m en t b ei ng i ns ta lle d. □, m ea su re m en t/ sa m pl in g d on e m an ua lly a t f re qu en ci es t o b e d et er m in ed ( op tio na l, u po n n eg ot ia tio n) . x, p la nn ed r eg ul at io n a nd m ea su re m en ts ( in f ac ili tie s b ei ng b ui lt) . — , i nd ic at es t ha t t hi s p ar am et er i s n ot r el ev an t ( su nl ig ht t ra ns m is si on f or i nd oo rs f ac ili tie s, a dj us ta bl e l am p i nt en si ty f or s un lit f ac ili tie s) .
TA B LE 2 B Co nti nue d Ec ot ro n s ho rt n ame N o. se ns or s so il EC V × H Su nli gh t tr an sm is si on Tvis , TUV PPF D µ m ol/ m 2 /s C V PPFD% A dj us ta ble la m ps int en si ty * U V radiatio n % Re d/ fa red C an op y a ir sp eed m /s CO 2 > 4 00 p pm * CO 2 p re - in du str ial * δ 13C CO2 * O3 * NO x * Ex po SC RE EN , M ün ch en — 60 0 ≤1 0 ● 4– 6. 5 1. 3– 1. 7 <2 ● ● ● ● ● Ec oC EL Ls , R en o □ 0. 8– 0. 9 s.l. ≤1 5 — s.l. s.l. <2 ● ● W ho le T re e C ha m be rs , R ic hm on d 0.9 3, 0 .9 3 s.l. V ar ia bl e — s.l. s.l. 0. 3 ● ● M on tp el lie r E co tr on , M ac ro co sm s 0. 92 , 0. 8 s.l. 10 — s.l. s.l. 1 ● ● Ile d e F ra nc e E co tr on E co La b, N em ou rs □ — 1000 <1 0 ● 2 1. 2 0. 1– 20 ● ● ○ □ □ iD iv E co tr on , L ei pz ig — 34 0 10 ● 0. 3% 1. 0 <0 .7 □ □ TUM me sa , M ünc hen — 10 70 4 ● 8.6 3. 5 <0 .2 5 ● □ ● ● U H as se lt E co tr on , H as se lt 5 × 3 0.9 5, 0 .9 5 s.l. <1 0 — s.l. s.l. 1. 52 ● ● TE RR A E co tr on , G em bl ou x — 12 00 7 ● 4.7 1. 2 0. 2 ● ● M on tp el lie r E co tr on , M es oc os m s 0. 9, 0. 8 s.l. <1 0 — s.l. s.l. <0 .7 ● ● ● Te rr aX cu be , Bo lza no — 13 00 <1 0 ● tb d tb d 2 ● ○ ○ A G R A SI M , J ül ich — 12 00 tb d x tb d tb d 0– 10 x x x x A nt w er p E co tr on 0.9 , 0 .9 s.l. tb d — s.l. s.l. tb d x s. l., s un lit f ac ili ty ; t bd , t o b e d et er m in ed . T° C , R H % , t em pe ra tu re s a nd r el at iv e h um id ity r ef er s t o d ay t im e o r w he n t he l ig ht a re o n. S om e p er fo rm an ce s c an o nl y b e r ea ch ed u nd er a de qu at e o ut si de c lim at ic c on di tio ns ( e. g. n eg at iv e a ir te m pe ra tu re s n ot r ea ch ab le i n s um m er ). T° C , ψ m , c on tr ol o f t he s oi l t em pe ra tu re o r m at rix p ot en tia l a t t he b ot to m o f t he l ys im et er . I t r ec re at es n ea r n at ur al s oi l t em pe ra tu re a nd m at rix p ot en tia l p ro fil es . V × H , V is t he n um be r o f p os iti on s o f s en so rs v er tic al ly , H is t he a ve ra ge n um be r o f s en so rs p la ce d h or iz on ta lly a t e ac h v er tic al p os iti on . S, D , M , w at er in g c an b e d on e b y s pr ay ( S) w ith n oz zl e( s) a bo ve t he c an op y o r b y d rip ( D ) w ith d rip pe rs o n t he s oi l s ur fa ce , o r m an ua lly ( M ). SW C % , s oi l w at er c on te nt c on tr ol le d v ia w at er in g a ft er m ea su re m en ts o f w at er l os s ( w ei gh in g t he l ys im et er s) o r v ia s oi l h um id ity s en so rs i n t he s oi l p ro fil e. Tvis , TUV , s un l ig ht t ra ns m is si on b y t he c on ta in m en t s tr uc tu re i n t he v is ib le r an ge Tvis a nd i n t he U V r an ge TUV . PP FD , m ax im um p ho to sy nt he tic p ho to n f lu x d en si ty a t 5 0 cm b el ow l am ps w he n s oi l- l am p d is ta nc e i s a dj us ta bl e, o r 5 0 cm a bo ve s oi l l ev el w he n t hi s d is ta nc e i s n ot a dj us ta bl e. C V P PF D , l ig ht h om og en ei ty : v ar ia tio n c oe ff ic ie nt o f P PF D m ea su re d a t s ev er al p oi nt s u ni fo rm ly d is tr ib ut ed o ve r t he c an op y a re a. U V, ( ra tio r ad ia tio n p ho to ns 2 80 – 4 00 n m /r ad ia tio n p ho to ns 2 80 – 7 00 n m ) × 1 00 . T hi s p er ce nt ag e i s 6 .6 f or s ol ar r ad ia tio n ( ba se d o n t he s ta nd ar d s ol ar s pe ct ru m A M 1. 5 e xp re ss ed i n p ho to ns ). re d: fa r r ed r at io r ad ia tio n p ho to ns 6 00 – 7 00 n m /r ad ia tio n p ho to ns 7 00 – 8 00 n m . T hi s p er ce nt ag e i s 1 .1 f or s ol ar r ad ia tio n ( ba se d o n t he s ta nd ar d s ol ar s pe ct ru m A M 1. 5 e xp re ss ed i n p ho to ns ). δ, ( de lta ): r at io o f s ta bl e i so to pe s i n a g iv en m ol ec ul e ( he re 13C/ 12C i n C O2 ) i n r ef er en ce t o a s ta nd ar d ( Pe e D ee B el em ni te ).
TA B L E 3 In-house process measurements done automatically (continuously or at high frequency) as services offered routinely by the facility to its internal or external users or done manually at a frequency to be determined after negotiation. Measurements at scales smaller than the ecosystem (leaf level for example) as well as measurements which are usually done externally on soil plant or air samples are not considered in this table
Ecotron short name
Opening year ET (H2O) NEE (CO2) δ 13C in CO2 Δ 18O in CO2 Soil respiration CH4 emission N2O emission O3 emission ExpoSCREEN, München 1985 ●ge ● ○ ● EcoCELLs, Reno 1995 ● ● □ □ ● □ □
Whole Tree Chambers, Richmond 2006 ●ge ● □ □ ● □ □
Montpellier Ecotron, Macrocosms 2010 ● ● ● ● □ ● ●
Ile de France Ecotron, EcoLab 2014 ● ● ○ ● □ □ ●
iDiv Ecotron, Leipzig 2017 □ □ □
TUMmesa, München 2017 ● □
UHasselt Ecotron, Hasselt 2018 ● ○ ○ ○
TERRA ecotron, Gembloux 2018 ● ● ● ●
Montpellier Ecotron, Mesocosms 2018 ● ● ● ● □ ● ●
TerraXcube, Bolzano 2020 ● ○ □
AGRASIM, Jülich 2021–2022 x x x x x x x
Antwerp Ecotron 2021–2022 x x x x x
Ecotron short name
VOCs fluxes δ15 N, δ18O in N2O δ2H, δ18O in H2O Drainage flux Soil solution sampling ** Root growth *** LAI*** Canopy leaf T °C *** Hyper- spec *** Fauna tracking *** ExpoSCREEN, München □ □ □ EcoCELLs, Reno □ ● □ □ □ □ □
Whole Tree Chambers, Richmond □ □ □ □ □ ● □ □
Montpellier Ecotron, Macrocosms ● □ □ □
Ile de France Ecotron, EcoLab □ □ □ ● ● □ □ □
iDiv Ecotron, Leipzig □ ○ □ □ □ □ □ ○ed,rf
TUMmesa, München ○ □ □ □ □
UHasselt Ecotron, Hasselt ● ●
TERRA ecotron, Gembloux ● □ □ ●st □ □
Montpellier Ecotron, Mesocosms ● □ □ □
TerraXcube, Bolzano ● □ ○ ○ □
AGRASIM, Jülich x x x x x x x
Antwerp Ecotron x x x x
Notes: ●: existing automatic continuous (or at high frequency) measurement provided to the hosted teams.
○:automatic continuous (or at high frequency) measurement being installed; □, measurement/sampling done manually (by the facility staff or by the hosted team), often using available portable devices, at frequencies to be determined (optional, upon negotiation).
ET: evapotranspiration, measured by weighing (●) or by gas exchange (●ge).
NEE:net ecosystem exchange of CO2 (balance between canopy photosynthesis and canopy and soil respiration).
δ: isotopic difference resulting from fractionation within the ecosystem (δ value difference of a given gas before and after going through an
ecosystem in an ecotron unit).
Root growth: measured with minirhizotrons (ingrowth cores measurements are not indicated here since they do not require instrument investment by the facility and are usually done by the hosted team).
LAI: leaf area index (it often gives also canopy transmittance, but this transmittance can also be obtained with simpler light sensors); ●st LAI measured by stereoscopic cameras;
Hyperspec: Canopy hyperspectral reflectance.
Fauna: tracking done by real time detection number and size measurement of catched soil microarthropods (Edapholog system) (○ed) or/and RFID monitoring of beetle movements (○rf).
**Sampling, but no measurements on these samples (measurements often done externally).
***The facilities own the (often portable) equipement to run the raw initial measurements but since finalising results requires a lot of man power and/or very specific skills (i.e. analysis of the roots pictures, parametrization of the hyperspectral models), these final results are often not offered routinely to external users of the facility.
with an average of 10 per ecotron among which five as routine high-frequency measurements. Seven of the 18 processes refer to emitted or absorbed gases at the ecosystem scale. Evaporated and transpired water as well as photosynthesized and respired CO2 are key in understanding and measuring primary productivity. Emphasis is on the three main greenhouse gases (CO2, CH4 and N2O) with six ecotrons capable of measuring their fluxes, enabling calculation of metrics for the global warming potential of ecosystems (Neubauer & Megonigal, 2015). Measurements of the stable isotopes in the CO2, H2O and N2O molecules are being developed. Routine or on-demand measurements of δ13C and δ18O of CO
2 (providing informa-tion on canopy conductance, respirainforma-tion and coupling of cycles) are possible in six and four of the ecotrons, respectively. Measurements of δ15 N, δ18O and the intramolecular SP (isotopomers) of 15N in N2O (providing information on nitrification and denitrification) can be done in four ecotrons, and measurements of δ2H, δ18O of H
2O (providing information on the water cycle) in two ecotrons.
Drainage fluxes and soil solution sampling are provided rou-tinely or on demand in most ecotrons. Minirhizotrons are available in half of the ecotrons, but the root images are usually not analysed by the facility personnel. LAI meters are generally available, and one ecotron is equipped with an automatic stereoscopic measurement of LAI. Canopy temperature infrared measurement can be done in half the ecotrons (two automated at high frequency). Hyperspectral
reflectance measurements are being developed for non-destruc-tive measurement of chemical contents and biomass of canopies. Equipment for such measurements is available in half the ecotrons. Fauna activity is analysed automatically in only one ecotron through cameras and radio frequency identification, in addition to a comput-erized trap system for the activity of soil microarthropods.
4 | TR ACK RECORD OF ECOTRONS
4.1 | Environmental control and process
measurements
Examples of environmental controls achieved in ecotrons are shown in Figure 2. The sunlit ecotron of Hasselt demonstrates the capacity to track the rapidly fluctuating field conditions at the nearby ICOS station. The Gembloux ecotron, operating with artificial (LED) lights, shows the capacity to simulate ranges of light and temperature de-rived from a model using minimum and maximum temperatures and total solar insolation from a weather station, combined with astro-nomical and heat transfer data.
To exemplify the capabilities in terms of isotopic labelling and process measurements, we show the successive measurements in a single experimental unit while 12 units (Montpellier) or 16 units
F I G U R E 2 Examples of ecotron environmental controls: Simulation of outside air relative humidity (a), CO2 concentration (b), soil water tension (c) and air temperature (d) measured at the Maasmechelen, Belgium ICOS station and reproduced in the UHasselt sunlit Ecotron (unpublished data), and simulation of air temperature (e) and photosynthetically active radiation (f) derived from a model and reproduced in the Terra Ecotron Gembloux with artificial lights (unpublished data). Red lines: conditions to be simulated, grey area: range of variation of the parameters across 12 (a–d) or 3 (e, f) experimental units, dark grey line: average for the 12 or 3 units
(München) are labelled or measured simultaneously with single anal-ysers multiplexed across these units (Figure 3).
4.2 | Scientific achievements
A cluster analysis of the published ecotron papers based on the applied experimental treatments reveals three main categories: investigating ecosystem response to abiotic global change drivers (‘novel environments’ experiments sensu Hanson & Walker, 2020) (55% of the papers), deepening our understanding of ecosystem processes (27%) and understanding biodiversity–ecosystem func-tioning relationships (18%; Figure 4a). Since more than half of the ecotrons presented in the current paper have opened too recently to have published results, we included the experimental results
papers from the Silwood Park ecotron to document more broadly the research areas. The Silwood Park data represent 27 of a total of 126 papers analysed in Figure 4a. In addition, we also analysed in the same way the running or recently completed, but not yet pub-lished, experiments in the newly open ecotrons (Figure 4b).
Half of the papers on novel environments analyses the inter-actions between at least two environmental drivers. CO2 and tem-perature were the most studied drivers (61% and 42% of 69 papers, respectively). Among the papers on ecosystem process understand-ing, ecotoxicology is well represented with several papers on mercury circulation in ecosystems published by one ecotron. Plant physiology and elemental cycles are also well represented. Most experiments addressing the role of biodiversity in ecosystem functioning were conducted using grassland ecosystems. Interestingly, manipulations of soil fauna and multi-trophic systems are as represented as plant
F I G U R E 3 Examples of ecotron isotopic labelling and process measurements: Air 13CO
2 enrichment and plant13C labelling in one macrocosm of the Montpellier Ecotron (a); measurements of net ecosystem CO2 exchange (b) and net ecosystem N2O exchange (c) with photosynthetic photon flux density (PPFD) in one macrocosm of the same ecotron; measurements of the emission of two volatile organic compounds (isoprene and methanol) with PPFD in one of the sub-chambers of the München ExpoSCREEN facility (d, e)
F I G U R E 4 Treemap diagrams showing the research areas covered by the ecotrons in the published ecotron papers (left) and in the running or recently completed projects in the newly open ecotrons (right). Blue: experiments designed to better understand specific ecosystem processes; green: global change experiments simulating ‘novel’ future environments; red: biodiversity experiments with manipulations at various trophic levels. Numbers indicate the number of papers/experiments in each sub-category
manipulations. The clustering of the newly completed or running proj-ects in the recently open ecotrons shows an increase in biodiversity experiments, especially related to fauna, as a result of the opening of the German ecotrons. Novel environment experiments are propor-tionally less studied in these recent ecotrons. The list of published papers and recent projects is shown in the Supporting Information file ‘Ecotron published papers and recent projects’.
Below we describe selected experiments showing how the envi-ronmental control and process measurement capacities in ecotrons led to remarkable findings in each of the three main scientific areas of Figure 4.
4.2.1 | Global change experiments
Drake et al. (2018) studied how an extreme heatwave affects the physiological performance of forests. They grew whole Eucalyptus
parramattensis trees (6 m tall) in a field setting with the Richmond
Whole Tree Chambers (WTC), and crossed the heatwave with a warming treatment. The WTC controlled Tair, vapour pressure deficit and CO2 concentration while measuring net CO2 and H2O exchange of the entire canopy every 15 min. Additional measurements were leaf temperature, fluorescence and water potential, and a leaf-level photosynthetic model was used. The heatwave reduced canopy photosynthesis more strongly than transpiration, which maintained canopy cooling. This decoupling is not captured in the standard pho-tosynthetic models and consequently is not considered in climate models, overestimating the negative impact of heatwaves. This re-sult, as well as an observed increase in leaf thermal tolerance dur-ing the heatwave, was identical in both the ambient and warmed treatments. Using similar high-frequency ecosystem gas exchange measurements, Roy et al. (2016) showed in the Montpellier ecotron Macrocosms that elevated CO2 buffered the impact of an extreme drought and heat on intact grassland monoliths, mostly owing to very strong recovery in autumn under this treatment. Also using continuous measurements of CO2 NEE, Arnone III et al. (2008) demonstrated in the Reno EcoCells that the reduction of CO2 up-take in intact tallgrass prairie monoliths by an anomalously warm year was carried over to the next year because soil biota respiration was stimulated. Using real-time measurements of NEE and VOCs, Ghirardo et al. (2020) showed in the München ExpoSCREEN that global warming decreases carbon sequestration in subarctic tundra ecosystems via reducing NEE and increasing VOC emissions. The use of 13CO
2-labeling experiments further allowed coupling the at-mospheric carbon dioxide to VOCs biosynthesis and emissions.
4.2.2 | Biodiversity–ecosystem functioning
experiments
Recent findings of an nearly 75% decline in flying insect biomass over the past 27 years (Hallmann et al., 2017) motivated the investiga-tion of the repercussions of such a decline for ecosystem processes.
Using the 24 experimental EcoUnits of the Leipzig iDiv Ecotron, nine projects investigated how the decline in invertebrate biomass in grassland ecosystems affects the biotic interactions between aboveground (insects, plants and bacteria) and belowground or-ganisms and thus the associated ecosystem functions and services. Artificial grassland communities consisting of 12 central European species were established in the EcoUnits. To mimic invertebrates de-cline, live aboveground invertebrates were introduced at two abun-dance levels (100% and 25%) in eight EcoUnits each while another eight EcoUnits received no fauna. The invertebrate treatment had a large impact on the extent of an accidental aphid infestation which occurred in all 24 EcoUnits. The strongest infestation occurred in the EcoUnits without additional invertebrates and the weakest in the 100%-invertebrate EcoUnits, underlining the importance of natural pest control by predators. Invertebrate densities also shifted plant species abundances and phenology. For example, the dominant spe-cies in the grassland community, Trifolium pratense, declined in abun-dance with invertebrates present (Ulrich et al., 2020).
4.2.3 | Process understanding experiments
In the Macrocosms platform of the Montpellier Ecotron, the effect of circadian rhythm on the diurnal gas exchange of leaves and cano-pies was investigated (Resco de Dios et al., 2017). Such an effect is studied by maintaining all environmental parameters constant (with light or in the dark) after a few days of ‘entrainment’ during which light, temperature and water vapour pressure deficit follow typical outdoor conditions while gas exchange is measured throughout every 12 min. The sunlit macrocosms were planted with either bean or cot-ton. After 1 month of growth, a completely opaque cover was fitted on each macrocosm dome and light was then controlled by dimma-ble plasma lamps. Under these field-like conditions, circadian regula-tion was observed to exert control over net CO2 exchange that was of similar magnitude to the controls exerted by direct physiological responses to temperature and vapour pressure deficit (Resco de Dios et al., 2016, 2017). Circadian rhythm also induced contrasting changes in the photosynthetic pigments and photochemical efficiency in bean vs. cotton, calling into question the extrapolation of the response of model plants to other species (García-Plazaola et al., 2017). Night-time dark respiration showed a circadian oscillation at both leaf and canopy level, but light-enhanced dark respiration was under circadian control only in cotton, suggesting that circadian controls may help explain temporal variability in ecosystem respiration (Gessler et al., 2017).
5 | COMPLEMENTARIT Y BET WEEN
ECOTRON EXPERIMENTS, FIELD
EXPERIMENTS AND IN-NATUR A
OBSERVATIONS
The earlier-mentioned fundamental trade-off between internal and external validity dictates that no single approach can span the