UNCORRECTED PR
OOF
1
The effect of thiamin tetrahydrofurfuryl disulfide on behavior of juvenile DBA/2J mice
2
Judith I. Hills
a,1, Mari S. Golub
b, Lucien Bettendorff
c, Carl L. Keen
a,⁎
3 aDepartment of Nutrition, One Shields Ave., University of CA, Davis, CA 95616, USA4 bBMB/CNPRC, University of CA, Davis, CA 95616, USA
5 cGIGA-Neurosciences, University of Liège, B-4000 Liège Belgium
6 7
a b s t r a c t
a r t i c l e i n f o
8 Article history: 9 Received 11 February 201010 Received in revised form 26 May 2011
11 Accepted 19 July 2011 12 Available online xxxx 13 14 15 16 Keywords: 17 Thiamin 18 Behavior 19 Learning 20 Social 21 Activity
22 Acoustic startle prepulse inhibition
23 Due to genetic defects or illness some individuals require higher amounts of thiamin than are typically
24 provided by the diet. Lipid-soluble thiamin precursors can achieve high blood levels of thiamin and result in
25 increased concentrations in the central nervous system. High intakes of thiamin have been reported as
26 beneficial in children with autism and attention deficit/hyperactivity disorder. The current study examined
27 the effect of thiamin tetrahydrofurfuryl disulfide (TTFD), a lipophilic precursor, on behavior in the juvenile
28 male DBA/2J mouse. Mice given by oral gavage deionized water or deionized water providing 100 mg or
29 340 mg TTFD/kg body weight daily for 17 days, starting at postnatal day 18, were tested for effects on operant
30 learning, social interaction, general activity level, and prepulse inhibition of acoustic startle, as well as effects
31 on growth and select organ weights. Results indicate lower activity and altered social interaction at both
32 treatment levels and decreased acoustic startle at the 100 mg/kg level. Compared to controls, percent weight
33 gain was lower in the TTFD-treatment groups, but percent body length increase was not affected by TTFD
34 treatment. TTFD treatment did not influence percent organ weights as percentage of body weights. TTFD
35 treatment resulted in increased whole brain thiamin concentrations. These results support the concept that
36 lipophilic thiamin precursors provided during early development can affect a number of behavioral
37 parameters. In clinical trials with children with behavior disorders, attention should be given to preventing
38 possible adverse gastrointestinal irritant effects associated with TTFD therapy.
39 © 2011 Published by Elsevier Inc.
40 41 42
43
44 1. Introduction
45 Thiamin, vitamin B-1, has several known functions in the body that 46 have the potential to affect brain activity and behavior. As thiamin 47 diphosphate (ThDP) it serves as a cofactor for enzymes involved in 48 energy metabolism and formation of essential body constituents 49 (McCormick, 2000) as well as the degradation of 3-methyl branched
50
chain fatty acids and 2-hydroxy straight chain fatty acids (Casteels et al., 51 2007). Thiamin triphosphate (ThTP) activates Cl−uptake through maxi
52
chloride channels in excised patches of neuroblastoma cells, is involved
53
in nicotinic receptor clustering at the neuromuscular junction, and has
54
been hypothesized to play a role in brain cell signaling and protection
55
against mitochondrial oxidative stress (reviewed byBettendorff and 56 Wins, 2009). Cell signaling functions have also been proposed for
57
adenosine thiamin triphosphate (AThTP) and adenosine thiamin
58
diphosphate (AThDP) (Frédérich et al., 2009). Other reported or
59
hypothesized functions include regulation of enzyme expression (e.g.,
60
(Pekovich et al., 1998a)); alteration of neuronal membrane ion channels
61
that result in prolonged depolarization responses (Houzen and Kanno, 62 1998; Tallaksen and Tauboll, 2000); maintenance of nerve membrane
63
potentials (Itokawa, 1996); alteration of neurotransmitter release
64
(Yamashita et al., 1993) or uptake (Thomson and Marshall, 2006);
65
and antioxidant activity of unphosphorylated thiamin (reviewed by
66
(Gibson and Blass, 2007)).
67
The signs of thiamin deficiency are protean and manifest differently
68
depending on an individual's age, dietary deficiencies and relative
69
amounts of dietary carbohydrate, disease status, and genetic makeup
70
(Inouye and Katsura, 1965). Cells differ in their ability to uptake thiamin,
71
the amounts that are needed, and regulation of the different forms of
72
thiamin and their compartmentalization (Bettendorff, 1995; Pekovich 73 et al., 1998b). Specialized transporters limit the rate of thiamin uptake
Neurotoxicology and Teratology xxx (2011) xxx–xxx
Abbreviations:ASPPI, acoustic startle prepulse inhibition; AThTP, adenosine thiamin triphosphate; AThDP, adenosine thiamin diphosphate; b.i.d., twice daily; BxD, recombinant cross of C57Bl/6 with DBA/2 mice; HACTV, horizontal locomotor activity beam breaks; dB, decibels; HFHL, high frequency hearing loss; ln, natural log; LnSt, starting body length at postnatal day 18; LRM, localized, non-ambulatory, repetitive movement beam breaks; LSMeans, least squares means; mAChR, muscarinic acetylcholine receptor; MBR, mean baseline response; MSR, mean startle response; nAChR, nicotinic acetylcholine receptor; PctCtr, percent of time in arena center; PctLnChg, percent length change since postnatal day 18; PctWtChg, percent weight change since postnatal day 18; PND, postnatal day; q.i.d., 4 times daily; q.i.d., four times daily; RT, resting time; sqrt, square root; T0, 0 mg thiamin tetrahydrofurfuryl disulfide/kg body wt; T100, 100 mg thiamin tetrahydrofurfuryl disulfide/kg body wt; T340, 340 mg thiamin tetrahydrofurfuryl disulfide/kg body wt; ThDP, thiamin diphosphate; ThMP, thiamin monophosphate; ThTP, thiamin triphosphate; TTFD, thiamin tetrahydrofurfuryl disulfide; Tx, TTFD treatment; VACTV, vertical (rearing) activity beam breaks; WtCur, current body weight; WtSt, starting weight at postnatal day 18.
⁎ Corresponding author. Tel.: +1 530 752 6331; fax: +1 530 752 8966. E-mail addresses:judyhills@gmail.com(J.I. Hills),msgolub@ucdavis.edu
(M.S. Golub),l.bettendorff@ulg.ac.be(L. Bettendorff),clkeen@ucdavis.edu(C.L. Keen).
1Permanent address: 43677 Montgomery Ave., Davis, CA 95618, USA.
NTT-06250; No of Pages 12
0892-0362/$ – see front matter © 2011 Published by Elsevier Inc. doi:10.1016/j.ntt.2011.07.006
Contents lists available atScienceDirect
Neurotoxicology and Teratology
UNCORRECTED PR
OOF
74 (reviewed by (Bettendorff and Wins, 2009)); therefore, conditions75 affecting these transporters can influence thiamin requirements. Thus, 76 in disease states that result in defects of upstream factors, such as 77 enzymes or other proteins that interact with thiamin, a means of 78 bypassing thiamin transport can be of value. Thiamin tetrahydrofurfuryl 79 disulfide (TTFD) can be taken orally and absorbed without need for 80 passage through thiamin transporters (Mitoma, 1973; Suzuoki et al., 81 1968). TTFD has been used clinically in Japan and the U.S. (Lonsdale, 82 2006), and is generally considered safe (Baker and Frank, 1976; 83 Lonsdale, 1987a; Mizutani et al., 1971). The oral LD50 in mice is 84 2200 mg/kg (Anon, 1982).
85 Thiamin or TTFD has shown promise in the treatment of two 86 neurological disorders in children. A pilot human study (Lonsdale et al., 87 2002) investigating treatment of young autistic children with 50 mg 88 b.i.d. by rectal suppository suggested positive results with respect to 89 improvements in behavior, speech, and sleep. A beneficial effect of high-90 dose thiamin was also reported in children with hyperkinesis (Brenner, 91 1982) where 8 of 100 children responded favorably to 100 mg q.i.d.; 4 of 92 the children required supplementation long term, a finding that 93 suggested a genetic basis to their high thiamin requirement. Re-94 searchers (Lonsdale, 1987a, 1982b, 1990, 2006) have reported other 95 multifaceted behavioral and somatic disorders in children that have 96 responded to thiamin or lipophilic thiamin precursor administration. In 97 adults, lipophilic forms of thiamin have been used to treat psychobe-98 havioral inhibition and asthenia, enhance memory in elderly patients, 99 and improve cognitive function and reduce anxiety in university 100 students with severe psychosomatic fatigue (reviewed by (Van Reeth, 101 1999)), as well as a number of other disorders which will be reviewed 102 below inSection 4.4.
103 This present study was undertaken to focus specifically on 104 behavioral effects of pharmacologic doses of thiamin provided via 105 oral TTFD. The test animal was the juvenile male DBA/2J mouse, an 106 inbred strain that has been widely studied and characterized. The 107 possibility that this mouse may have a defect in thiamin utilization 108 has been advanced, though not substantiated (Eudy et al., 2000; 109 Lonsdale, 1982a). This mouse experiences rapid age-related hearing 110 loss (Johnson et al., 2008). TTFD treatment reportedly extends 111 juvenile DBA/2J susceptibility to audiogenic seizures (Lonsdale, 112 1982a), a finding that could indicate a change in the advance of 113 their hearing loss. The present study used juvenile mice in order to 114 simulate effects of supplementation in young children with behavioral 115 disorders.
116 To assess behavioral effects of TTFD, we developed a rapid, 117 sequential test battery including operant learning, social dyadic 118 interaction, monitoring of activity levels over a 24-h period, and 119 prepulse inhibition of acoustic startle. Low response rates in the 120 juvenile mice during the evaluation of operant learning and technical 121 difficulties with the apparatus minimized the ability to draw 122 conclusions from this assessment, thus these data are not presented.
123 2. Methods and materials 124 2.1. Animals and animal care
125 The animal protocol was approved by the UC Davis Animal Care and 126 Use Administrative Advisory Committee. Eighteen-day-old male DBA/2J 127 mice were purchased from Jackson Laboratory West (Sacramento, CA 128 vivarium) in thirteen cohorts that each included 6 to 8 mice randomly 129 distributed among treatment groups (control and TTFD) plus an equal 130 number used as stimulus mice for the social dyadic interaction test. 131 Assignment to treatment group was done upon arrival, using one mouse 132 per litter per treatment group. Treatment groups in each cohort were 133 subdivided into 2 ‘squads’ because of limitations in testing equipment. 134 Treatment groups and squads were balanced for body weight of the 135 mice.
136
All experimental and stimulus mice were caged with littermates
137
until postnatal day (PND) 21, at which time experimental mice were
138
individually caged, whereas stimulus mice were then paired with a
139
non-littermate, with change to a different non-littermate each day
140
until social dyadic testing was completed. This re-pairing of stimulus
141
mice prevented frequent rearing and jumping (escape) behavior seen
142
in preliminary studies when stimulus mice were continuously caged
143
with littermates.
144
Mice were housed under temperature (20–22 °C) and
light-145
controlled (reverse phase, lights on 21:15–09:15) conditions and
146
fed a complete, purified egg white protein based diet (Dyets modified
147
AIN-93G) and deionized water ad lib throughout the study period,
148
except as follows: for experimental mice, food was restricted 4-h prior
149
to the 2-h training session for operant learning and the 2-h operant
150
learning test itself. As is common in nutritional studies, treatments for
151
experimental mice were initiated upon receipt of the mice.
152
From PND 18 to PND 34 experimental mice were given daily oral
153
gavage (at 09:00 for squad 1, at 11:30 for squad 2) with 5 μl fluid/g
154
body weight. Gavage treatments were deionized water (control, T0,
155
n=24), 100 mg TTFD/kg body weight in deionized water (T100,
156
n=23), or 340 mg TTFD/kg body weight in deionized water (T340,
157
n=24). These dosages correspond on a thiamin molar basis to
158
lipophilic forms of thiamin used in previous studies with mice
159
(Lonsdale, 1982a; Micheau et al., 1985).
160
With the exception of the 24-h activity test, the tests were
161
conducted approximately 3-h after gavage, during the first half of the
162
dark cycle, a time mice are naturally active. Mice were transported to
163
and from test locations in a dark, insulated container.
164
Mice used for tissue analysis were divided into the same three
165
treatment groups (n=5–6/group), reared under similar conditions as
166
the mice used for the behavioral work (without behavior testing),
167
provided deionized water and a similar diet (Kwik-Uribe et al., 2000)
168
supplemented with additional thiamin to bring the thiamin content to
169
the same level (5 mg/kg diet) as provided to the experimental mice
170
and as meets the recommended intake level for mice (N.R.C.U.S.S.o.L.A, 171 1995). After 12 days of gavage treatment, the mice were euthanized by
172
CO2inhalation and whole brain was removed for thiamin analysis.
173
2.2. Study design
174
The timeline for the behavioral study is given inTable 1.
175
2.3. Growth and organ weights
176
Experimental mice were weighed daily before gavage, and body
177
length (nose to rump) was determined at the start of the study and
178
before necropsy. Mice were observed at both the start and end of the
179
study to detect any changes in general activity, ambulation, posture,
Table 1 t1:1
Timeline for studya.
t1:2 t1:3 Postnatal day Animal care and testing
t1:4 18 Receive mice. Weigh, measure length, observe, assign to squad
and treatment
t1:5 21 Individually cage experimental mice. Pair cage stimulus mice
with non-littermate.
t1:6 22–28 Re-pair stimulus mice
t1:7 25 Dipper training for operant test
t1:8 26 Operant test
t1:9 27 Social dyadic interaction, session 1
t1:10 28 Social dyadic interaction, session 2
t1:11 29 Test of 24-h activity, squad 1
t1:12 30 Test of 24-h activity, squad 2
t1:13 32 Prepulse inhibition of acoustic startle test
t1:14 34 Weigh, measure length, observe, necropsy for organ weights
a n =24 T0 (control), 23 T100 (100 mg TTFD/kg body weight), 24 T340 (340 mg
UNCORRECTED PR
OOF
180 appearance, or behavior. On PND 34, 3 h after gavage, mice were181 euthanized by CO2 inhalation, and the brain, testes, liver, spleen,
182 kidneys, and heart were rapidly removed and weighed. 183 2.4. Behavior tests
184 2.4.1. Social dyadic interaction test
185 Mice proceeded to this test after completing the operant behavior 186 test, which is not discussed due to procedural difficulties with that 187 test (unpublished data). Social behaviors were studied by pairing each 188 experimental mouse with a DBA/2J stimulus mouse (a mouse of the 189 same age and sex that did not receive gavage treatment with TTFD or 190 water) on two consecutive days. Experimental and stimulus mice 191 were ranked and paired according to weight. Stimulus mice were used 192 once on each of the consecutive test days and were paired with 193 different experimental mice on the two days. Prior to starting the test, 194 the stimulus mouse was marked with a black marker for identification 195 then both mice were placed in separate Plexiglas holding chambers 196 (3.1 cm2) identical to the test chamber and allowed to acclimate for 197 5 min. Following acclimation, both mice were placed in the test chamber 198 at the same time, and videotaped for 10 min under low illumination. The 199 chambers were cleaned before testing each pair of mice.
200 An experienced observer, blinded to the experimental treatment, 201 scored the number and duration of focal (experimental) mouse 202 behaviors using Noldus Observer 5.0 software (Wageningen, the 203 Netherlands) according to categories adapted from Terranova and 204 Laviola (Terranova and Laviola, 2001). Behaviors were grouped into 205 categories that reflected activity level and orientation of activity 206 (toward the stimulus mouse vs. the environment) (Table 2). 207 2.4.2. 24-h activity monitoring
208 Activity monitoring was conducted in an enclosed, automated 209 ‘open field’ (Integra, Accuscan, Columbus, OH) as previously described 210 (Golub et al., 2004), over a 24 h period, with data collected in 3-min 211 time bins. Each mouse was placed in the apparatus chamber (36 cm2, 212 Plexiglass box) containing access to food and water approximately 213 1¾ h prior to the end of the light cycle (which was uniformly set for 214 the same time for each cohort), after being weighed and receiving its 215 gavage treatment. The first 30 min of activity in the arena (data 216 collected and analyzed in ten 3-min time bins) was used to determine 217 adaptation to a novel environment and assess emotionality. For the 218 remainder of the 24-h period, 3-min time bins were synchronized 219 with respect to day/night cycle by using the time stamp on each 3-min 220 time bin. Four hundred fifty one synchronized 3-min time bins 221 (1353 min total) exclusive of the adaptation period were obtained for 222 each mouse and divided into 23 time bins, the first consisting of 33 223 minutes, and the remaining time bins consisting of 1 h each. Means of 224 activities for each time bin were obtained for each mouse. Activity
225
rhythms were also summarized for 75 min (25 3-min time bins)
226
following the beginning of the dark cycle, the time of peak activity.
227
2.4.3. Acoustic startle/prepulse inhibition (ASPPI)
228
This procedure tests the degree to which presentation of a brief low
229
intensity sound (the prepulse) provided 30–500 ms prior to a sudden
230
intense startle-producing sound (the pulse) inhibits the resulting startle
231
reflex. The prepulse normally reduces the startle response and is an
232
operational measure of sensorimotor gating, a process by which an
233
animal filters out extraneous information and protects against sensory
234
overload for (review see (Swerdlow et al., 2008)). Deficits in sensory
235
prepulse inhibition (PPI) are studied with reference to several disorders,
236
including schizophrenia, panic disorder, bipolar disorder, obsessive
237
compulsive disorder, comorbid Tourette syndrome/attention deficit
238
hyperactivity disorder, and Huntington's disease (for review see
239 Swerdlow et al., 2008). In rodents the startle response itself is commonly
240
used to assess emotional reactivity and the effects of anti-anxiety drugs
241
(Bourin et al., 2007; Grillon, 2008; McCaughran et al., 2000). Species and
242
strains within species differ in their regulation of startle and PPI
243
(Swerdlow et al., 2008).
244
A commercial startle reflex system (SR-LAB, San Diego
Instru-245
ments, San Diego, CA), previously described (Berman et al., 2008), was
246
used. The mouse was allowed to acclimate in the dark chamber for
247
5 min before testing commenced. The 10-min test session consisted of
248
50 stimulus trials presented in a pseudo random manner, separated
249
by inter-trial intervals of 5- to 20-s (5 s steps). Testing was divided
250
into 10 blocks, each consisting of five trial combinations: (i) 120-dB,
251
40 ms startle alone, (ii) 120-dB, 40 ms startle preceded by 74-dB
252
prepulse, (iii) 120-dB, 40 ms startle preceded by 82-dB prepulse, (iv)
253
120-dB, 40 ms startle preceded 90-dB prepulse, and (v) no stimulus
254
(background white noise only), as previously described (Berman et 255 al., 2008).
256
2.5. Necropsy and tissue analysis for thiamin and thiamin phosphates
257
Following euthanasia by CO2inhalation, the whole brain (including
258
olfactory bulb and brainstem) was rapidly excised, immediately frozen
259
in liquid nitrogen, and stored at minus 80 °C until extracted and
260
analyzed by HPLC according to published methods (Bettendorff et al., 261 1991). The remaining pellet was dissolved in 2 ml 1 N NaOH in a warm
262
water bath, then analyzed for protein content by the Bradford method
263
(Bradford, 1976) using fatty acid-free bovine serum albumin as the
264
protein standard.
265
2.6. Chemicals
266
Chemical sources were as follows: TTFD from Cardiovascular
267
Research, Ltd (Concord, CA, USA); thiamin, ThMP, ThDP, tricholoroacetic
268
acid (99+%, ACS), and bovine serum albumin from Sigma Aldrich
269
(St. Louis, MO, USA). Diethyl ether and stabilizer-free tetrahydrofuran
270
were from Biosolve (Valkenswaard, The Netherlands). ThTP and AThTP
271
were prepared as previously described (Bettendorff et al., 2003and
272 Frédérich et al., 2009, respectively). Purified water was obtained using a
273
Barnstead NANO-pure system (Van Nuys, CA).
274
2.7. Statistical analysis
275
Analysis of variance (ANOVA) or covariance (ANCOVA) was
276
conducted with SAS 9.2 for Windows (SAS Institute, Inc., Cary, NC)
277
using the Mixed Procedure with Tukey–Kramer post hoc comparisons.
278
Cohort was used as the random effect. For repeated measures over
279
time an auto regressive structure [AR(1)] was used. The group option
280
was included where appropriate to optimize model fit. Differences in
281
all analyses were considered significant at Pb0.05. P values have been
282
rounded to 0.05, 0.01, 0.005, 0.001, 0.0005, or 0.0001, as appropriate.
283
The results of analyses showing significance of TTFD effects are
Table 2 t2:1
Social dyadic interaction: behavior groups used for ANCOVA. t2:2
t2:3 Behavioral group Component behaviors t2:4 Social passive: includes mild-mannered
association with the stimulus mouse
Social inactive, push past, cuddle, social receptive, turn away t2:5 Social active: includes vigorous interaction
with the stimulus mouse
Groom partner, push under, crawl over/under, follow
t2:6 Total active: includes both social active behavior and other vigorous activity directed toward the environment
Groom partner, push under, crawl over/under, follow, explore, jump
t2:7 Other: includes behaviors that were less active or of uncertain intent regarding the stimulus mouse
Approach, social sniff, groom self, rear
Component behaviors were grouped into larger behavioral groups (i.e., social passive, social active, total active, other) that reflected activity level and orientation of activity (toward the stimulus mouse vs. the environment). Analyses were conduced on these behavior groups.
UNCORRECTED PR
OOF
284 presented in tables, along with details of the analyses. Where285 interactions of treatment with covariates occurred, between-group 286 significance of treatment was examined at the 25th, 50th, and 75th 287 percentiles of the covariate.
288 Because mice grow rapidly during the juvenile period, weight was 289 measured at several time points during treatment, and the gain in 290 weight from the pretreatment baseline to necropsy (percent weight 291 change) and growth in length from baseline to necropsy were used as 292 growth endpoints. Organs as percent of body weight were determined 293 for each mouse at necropsy.
294 Lower weight gain (represented as percent weight change in 295 analyses) may be an indicator of generally delayed development that 296 could be reflected in behavior. Because weight gain was found to 297 differ between TTFD treatment groups at early stages of behavioral 298 testing, further analyses were conducted for those behavioral 299 endpoints which showed direct effects of both TTFD and weight 300 gain. These analyses produced a measure of total effect of treatment, 301 derived from path analysis, which takes into account how treatment 302 directly affects behavior as well as how it indirectly affects behavior 303 through its effect on weight gain. Comparison of direct and total 304 effects (not shown) indicated that although some behavioral effects of 305 TTFD occurred partially through effects on weight or weight gain, that 306 component was much smaller than the direct effect.
307 For the social dyadic interaction test, the duration and number of 308 episodes for each behavior group for the two sessions were analyzed 309 by repeated measures ANCOVA, and ANCOVA was also performed on 310 the mean of the two sessions for each behavior. Analysis of episode 311 and duration data yielded similar results; only the duration data 312 group comparisons are presented.
313 For the activity test adaptation period, data were analyzed by 314 repeated measures ANCOVA across ten 3-min time samples. Repeated 315 measures ANCOVA of variables over the 24-h period (time bins 316 synchronized for the light/dark cycle, excluding the adaptation 317 period) was conducted using each subject's means for 23 time bins 318 described inSection 2.4.2. Spline graphs were used to examine the 319 rhythm of several activity measurements during the light→dark 320 transition period. Mean values of these variables for each of the 321 twenty-five 3-min time samples following onset of the dark cycle 322 were plotted using sm50 interpolation and analyzed with polynomial 323 mixed models. When interactions of treatment × sample were 324 significant and the model with those interactions showed better fit 325 than the model without the interactions, treatment was considered to 326 significantly affect the activity pattern.
327 For the acoustic startle prepulse inhibition test, means for baseline 328 (i.e., no stimulus) response, startle response, and startle response 329 following each prepulse level were obtained for each mouse. Acoustic 330 startle prepulse inhibition (ASPPI) was calculated as ((1−(startle-331 following-prepulse/startle-without-prepulse))*100). ANCOVA was 332 performed on mean baseline response, mean startle response, and 333 mean acoustic startle prepulse inhibition using both concurrent 334 weight (a mechanical effect) and percent weight change (a develop-335 mental effect) as covariates. Since preliminary analyses indicated the 336 mechanical effect of current weight showed greater effects than the 337 developmental effect of percent weight change, only the results with 338 the former covariate are presented. Due to a significant effect of 339 treatment on current weight, path analyses were performed, and the total 340 effects of treatment are presented in the table and figures for this test. 341 3. Results
342 3.1. Growth and organ weights (Table 3)
343 A between-group difference in percent weight change was 344 significant by PND 26, the time of the operant test (F2,10.4=4.04,
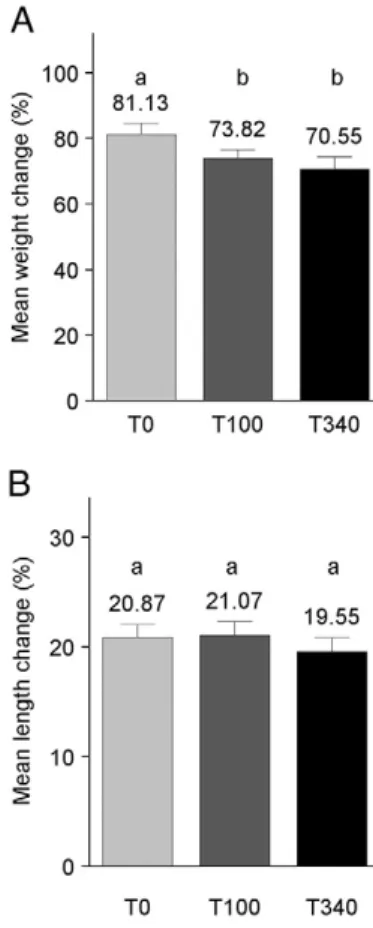
345 P=0.0503, T340bT0, Pb0.05, a 28% decrease). At study end (PND 34), 346 compared to T0 percent weight change of both T100 and T340 mice
347
was lower (Fig. 1A), but growth in length did not differ between
348
treatment groups (Fig. 1B). Greater starting weight (at PND 18) and
349
greater starting length were associated with lower weight gain and
350
lower length gain, respectively. At the time of the acoustic startle
351
prepulse inhibition (ASPPI) test, compared to T0 current weight was
352
less in T100 (Pb0.01) and T340 (Pb0.05) mice. Current weight was
353
also significantly positively associated with starting weight. No
354
significant between-group differences were found in organ weights
355
(brain, liver, spleen, heart, kidneys, testes) when expressed as percent
356
of body weight (analysis data not shown) (Table 3).
357
3.2. Behavior tests
358
3.2.1. Social dyadic interaction test
359
Severe aggressive behavior occurred with two dyads (aggression
360
by a control mouse in one instance and by a T340 mouse in the other
361
instance), preventing observation of other normal behaviors. These
362
two dyads were removed from the analysis (Fig. 2). Q1
363
Repeated measures ANCOVA of data from the two observation
364
sessions (Table 4) showed treatment effects for duration of behavior
365
in the categories Social Passive (T0 less than T340, P=0.01), Social
366
Active (T0 greater than T100 and T340, P b0.01 each), and Total Active
367
(T0 greater than T100 and T340, Pb0.0005 and=0.0001,
respective-368
ly) but not the Other behavior category. ANCOVA of the mean
369
activities from the two sessions also showed significant treatment
370
effects, and the direction of between-group differences was similar
371
(Table 4, Fig. 4). Mean episodes of social passive behavior were
372
significantly lower (13%) in the second test session, indicating
373
adaptation to the test for that behavioral category (data not shown).
Fig. 1. Percent weight change gain (PctWtChg) and percent length change (PctLnChg) (Table 3). Changes in weight and length (nose to rump) between study start and study finish were computed for each mouse. (A) ANCOVA for PctWtChg showed T0N T100 and T340, Pb 0.05 each. (B) ANCOVA for PctLnChg showed no between-group differences. Between-group differences are indicated by a vs. b notation. Error bars represent S.E.M. T0=control (n =19), T100 =100 mg TTFD/kg body weight (n =20), T340 =340 mg TTFD/kg body weight (n =23).
UNCORRECTED PR
OOF
374
3.2.2. Activity monitoring
375
During the first 30 min (adaptation) of the monitoring period,
376
TTFD-treated mice differed from control on three activity variables
377
(Table 5,Fig. 3). Compared to T0, percent time in the arena center was
378
reduced in both the T100 and T340 mice (Fig. 3B); localized repetitive
379
movement was significantly reduced for T340 mice (Fig. 3C); and
380
resting time was increased for both T100 and T340 mice (Fig. 3D).
381
Treatment did not significantly affect horizontal locomotor activity
382
(Fig. 3A). Habituation to the testing environment is indicated by
383
significant time (3-min sample) effects for each behavior. Greater
384
percent weight change (PctWtChg) was overall associated with
385
greater horizontal locomotor activity.
386
For the remainder of the 24-h period that was synchronized for the
387
light/dark cycle (Table 5,Fig. 4), significant treatment effects occurred
Table 3 t3:1
Statistical analysis results for growtha.
t3:2
t3:3 Transformed variable ANCOVAbfixed
effects F test, Pr N F for treatmentand significant covariates t3:4 Ranked WtCur
(at ASPPI test)
Tx|WtSt Tx F2,66=5.82, P=0.0047 t3:5 WtSt F1,66=84.78, P b 0.0001 t3:6 Squared PctWtChg (at necropsy) Tx|WtSt Tx F2,67=4.23, P=0.0186 t3:7 WtSt F1,69=14.67, P =0.0003 t3:8 Ranked PctLnChg (at necropsy) Tx|LnSt|PctWtChg Tx F2,60.9=0.30, P =0.7443 t3:9 LnSt F1,60.1=30.49, P b0.0001
WtCur =current weight, ASPPI test=test for prepulse inhibition of acoustic startle, PctWtChg = percent change in weight from study start to necropsy, PctLnChg = percent change in body length from study start to necropsy, Tx =treatment, WtSt =body weight at study start (PND 18), LnSt=body length (nose to rump) at study start (PND 18), rPctWtChg =residual from regression of percent weight change on treatment.
t3:10 an =19 T0, 20 T100, 23 T340 t3:11
b Vertical bars (|) indicate that significance of all indicated effects and their
interactions was tested; however, as noted, the F test and significance levels are only listed for treatment (whether or not it reached significance) and other effects and interactions that reached significance.
t3:12
Fig. 2. Duration of activity in four behavior categories during social dyadic interaction (Table 4). Behaviors were quantified in two 10-min sessions for each mouse, and means of the two sessions are shown in the figure. ANCOVA of session means showed TTFD-treated groups differed from controls in three behavior categories: Social Passive, T340N T0 (P=0.01); Social Active, T0N T100 and T340 (Pb0.005 and 0.01, respectively); and Total Active T0N T100 and T340 (Pb0.0005 each). Between-group differences are indicated by a vs. b notation. Error bars represent S.E.M. T0=control (n=19), T100=100 mg TTFD/kg body weight (n=20), T340=340 mg TTFD/kg body weight (n=23).
Table 4 t4:1
Statistical analysis results for duration of social dyadic behaviorsa.
t4:2
t4:3 Transformed variable ANCOVAb fixed effects
F test, PrN F for treatment and significant covariates t4:4 Repeated measures
t4:5 Social passive behavior Tx|Session Tx F2,55.4=4.37 P =0.0173
t4:6 sqrt Social active behavior Tx|Session Tx F2,57.3=7.00, P=0.0019
t4:7 sqrt Total active behavior Tx|Session Tx F2,59=12.32, P b 0.0001
t4:8 Other behavior Tx|Session Tx F2,59=0.10, P =0.9065
t4:9 Session means
t4:10 Social passive behavior Tx Tx F2,59=4.50, P =0.0150
t4:11 sqrt Social active behavior Tx Tx F2,59=7.20, P =0.0016
t4:12 sqrt Total active behavior Tx Tx F2,59=12.40, P b 0.0001
t4:13 cubed other behavior Tx Tx F2,59=0.03, P =0.9752
Analyses were conducted on behavior categories using (1) repeated measures on 2 test sessions and (2) the means of the 2 sessions.
t4:14 Tx =treatment.
t4:15 an =19 T0, 20 T100, 23 T340 t4:16
b Vertical bars (|) indicate that significance of all indicated effects and their
interactions was tested; however, as noted, the F test and significance levels are only listed for treatment (whether or not it reached significance). Other effects and interactions did not reach significance.
t4:17
Table 5 t5:1
Statistical analysis results for activity monitoring (adaptation and 24-h light cycle synchronized)a. t5:2 t5:3 Transformed variable ANCOVAbfixed effects
F test, Pr N F for treatment and significant covariates
t5:4 Adaptation activityc
t5:5 sqrt HACTV Tx|3-min sample|
rPctWtChg Tx F2,53.9=1.54, P =0.2228 t5:6 3-min sample F9,318=63.13, P b 0.0001 t5:7 rPctWtChg F1,73.8=7.44, P =0.0080 t5:8 ln PctCtr Tx|3-min sample| rPctWtChg Tx F2,52.6=7.07, P =0.0019 t5:9 3-min sample F9,105=2.46, P =0.013 t5:10 sqrt LRM Tx|3-min sample| rPctWtChg Tx F2,97.3=3.44, P b 0.0361 t5:11 3-min sample F9,462=12.68, P b 0.0001 t5:12 Cubed RT Tx|3-min sample|
rPctWtChg Tx F2,242=146.1, P b 0.0001 t5:13 3-min sample F2,541=12.08, P b 0.0001 t5:14 t5:15 24-h activityc t5:16 sqrt HACTV Tx|Time bin|
rPctWtChg Tx F2,337=3.35, P =0.0363 t5:17 Time bin F22,1212= 85.09, P b 0.0001 t5:18 ranked PctCtr Tx|Time bin|rPctWtChg Tx FP =0.03322,101=3.52, t5:19 Time bin F22,1183= 35.42, P b 0.0001 t5:20 Tx*rPctWtChg F2,101=3.11, P =0.0491 t5:21 sqrt LRM Tx|Time bin| rPctWtChg Tx F2,179=5.90, P =0.0033 t5:22 Time bin F22,1125= 68.83, P =0.0001 t5:23 Tx*Time bin* rPctWtChg F44,1072= 1.45, P =0.0301 t5:24 ranked RT Tx|Time bin|
rPctWtChg Tx F2,868=4.80, P =0.0084 t5:25 Time bin F22,479=231.78, P b 0.0001
HACTV=horizontal locomotor activity beam breaks, PctCtr =percent of time in the arena center, LRM=localized repetitive movement, RT =resting time, Tx=treatment, 3-min sample =time bins in which data were collected for analysis during adaptation, rPctWtChg =residual from regression of percent weight change on treatment, Time bin =composite time samples used for light cycle-synchronized 24-h analysis (see
Section 2.4.2), * =interaction between effects.
t5:26
an =20 T0, 21 T100, 22 T340 t5:27 b Vertical bars (|) indicate that significance of all indicated effects and their
interactions was tested; however, as noted, the F test and significance levels are only listed for treatment (whether or not it reached significance) and other effects and interactions that reached significance. t5:28
c Repeated measures analyses were conducted on behaviors during (1) the 30-min
adaptation period and (2) the remainder of the 24-h period that was synchronized for onset of the dark cycle. t5:29
UNCORRECTED PR
OOF
388 for mean horizontal locomotor activity (Fig. 4A), with T0 greater than 389 T100; for percent time in the arena center (Fig. 4B), with T100 greater 390 than T0 at covariate means; for mean localized repetitive movement 391 (Fig. 4C), with T0 greater than T100; and resting time (Fig. 4D), with 392 T100 greater than T0. In the analysis of percent time in the arena 393 center, the interaction of treatment with rPctWtChg was evidenced by 394 significant between-group effects (T100 greater than T0) at the 25th 395 (P=0.001) and 50th (P b0.05), but not the 75th , percentiles of 396 PctWtChg. Close examination of subset analyses and figures of 397 localized repetitive movement data did not clarify the nature of the 398 3-way interaction (rPctWtChg*Treatment*Time bin*). Significant 399 time bin effects occurred for all activity measurements (Table
Q2 6).
400 During the day→night transition period (Fig. 5A–D, analysis data 401 not shown), significant treatment effects occurred for horizontal 402 locomotor activity, localized repetitive movement, percent time in 403 center, and resting time. The spline plot for resting time shows a more 404 marked decrease and slower rebound for controls compared to TTFD 405 groups, and plots for the other measurements show decreased 406 response amplitude for both TTFD treatment groups and delayed 407 peaks for T100 mice relative to control.
408 3.2.3. Acoustic startle/prepulse inhibition (ASPPI) (Table 7)
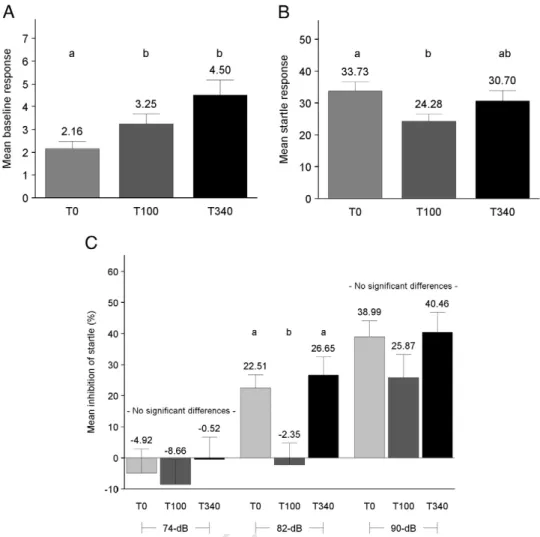
409 Compared to control (T0), mean baseline (no stimulus) response 410 (MBR) was greater for T100 and T340 (Fig. 6A), and greater current 411 body weight (WtCur) was significantly positively associated with 412 MBR. The mean startle response of T100 was lower than that of T0. For 413 the 82-dB prepulse, percent startle inhibition of T100 was lower than 414 that of T0 and T340. The analysis was repeated using mice matched for 415 magnitude of startle response to pulse alone (n=10 per treatment 416 group). These analyses showed no between-group differences in 417 startle inhibition; the lower startle inhibition by the T100 group in the 418 larger data set was due to their lower startle response. Treatment did
419
not affect startle inhibition by the 74-dB or 90 dB prepulses. Although
420
a 3-way interaction (Treatment*rMBR*rWtCur) occurred in the 74-dB
421
analysis, no between-group differences were found at the 25th, 50th,
422
or75th percentile combinations of the covariates.
423
3.3. Brain thiamin and thiamin phosphates
424
TTFD treatment affected whole brain thiamin concentrations
425
(Table 8, Fig. 7). Significantly higher concentrations of thiamin
426
occurred in the T100 and T340 treatment groups compared to the
427
T0 group. No significant differences in brain tissue levels of the
428
phosphorylated thiamin derivatives ThDP or ThMP were observed,
429
and levels of ThTP and AThTP were too low for accurate quantification.
430
4. Discussion
431
4.1. Growth and organ weights
432
TTFD treatment resulted in a reduction in percent body weight
433
gain in both the T100 and T340 groups but there was no change in
434
percent body length gain. The effect on percent weight gain was
435
evident in the T340 group by the time of the first behavioral test. The
436
lower percent weight gain of TTFD-treated mice was not anticipated.
437
A previous study in which 14–16 week-old BALB/c mice were
438
administered 300 mg of the lipophilic thiamin sulbutiamine daily by
439
oral intragastric intubation for 10 d did not report relative changes in
440
body weight (Micheau et al., 1985). Rodents given food supplemented
441
with another lipophilic thiamin precursor, thiamin propyl disulfide,
442
were reported to increase in body weight faster than those receiving
443
water soluble thiamin salts or no thiamin supplement (Shimazono 444 and Katsura, 1965).
Fig. 3. Activity during open field adaptation (Table 5). (A–E) Plots depict mean levels of activities for each 3-min time segment during the first 30-min in the open field chamber. (A) Treatment did not significantly affect horizontal activity horizontal activity (HACTV). Significant treatment effects occurred for (B) percent time in arena center (PctCtr), with T0N T100 and T340 (Pb 0.05 and b0.01, respectively); (C) localized repetitive movements (LRM), with T340 bT0 (Pb 0.05); and (D) resting time (RT), with T0 bT100 and T340 (Pb 0.0005 and Pb0.0001, respectively). Significant time effects occurred for ABCDE, indicating habituation. T0=control (n=20), T100 =100 mg TTFD/kg body weight (n =21), T340 =340 mg TTFD/kg body weight (n =22).
UNCORRECTED PR
OOF
445 Two possible explanations for the lower body weight gain in the 446 TTFD groups are (1) an irritant effect of the treatment on the GI tract, 447 leading to reduced food intake (Lonsdale et al., 2002; Mizutani et al., 448 1972) or (2) a metabolic stimulant effect of TTFD via enhanced 449 noradrenaline secretion and thermogenesis (Oi et al., 1999). TTFD-450 treated mice used for tissue analysis were observed to eat less, as
451
indicated by the frequency with which their food cups required filling,
452
which suggests that decreased food intake, possibly due to an irritant
453
effect of TTFD gavage or decreased appetite, contributed to the lower
454
weight gain observed in these animals.
455
The dosages of TTFD used in this study were selected based on
456
previously published studies with lipophilic thiamin derivatives in
457
mice. However, one of those studies (Micheau et al., 1985) used older
458
mice, whose GI tracts may have been more robust, and a different
459
lipophilic thiamin (sulbutiamine) was used. In the second (Lonsdale 460 et al., 2002), TTFD was administered intraperitoneally. Should gavage
461
delivery of TTFD be causing irritation of the gastrointestinal tract, an
462
alternative method of delivery would need to be considered in future
463
studies. Lower dosages of TTFD could also be considered. TTFD
464
therapy in children (Lonsdale, 1987a, 2006, 2001, 2004; Lonsdale et 465 al., 1982, 2002) used doses lower than those used in the present study.
466
Attention to the route of administration or to buffering agents may be
467
needed in human studies.
468
Treatment resulted in a lower current body weight in both T100
469
and T340 mice at the time of the acoustic startle prepulse inhibition
470
(ASPPI) test. Because current weight can affect the mechanism of
471
startle detection, current weight was used as a covariate in the path
472
analysis model for components of that test.
473
4.2. Behavior tests
474
4.2.1. Social dyadic interaction
475
Control and TTFD-treated mice spent similar amounts of time with
476
the stimulus mouse, but the nature of their social interaction differed.
477
Compared to control, TTFD-treated mice showed more passive
478
(cuddling-type) interaction and less boisterous interaction with the
Fig. 4. 24-h open field activity, with time bins synchronized for the light/dark cycle (Table 6). The arrow indicates placement of mice into the chambers, which was immediately followed by the 30-min adaptation period presented inFig. 3. The last adaptation measurement mean is indicated; the first adaptation measurement mean is indicated when the Y axis for the remaining light synchronized time period permitted. The discontinuity on the X axis represents the variable time elapsed to permit synchronization of the time bins following the adaptation period. The first time bin was 33 min long; the remaining time bins were 1 h long. Behavior means for each mouse were computed for each time bin and used for repeated measures ANCOVA. The figures represent treatment group means derived from individual means. Significant treatment effects occurred for (A) horizontal activity (HACTV) (T0N T100, Pb 0.05), (B) percent time in arena center (PctCtr) (T0 b T100, Pb 0.05 at covariate means), (C) localized repetitive movement (LRM) (T0N T100, Pb 0.005 at covariate means), and (D) resting time (RT) (T0b T100, Pb 0.01). A significant time bin effect occurred for each measurement (Pb 0.0001 each). Interactions of covariates occurred for (B) and (C), as discussed inSection 3.2.2. T0 =control (n =20), T100 =100 mg TTFD/kg body weight (n =21), T340=340 mg TTFD/kg body weight (n =22).
Table 6 t6:1
Statistical analysis results for prepulse inhibition of acoustic startlea.
t6:2
t6:3 Transformed variable
ANCOVAbfixed
effects
F test, Pr N F for treatment and significant covariates t6:4 sqrt MBR Tx|rWtCur Tx F2,66=8.62, P =0.0005 t6:5 rWtCur F1,66=10.27, P =0.0021 t6:6 ln MSR Tx|rWtCur| rMBR Tx F2,67=3.23, P =0.0457 t6:7 74-dB ASPPI Tx|rWtCur| rMBR Tx F2,58=0.34, P =0.7166 t6:8 rMBR*Tx F2,58=3.74, P =0.0298 t6:9 rWtCur*rMBR*Tx F2,58=4.87, P =0.0111 t6:10 82-dB ASPPI Tx|rWtCur| rMBR Tx F2,67=7.23, P =0.0014
t6:11 cubed 90-dB ASPPI Tx|rWtCur| rMBR
Tx F2,52.2=1.41,
P =0.2530
MBR =mean baseline (no stimulus) response, MSR =mean startle response to pulse alone, dB = decibels of sound, ASPPI = acoustic startle prepulse inhibition, Tx =treatment, rWtCur=residual from regression of current weight on treatment, rMBR =residual from regression of mean baseline response on treatment | rWtCur, *=interaction between effects.
t6:12 an =23 T0, 24 T100, 23 T340 t6:13
b Vertical bars (|) indicate that significance of all indicated effects and their
interactions was tested (however, as noted, the F test and significance levels are only listed for treatment (whether or not it reached significance) and other effects and interactions that reached significance.
UNCORRECTED PR
OOF
479 stimulus mouse. Results of the test suggest a dose-related lower total 480 activity level in TTFD-treated mice.
481 Social proximity has previously been observed to be rewarding for 482 the DBA/2J mouse (Moy et al., 2007; Panksepp and Lahvis, 2007). 483 Further study is needed to determine whether the altered social 484 activity observed in the TTFD-treated mice extends to animal models 485 of childhood behavior disorders that are characterized by hyperac-486 tivity and disruptive interactions with peers. It has been suggested 487 that nicotinic acetylcholine receptor (nAChR) function is involved in 488 regulation of social behavior (Granon et al., 2003), and a cholinergic 489 mechanism underlying thiamin effects has been proposed (see 490 Section 4.2.2). Some childhood cases of hyperactivity have responded 491 to high-dose thiamin (Brenner, 1982). Improved behavior has also 492 been reported in autistic children treated with TTFD, but the nature of 493 the improvements was not described (Lonsdale et al., 2002). 494 4.2.2. 24-h activity monitoring
495 Open field testing yielded 3 main findings: (1) activity levels were 496 generally lower in TTFD-treated mice than in controls, (2) different 497 activities were altered in the adaptation period vs. the 24-h period, 498 and (3) during the light-dark transition period TTFD-treated groups 499 showed a dose-related decrease in peak amplitudes of active 500 behaviors and the T100 group showed a delay in active behaviors 501 relative to controls.
502 During the adaptation period, for all treatment groups active 503 behaviors generally decreased over time while resting time increased. 504 Compared to control, the overall higher resting time for both TTFD 505 groups, as well as lower localized repetitive movement for the T340 506 group, suggests decreased activity with TTFD treatment. Locomotor 507 difficulties were not observed in TTFD-treated mice in the social 508 dyadic test, suggesting innate motor deficits probably did not underlie 509 decreased activity. The decrease in percent of time in the arena center 510 for TTFD groups could signify increased anxiety or decreased risk 511 taking, or it may have been a result of overall lower activity. The latter
512
explanation may apply since center time was higher than T0 in the
513
T100 group during the 24-h period. Also, decreased acoustic startle
514
response in T100 compared to T0 mice in the ASPPI test may possibly
515
indicate decreased (rather than increased) anxiety (discussed below).
516
Further behavioral experiments could clarify whether thigmotaxis
517
(reduced center time in the open field) signified increased anxiety vs.
518
decreased risk taking during the adaptation period and whether there
519
were coordination problems that may not have been detected in the
520
current testing regimen (Curzon et al., 2009).
521
The 24-h data again indicate overall lower activity in TTFD-treated
522
mice compared to control, but in different components. Here control
523
mice showed greater horizontal activity than T100 mice (vs. no
524
between-group differences during adaptation); control mice showed
525
greater localized repetitive movement than only T100 (vs. T0 greater
526
than T340 during adaptation); and the average resting time for
527
controls was less than that of the T100 group (vs. T0 less than both
528
T100 and T340 during adaptation). Percent time in the arena center
529
was increased for T100 mice compared to controls (indicating
530
adaptation to that area with longer exposure), a result contrasting
531
to that found in the adaptation period where time in center was
532
greater for controls than for the T100 and T340 groups. Thus, the
533
dosage of TTFD resulted in differing effects on activity during each
534
activity period (adaptation and 24-h), and effects were not always
535
dose related.
536
The mechanism(s) underlying TTFD's effects on activity are
537
unknown, but several lines of evidence suggest that altered
538
cholinergic function could play a role. Previous experimental animal
539
and human studies have proposed that stimulation of cholinergic
540
function by TTFD could underlie its effect on brain function (Lonsdale, 541 1987a, 1987b, 1982a; Micheau et al., 1985; Mimori et al., 1996). In
542
normal human volunteers high-dose thiamin has been reported to
543
counteract hippocampal behavioral deficits induced by the
non-544
selective mAChR antagonist scopolamine (Meador et al., 1993). A
545
number of behavioral deficits seen in thiamin-deficient rodents are
Fig. 5. Open field activity following onset of dark cycle. (A, B, C, D, E) Mean levels of activities were computed for each 3-min interval for 75 min following onset of the dark cycle and are plotted with sm50 interpolation. Polynomial mixed model analysis (explained inSection 2.7) indicated a significant treatment effect for each activity shown, with treatment ×3-min sample significant (P≤0.05) at one or more levels of interaction in each case (data not shown). Active behaviors were decreased in amplitude for both T100 and T340, and were delayed in the T100 group. T0=control (n= 20), T100 =100 mg TTFD/kg body weight (n =21), T340 =340 mg TTFD/kg body weight (n =22).
UNCORRECTED PR
OOF
546 remediated by pro-cholinergic agents (Nakagawasai et al., 2001, 2000, 547 2007, 2004). Thiamin can affect acetylcholine levels by (1) increasing 548 levels of acetylcholine precursors via its cofactor roles in the pyruvate 549 dehydrogenase complex (acetyl Co-A production) and transketolase 550 (NADPH/antioxidant protective effect) (Gibson and Blass, 2007; 551 Gloire et al., 2006; Jones, 2000; McGrane, 2000; Salminen and 552 Kaarniranta, 2010; Sheline and Wei, 2006) and increasing the rate 553 of neuronal high affinity uptake of choline (Micheau et al., 1985), and 554 (2) preventing (via antioxidant protective effects) reduction of nerve 555 growth factor induced transcription of choline acetyltransferase, the 556 enzyme responsible for synthesis of acetylcholine (Toliver-Kinsky et 557 al., 2000). Thiamin may differentially affect acetylcholine receptors; 558 for example, thiochrome, an oxidation product and metabolite of 559 thiamin, enhances the binding and actions of acetylcholine at 560 muscarinic M4 relative to other muscarinic receptors (Lazareno et 561 al., 2004).
Fig. 6. Acoustic startle/prepulse inhibition (Table 7). Behavior means for each mouse were computed for each measurement and used for ANCOVA. The figures represent treatment group means derived from individual means. Significant treatment effects occurred for (A) mean baseline (no stimulus) response (MBR) with only background noise in the acoustic startle apparatus (T0bT100 and T340, Pb 0.05 and Pb 0.0005, respectively); (B) mean startle response to pulse alone (MSR) (T100bT0, Pb0.05); and (C) startle inhibition by the 82-dB prepulse (ASPPI) (T100b T0 and T340, Pb 0.01 each). For the 74-dB and 90-dB prepulses, no significant treatment effect occurred. Between-group differences are indicated by a vs. b notation. Error bars represent S.E.M. T0=control (n=23), T100=100 mg TTFD/kg body weight (n=23), T340=340 mg TTFD/kg body weight (n=23).
Table 7 t7:1
Statistical analysis results for HPLC analysis of whole brain content of thiamin and thiamin phosphate (per mg protein)a.
t7:2
t7:3 Transformed variable ANOVA fixed effect F test, Pr NF for treatment t7:4 1/Thiamin Tx F2,5.62=27.05, P =0.0013
t7:5 ranked ThMP Tx F2,13=0.48, P =0.6317
t7:6 1/cubed ThDP Tx F2,10=0.85, P =0.1383
ThMP=thiamin monophosphate, ThDP=thiamin diphosphate t7:7 an =5 T0, 5 T100, 6 T340
t7:8
Fig. 7. Effect of treatment on the thiamin and thiamin phosphate content of whole mouse brain (Table 8). Tissue analysis showed between-group differences in the level of thiamin (Thi) (T0 bT100, P b0.01; T0b T340, P b 0.001), but no between-group differences in levels of thiamin monophosphate (ThMP) or thiamin diphosphate (ThDP). Levels of thiamin triphosphate (ThTP) and adenosine thiamin triphosphate (AThTP) were too low to quantify accurately. Between-group differences are indicated by a vs. b notation. Error bars represent S.E.M. T0=control (n =5), T100 =100 mg TTFD/kg body weight (n =23), T340 =340 mg TTFD/kg body weight (n =6).
UNCORRECTED PR
OOF
562 Thiamin-related cholinergic enhancement may also be involved in563 regulation of circadian rhythm for reviews see (Datta, 2010; 564 Rosenwasser, 2009; Turner et al., 2010), which could explain 565 differences observed here during the light/dark transition. Subclinical 566 dietary thiamin deficiency altered circadian rhythm in 6 week-old 567 C57BL/6J mice (Bennett and Schwartz, 1999). Studies using other 568 species have shown circadian activity effects of the lipophilic thiamin 569 precursor sulbutiamine (Van Reeth, 1999). Limited human reports 570 suggest effects of thiamin deficiency (Wilkinson et al., 1997) and 571 thiamin augmentation via TTFD (Lonsdale et al., 2002) on sleep. 572 Further study is needed to elucidate the mechanism of the effect of 573 TTFD on activity, sleep, and body rhythms and to determine if 574 lipophilic thiamin precursors might benefit disorders of these 575 functions in humans.
576 4.2.3. Acoustic startle/prepulse inhibition (ASPPI)
577 Although the DBA/2J mouse suffers juvenile-onset high frequency 578 hearing loss (HFHL), previous tests demonstrated that the acoustic 579 startle response is independent of HFHL in juvenile mice when the 580 prepulse is broad-band white noise rather than pure tones (McCaughran 581 et al., 1999). Our test protocol used broad-band noise in 32-d old mice. 582 Our ASPPI study yielded 4 main findings regarding TTFD effects: 583 (1) TTFD produced a dose-related increase in mean baseline response 584 (the no stimulus response during only broad-band background 585 noise); (2) the response to the startle pulse alone was lower for 586 T100 compared to T0 mice; (3) prepulse inhibition with the 82 dB 587 prepulse was reduced for T100 compared to both T0 and T340 mice; 588 and (4) when mice were matched for startle response, no change in 589 82-dB prepulse inhibition was observed.
590 Mean baseline (no stimulus) response increased with increasing 591 current weight over the entire group of mice and also within each 592 treatment group. Yet, despite their lower mean body weights, the 593 T100 and T340 groups showed higher mean baseline response than 594 controls, findings that suggest the increase in mean baseline response 595 was not due primarily to the TTFD effect on weight. A rising baseline 596 response in adult DBA/2 mice has been reported in response to high 597 doses of stimulants (Flood et al., 2010) which was attributed to 598 hyperactivity, such as increased turning behavior in the test cylinders, 599 or finer stereotypic movements. An increased general activity in the 600 startle chamber has also been noted in nicotine withdrawn DBA/2 601 mice (Semenova et al., 2003) which was suggested to reflect increased 602 body tremor or agitation. The accentuated response in the confined 603 environment by TTFD-treated mice contrasted with their decreased 604 activity in the open field test and the social dyadic interaction test. A 605 confined, isolated environment, such as the restraint cylinder used for 606 acoustic startle testing, may solicit unique behaviors. Observation of 607 control and TTFD-treated mice in tightly restrained containers would 608 shed light on what behaviors are involved and whether T100 and 609 T340 mice demonstrate less anxiety-induced freezing behavior. 610 T100, but not T340, mice showed decreased startle response 611 compared to T0 mice, a finding that suggests activation of different 612 neurotransmitter pathways depending on dosage. Pre-clinical thiamin 613 deficiency in rodents has been shown to increase the startle response to 614 electric shock and was correlated with reduced activity of erythrocyte 615 transketolase, an enzyme for which thiamin diphosphate is a cofactor 616 (Peskin et al., 1967). Increased startle response was attributed to 617 neurological hyperexcitability and was thought to correlate with 618 reported observations of increased spontaneous activity in preclinically 619 thiamin-deficient rats. We know of no previous reports of supranormal 620 thiamin intake decreasing auditory startle or startle due to other sensory 621 input, however. In rodents the startle response is commonly used to 622 assess emotional reactivity and the effects of anti-anxiety drugs (Bourin 623 et al., 2007; Grillon, 2008; McCaughran et al., 2000). How TTFD affects 624 various neurotransmitter systems impinging on startle and whether 625 decreased startle in T100 mice indicates an anxiolytic effect at that 626 dosage merits further study.
627
Compared to several other mouse strains, the DBA/2 strain has
628
shown spontaneously low auditory PPI (McCaughran et al., 1997; 629 Paylor and Crawley, 1997) and has been proposed as a model for
630
testing drugs intended for psychiatric conditions that demonstrate PPI
631
deficits (Olivier et al., 2001). Our study showed no improvement in
632
PPI with TTFD treatment. TTFD doesn't appear to offer potential for
633
treatment of disorders with disrupted sensory gating if PPI facilitation
634
is used as the criterion.
635
4.3. Whole brain analysis for thiamin and thiamin phosphates
636
TTFD treatment markedly increased the level of thiamin in whole
637
brain, but had no significant effect on concentrations of ThMP or ThDP.
638
Levels of ThTP and AThTP are extremely low in mice compared to rats
639
(Frédérich et al., 2009), and improved methods of detection are
640
needed.
641
Two recent studies, one in rats (Nozaki et al., 2009) and the other
642
in mice (Pan et al., 2010), also showed elevated levels of thiamin, but
643
not ThMP or ThDP with TTFD treatment. Results (unpublished) in our
644
laboratory suggest that ThDP levels in brainstem (medulla, pons,
645
inferior colliculi) of DBA/2J mice may be marginally increased by TTFD
646
administered via drinking water. Necropsy of a larger number of mice
647
is needed to obtain pooled samples of various brain regions for
648
analysis. Turnover of coenzyme-bound ThDP is slow (Bettendorff et 649 al., 1994), but it is possible that higher intracellular thiamin could
650
increase flux through the rapid turnover pools of ThDP and ThTP
651
without increasing the ThDP level.
652
4.4. Other considerations
653
Through studies in humans, animals, and cell cultures, highly
654
absorbable thiamin precursors have been shown to have beneficial
655
effects via a variety of mechanisms: e.g., on complications of diabetes
656
mellitus (e.g., (Du et al., 2010; Hammes et al., 2003; Karachalias et al., 657 2010)), vascular endothelial dysfunction (Verma et al., 2010), cognitive
658
function (Bizot et al., 2005; Micheau et al., 1985; Mimori et al., 1996; Pan 659 et al., 2010), endotoxin induced uveitis and lipopolysaccharide-induced
660
cytotoxic effect (e.g., (Yadav et al., 2010)), other inflammatory conditions
661
(e.g., (Matsui et al., 1985)), toxicity due to heavy metals and various
662
chemicals (Fujiwara, 1965; Lonsdale et al., 2002; Reddy et al., 2010),
663
alcoholic and nutritional polyneuropathies and myopathies (Djoenaidi et 664 al., 1992; Woelk et al., 1998), dysautonomic symptoms (Lonsdale, 2009),
665
infant brainstem dysfunction and apnea (Lonsdale, 2001), postinfectious
666
asthenia (Shah, 2003), psychobehavioral inhibition occurring during
667
major depression (Loo et al., 2000), and various disorders possibly
668
associated with thiamin dependency that are expressed particularly
669
under conditions of physical or emotional stress (Lonsdale, 1987a, 2006).
670
Thiamin requirements are not only influenced by various disease
671
conditions, as mentioned above, but by individual differences in
672
thiamin utilization. While a few notable examples of genetic disorders
673
influencing thiamin requirements have been well-studied [e.g. Leigh
674
disease and West syndrome, thiamin responsive megaloblastic
675
anemia with diabetes and deafness, and neuropathy and bilateral
676
striatal necrosis with exacerbation during febrile illnesses (Ames et 677 al., 2002; Spiegel et al., 2009), others that produce more subtle
678
behavioral changes or susceptibility to disease may well be awaiting
679
discovery and may underlie case reports of beneficial effects of
680
pharmacologic use of thiamin or its lipophilic derivatives (Lonsdale, 681 2006). Low frequency missense alleles of many different enzymes that
682
result in impaired function are hypothesized to be common and may
683
be nutrient sensitive (Marini et al., 2008). Combinations of nutrients
684
may be required in cases where vitamin function is compromised
685
(Ames et al., 2002). Also, when a pharmacologic dose of a nutrient is
686
used, downstream shifts in metabolic pathways may require
687
adjustment in the dietary intake of other nutrients (Lonsdale, 688 1987a, 1990).