Comparison of modelling approaches to estimate trapping efficiency of
sedimentation basins on peatlands used for peat extraction
Cyril Garneau 1, Sophie Duchesne 1* and André St-Hilaire 1,2
1
INRS-ETE, 490 de la Couronne, Quebec City, G1K 9A9, Canada
2
Canadian River Institute, Fredericton, Canada * corresponding author: [email protected]
Abstract
Peatlands on which there is vacuum peat harvesting must be drained to allow peat extraction. Peat erosion due to mechanical tilling, vacuum harvest and rain can generate large suspended sediment concentrations that must be reduced before reaching the receiving waters. In this study, six sedimentation basins were monitored over one or two ice-free seasons, resulting in seven basin-years time series, to estimate their trapping efficiency. Using these data, two modelling approaches were first applied to predict the seasonal trapping efficiency of the basins, namely the Brown equation and a multilinear regression model (MLR). Secondly, an additional approach based on the hydrodynamic model MOHID was used to compute the trapping efficiency of one of the basins for a single rain event. The Brown equation, used worldwide in agricultural sedimentation pond, proved to be less efficient in predicting the trapping efficiency of the basins (r = 0.67, p = 0.1, leave-one-out RMSE = 47.2%) than a MLR model using the volume of the basin, the surface of the harvested catchment and the Von Post decomposition degree of the peat as
predictors (r = 0.87, p = 0.01, leave-one-out RMSE = 31.6%). The deterministic MOHID model was capable of reproducing high flow suspended sediment concentration at the basin outlet, based on measured settling velocity distribution of the peat through ViCAs protocol, but requires a good description of the settling velocity distribution across multiple hydrological conditions to simulate the suspended sediment concentrations over a full season in order to compute trapping efficiency. The results presented here provide new insights on eroded peat modelling and could lead to better design formulas for basin conception.
Key words
1. Introduction
Peat harvesting is an important industry in Canada. The national harvest is about 1.4 million tons of peat annually (Natural Resources Canada, 2016). In 2014, its economic value was estimated to over 337 million $ in this country, with 17 000 hectares being currently harvested (CSPMA, 2014). Most producers harvest peat using industrial vacuums, which requires that the living vegetation be removed from peatland and that the site be drained to improve drying and allow harvest of the superficial peat layer. The drainage waters are known to carry suspended sediments, both mineral (mostly clays) and organic (peat fiber), coming from surface and ditch erosion (Kløve, 1998; St-Hilaire et al., 2006, Clément et al., 2009; Marttila and Klǿve, 2010). In Canada, best management practices require the installation of sedimentation basins to reduce the impact of suspended sediments on the receiving waters. These basins can be used in conjunction with other mitigation techniques such as constructed wetlands (Klǿve, 2000; Ronkanen and Klǿve, 2008). However, in Canada, few such attempts have been made and stand-alone sedimentation basins remain the most frequently used mitigation technique. The Canadian Council of Ministers of the Environment guidelines for the protection of Aquatic Life suggest that releases of sediments should not raise the Suspended Sediment Concentrations (SSC) of the receiving waters by more than 25 mg/L above natural conditions for short term releases or 5 mg/L for long term releases (Canadian Council of the Ministers of the Environment, 1999). If some studies suggest that a basin of 2500 m3 per km2 of harvested area is capable of removing most of the SS (Thibault, 1998), very limited field measurements are available to assess this design value. Pavey et al. (2007) and Es-Sahli et al. (2013) have monitored
SSC at the outlet of sedimentation basins in harvested peatlands in New Brunswick (Canada). In this province, an absolute SSC guideline exists. Concentrations should remain below 25 mg/L. This threshold was found to be exceeded during or after important rain events and during basin maintenance by both authors. Furthermore, harvested peatlands consist of very small watersheds, ranging from 10 to 100 hectares of bare soil. Such small watersheds are known to react very quickly to rain and to be subjected to intense erosion (Holden and Burt, 2003).
Two strategies are usually deployed to monitor SSC: intensive grab sampling, often with the help of auto-sampler (Marttila and Klǿve, 2008) or deployment of turbidity sensor capable of high frequency monitoring (Samson-Dô and St-Hilaire, 2018; Clément et al., 2009; Es-Salhi et al., 2013; Haahti et al., 2016; Pavey et al., 2007; St-Hilaire et al., 2006). Auto-samplers allow knowing the exact SSC at time of sampling, but require a large number of samples (and the corresponding effort in laboratory analysis) to fully describe SSC variability during events such as floods (Alberto et al., 2016). On the other hand, turbidity sensors are relatively cheap and can monitor the turbidity with minimal maintenance, but need site-specific calibration to convert turbidity to SSC. The turbidity – SSC relationship can show large variability due to the heterogeneity of material (organic and inorganic) and shape of SSC (Marttila et al., 2010; St-Hilaire et al., 2006), but its potential for high frequency data acquisition makes it a method of choice for SSC monitoring.
The efficiency of sedimentation basins has been studied for several decades (e.g. Rebhun and Argaman, 1965), but the emphasis has always been on mineral sediment deposition. The development of tools to configure optimal retention basins requires good knowledge of the characteristics of the SS that are drained to sedimentation basins. This knowledge can be provided by SSC monitoring to update existing tools with peatland specificities. However, many studies pointed out that suspended sediments can be highly heterogeneous and require more than a lumped settling velocity to predict their sedimentation (Bachis et al., 2015; Maruejouls et al., 2012; Vallet et al., 2016). To cope with this complexity, Chebbo and Gromaire (2009) proposed a protocol called ViCAs (Vitesse de Chute en
Assainissement – French for settling velocity in wastewater treatment) to estimate settling
velocity distribution of suspended sediment. This protocol offers an alternative to particle size analysis. Indeed, a particle size distribution can be related to a settling velocity distribution with the help of Stokes’ law and the density of the particles. However, drainage water from harvested peatland contains a combination of organic and mineral loading with very different densities. Furthermore, the Stokes’ assumption that particles are spherical does not hold for peat (Marttila et al., 2010; Marttila and Klǿve, 2008). Therefore, measuring directly the settling velocity distribution of the particles allows better integration of the information to sedimentation models.
Many models exist to predict the efficiency of sedimentation basins (e.g. Curtis and McCuen, 1977; Ward et al. 1979; Tsavardi et al. 2015). Verstraeten and Posen (2000) reviewed various empirical relationships to estimate pond efficiency. Such relationships can take into account as few variables as the reservoir storage capacity and the catchment
area (Brown, 1943) or the reservoir storage capacity and the annual inflow (Brune, 1953). Both Brown and Brune methods provide estimations of the annual retention capacity of the basin. However, the empirical nature of their equations does not describe mechanistic sedimentation processes. Samson-Dô and St-Hilaire (2018) developed adaptations to the Brune–Heinemann (Brune, 1953; Heinemann, 1981) and Brown (1943) models to model the annual trapping efficiency (TE) of eight sedimentation basins on harvested peatlands with different volume/watershed-area ratios. They found that the nature of sediments influenced loads, but not the TE. Camp (1946) was among the first to use the settling velocity of a particle to compute whether or not it would be trapped. From his relation 𝑣𝑣𝑐𝑐 =𝑄𝑄𝐴𝐴 , linking the settling velocity (𝑣𝑣𝑐𝑐), the flow at steady state (𝑄𝑄) and the area of the
settling tank (𝐴𝐴). Many models were proposed to account for unsteady state, turbulence, etc., such as DEPOSIT (Ward et al., 1977) and CSTRS (Wilson and Barfield, 1984). Finally, with the availability of important computational power, it is now possible to consider models not primarily designed for sedimentation. Spatially distributed river hydraulic or hydrodynamic models such as HEC-RAS (Brunner, 2010) or MOHID (Trancoso et al., 2009) were initially developed for water routing by implementing 1D St-Venant equations, then were improved with erosion and sedimentation equations (Trancoso et al., 2009). If a settling tank is narrow enough so that the shallow flow hypothesis behind the St-Venant equations holds, these river models can directly be used as sedimentation models. An advantage of this kind of models is that they can take into account different settling velocities for different types / sizes of sediments, and link these settling velocities
to the physical properties of the sediments, in contrast with simpler empirical models such as those of Brown (1943) or Brune (1953).
The objectives of this paper are 1): to evaluate the performance of two empirical models, the Brown model and a multilinear regression, 2): to compute the annual TE of sedimentation basins on peatlands, and 3) : to propose a deterministic model to improve this computation, using data collected on six sites of harvested peatlands exhibiting contrasting characteristics.
2. Materials and methods 2.1 Study sites
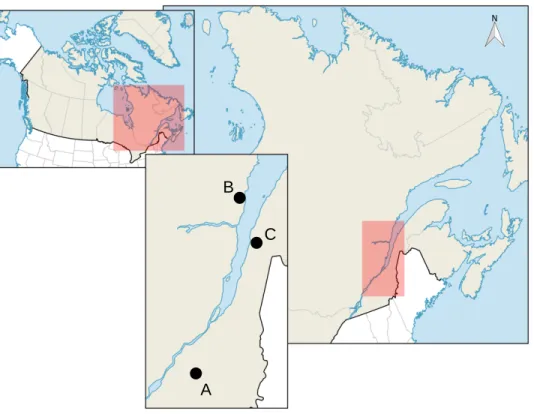
Between one (2013) and six (2015) basins were instrumented during the ice-free season of each year to monitor flow and suspended sediments concentration (SSC), estimated using water level and turbidity respectively. The sites, which characteristics are summarized in Table 1, were located in three regions of the province of Quebec, Canada (Figure 1). The sedimentation basins were all of rectangular geometry, with lengths varying between 32 m and 86 m, widths ranging from 4.6 m to 8 m and depths between 1.05 m and 1.65 m. The total rainfall of Region A was respectively 603 mm, 521 mm and 644 mm for the three ice-free seasons (May 1st to November 1st) of 2013, 2014 and 2016, while it was respectively 480 mm, 598 mm and 465 mm for the same period in Regions B and C, according to the Canadian Weather service (https://weather.gc.ca/). In the drained area, the degree of peat decomposition on the Von Post scale (Ekono, 1981) varied between 2 (almost no
decomposition of the peat fiber) and 9 (well decomposed peat) for the six sites (Table 1). Samson-Do and St-Hilaire (2017) previously estimated that the mean particle sizes of SS entering the studied basins were below 400 μm. No information is available about the SS chemistry for the studied sites, but Wind-Mulder et al. (1996) measured, for peat from similar sites in the same region, pH values varying from 2.7 to 2.9 and a corrected conductivity of 0 μS/cm.
Figure 1. Maps of the different study regions. Regions A (Central Québec) and B (Lower North Shore) had one site each. Region C (Lower St. Lawrence) had four sites.
A B
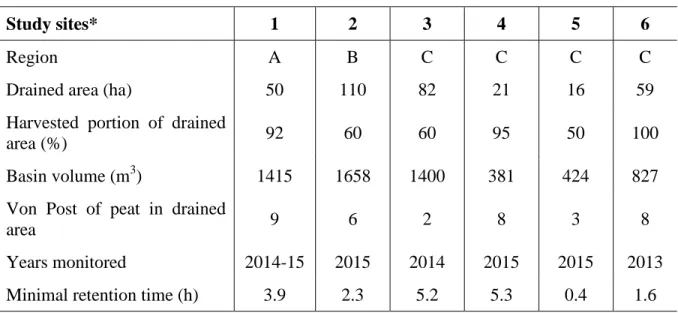
Table 1. Characteristics of the studied retention basins systems
Study sites* 1 2 3 4 5 6
Region A B C C C C
Drained area (ha) 50 110 82 21 16 59
Harvested portion of drained
area (%) 92 60 60 95 50 100
Basin volume (m3) 1415 1658 1400 381 424 827
Von Post of peat in drained
area 9 6 2 8 3 8
Years monitored 2014-15 2015 2014 2015 2015 2013
Minimal retention time (h) 3.9 2.3 5.2 5.3 0.4 1.6 * The basin system 1 comprises three basins in series separated by a culvert (between first and second basins) and a ditch (between second and third basins). The basin system 3 is made of two parallel basins with the same dimensions. The basin systems 5 and 6 are single basins with a geotextile extending over the entire wetted section, in the middle of the basin to decrease velocity and retain sediments. The two last basin systems (2 and 4) are made of one single basin.
The six basins were monitored during one or two ice-free season resulting in an eleven basin-years dataset. However, four basin-years were rejected upfront for experimental reasons. Indeed, basin 2 was monitored in 2014 only from September to November, missing the high flow period following the snow-melt period. Basin 3 in 2015 was impacted by possible development of a biofilm at the downstream monitoring site, thereby increasing the turbidity of the water exiting the basin. Basin 4 in 2014 saw multiple periods
during which beaver dams prevented flow measurement. Basin 5 was dug in 2014 and released high SSC during its first year of operation, prior to bed and banks consolidation.
2.2 Field measurements
The SSC was estimated from the turbidity by a rating curve, at the upstream and downstream ends of each basin. The rating curve was developed by sampling water and sediment from the basin. Then, small increments of sieved sediments (500 µm) were added to the water, which was continuously mixed to ensure proper suspension. At each increment, both the turbidity and a water sample were collected until 10 to 20 turbidity measures and associated grab samples were collected. The calibration followed the procedure of St-Hilaire et al. (2006). Three models of turbidity sensors were deployed at different sites, namely the OBS 3+ (Campbell Scientific), NEP-390 (Analite) and DTS-12 (Forest Technology Systems). Turbidity data were recorded every fifteen minutes with a CR1000 data logger (Campbell Scientific). Rainfall was recorded at each site using a tipping bucket rain gauge (Campbell Scientific TE525WS, Rainwise RAINEW211 or Onset Hobo RG3M). Total rainfall was recorded every 15 minutes on the same data logger.
Water levels were measured by HOBO Water Level loggers upstream and downstream of each basin. Instantaneous water flow was measured with 5 to 20 equidistant water velocity measures taken at 60% of the total depth of the water column with a Marsh McBirney Flo-Mate 2000 flowmeter. The relationship between water level and discharge was estimated with a rating curve based on 6 to 20 flow measurements during every ice-free season.
2.3 Modelling of the efficiency
For each basin-year, the experimental TE of the basins was estimated with Equation 1: 𝑇𝑇𝑇𝑇 =𝑀𝑀𝑖𝑖𝑖𝑖𝑀𝑀− 𝑀𝑀𝑜𝑜𝑜𝑜𝑜𝑜
𝑖𝑖𝑖𝑖
(1 ) where Min = total SS mass entering the basin during the whole season (g), and Mout = total
SS mass leaving the basin during the season (g).
Two empirical models were compared based on their capacity to compute the annual TE computed with the above equation for the seven basin-years, and a deterministic model was applied to compute TE for one basin and one specific rainfall event. The first empirical model is the Brown equation (Brown, 1943), relating the average TE over long periods of time (typically of a year or more) to the ratio of the volume of the basin divided by the catchment area, as shown in Equation 2:
𝑝𝑝𝑝𝑝𝑝𝑝𝑑𝑑𝑇𝑇𝑇𝑇 = 100 �1 − 1
1 + 0.0021𝐷𝐷 𝑉𝑉𝐴𝐴� (2)
where 𝑝𝑝𝑝𝑝𝑝𝑝𝑑𝑑𝑇𝑇𝑇𝑇 is the predicted TE (%), 𝑉𝑉 is the reservoir storage capacity (m3), 𝐴𝐴 is the catchment area (km2) and 𝐷𝐷 is an empirical parameter that ranges from 0.046 to 1 (Verstraeten and Poesen, 2000). The constant 0.0021 allows converting from imperial units (the original formulation) to metric units.
To calibrate the Brown equation, the efficiency of each basin-year was computed based on the observed SSC and flow rates at 15-minute interval over the ice-free season. The value
of 𝐷𝐷 was then estimated by minimizing the root mean square error (RMSE) between the observed TE, 𝑜𝑜𝑜𝑜𝑠𝑠𝑇𝑇𝑇𝑇, and the predicted TE, 𝑝𝑝𝑝𝑝𝑝𝑝𝑑𝑑𝑇𝑇𝑇𝑇 (Equation 3).
𝑅𝑅𝑀𝑀𝑅𝑅𝑇𝑇 = �∑�𝑜𝑜𝑜𝑜𝑠𝑠𝑇𝑇𝑇𝑇𝑖𝑖− 𝑝𝑝𝑝𝑝𝑝𝑝𝑑𝑑𝑇𝑇𝑇𝑇𝑖𝑖�
2
𝑛𝑛 (3)
where 𝑖𝑖 is the ith basin-year and 𝑛𝑛 is the number of basin-years.
The second modelling approach is a multilinear regression model (Equation 4). This statistical model allows computing the predicted TE based on characteristics of the basins and associated peatlands.
𝑝𝑝𝑝𝑝𝑝𝑝𝑑𝑑𝑇𝑇𝑇𝑇 = 𝛽𝛽0+ � �𝛽𝛽𝑗𝑗× 𝑉𝑉𝑗𝑗� 𝑗𝑗𝑚𝑚𝑚𝑚𝑚𝑚
𝑗𝑗=1
(4)
where 𝑝𝑝𝑝𝑝𝑝𝑝𝑑𝑑𝑇𝑇𝑇𝑇 is the predicted TE, 𝑗𝑗𝑚𝑚𝑚𝑚𝑚𝑚 is the number of independent variables, 𝛽𝛽0 to 𝛽𝛽𝑗𝑗𝑚𝑚𝑚𝑚𝑚𝑚 are the parameters of the model, and 𝑉𝑉1 to 𝑉𝑉𝐽𝐽𝑚𝑚𝑚𝑚𝑚𝑚 are the independent variables.
The 𝛽𝛽𝑗𝑗 parameters were estimated by ordinary least square method and the independent variables were selected among the characteristics of each peatland presented in Table 1 based on a correlation analysis. The correlation between the observed and predicted TE was computed to assess the goodness of fit between the observation and simulation.
The third modelling approach uses a mechanistic, distributed hydrodynamic model called MOHID (Trancoso et al., 2009). This model simulates water flow using the complete 1-D St-Venant equations, thus allowing for complex hydrodynamic input flow. The St-Venant
equations require only one parameter, the Manning roughness coefficient, to estimate friction losses at the riverbed. Furthermore, MOHID is specifically designed for intermittent flow, which makes it suitable for very small rivers or drainage ditches that could become dry. Finally, equations for erosion and sedimentation are included in MOHID. These equations take the following form:
𝜕𝜕𝑀𝑀𝑇𝑇 𝜕𝜕𝜕𝜕 = 𝑇𝑇𝐴𝐴 � 𝜏𝜏 𝜏𝜏𝑇𝑇 − 1� 𝑖𝑖𝑖𝑖 𝜏𝜏 > 𝜏𝜏𝑇𝑇 (5) 𝜕𝜕𝑀𝑀𝐷𝐷 𝜕𝜕𝜕𝜕 = 𝐶𝐶𝐴𝐴𝑊𝑊𝑆𝑆�1 − 𝜏𝜏 𝜏𝜏𝐷𝐷� 𝑖𝑖𝑖𝑖 𝜏𝜏 < 𝜏𝜏𝐷𝐷 (6)
where 𝑇𝑇 is an erosion constant (g.m-2.s-1), 𝐴𝐴 is the area of the riverbed (m2), 𝜏𝜏 is the shear stress (Pa) at the riverbed, 𝐶𝐶 is the SSC concentration (g.m-3) and 𝑊𝑊𝑆𝑆 is the settling velocity (m.s-1). The parameters 𝜏𝜏𝑇𝑇 and 𝜏𝜏𝐷𝐷 are the critical shear stress for erosion and deposition (Pa). Therefore, erosion takes place when 𝜏𝜏 > 𝜏𝜏𝑇𝑇 and deposition takes place when 𝜏𝜏 < 𝜏𝜏𝐷𝐷.
All sedimentation basins were modeled in three sections: 1) an inlet channel of width = 0.5 m and length = 40 m, 2) the basin itself with its geometry as measured, and 3) an outlet channel of width = 0.5 m and length = 40 m. The average slope of the channel bed was of 0.001 m/m for all sites and the outlet boundary condition was a constant water height. The upstream boundary conditions were the observed water flow and SSC time series, integrating all the hydrodynamic and erosion/deposition processes occurring on the peatland upstream of the basins.
In the scope of this work, no erosion was allowed in the basins. Therefore, the value of 𝑇𝑇 was set to zero. Similarly, as it was not possible to identify periods without sedimentation, the value of 𝜏𝜏𝐷𝐷 was set to an arbitrarily high value, so that the sedimentation equation could be simplified as shown in Equation 6. Therefore, only the settling velocity needed to be fixed.
𝜕𝜕𝑀𝑀𝐷𝐷
𝜕𝜕𝜕𝜕 = 𝐶𝐶𝐴𝐴𝑊𝑊𝑆𝑆 (7)
To cope with the heterogeneity of the SSC associated with varying peatland and hydrological conditions, the total SS were divided in four classes exhibiting different settling velocities and accounting for different types of SS (coarse, medium, fine and very fine SS). Two different methods were used to determine the value of these four settling velocities. The first method used settling velocities estimated in laboratory with the ViCAs experiments (see details below) for cumulative deposited masses of respectively 12.5, 37.5, 62.5 and 87.5% of the total SS mass. The second method was to calibrate the four settling velocities by minimizing the difference between observed and modeled TE, for each monitored basin-year, assuming that each class represents 25% of the total SSC entering the basin at each time step.
2.4 ViCAs experiments
In addition to the high frequency monitoring of the turbidity, the sedimentation velocity distribution of the SSC was estimated through the ViCAs protocol (Chebbo and Gromaire, 2009) for two sets of samples. The first set consists of synthetic samples for which dry peat was soaked in demineralized water for 24 hours, then sieved with a 500 µm mesh to retain
only the fine particles. Three different decomposition degree (Von Post) of peat fibers were used (Ekono, 1981): 3, 5 and 9, respectively, to cover a large range of possible decomposition levels. The second set of samples was collected in the field during two distinct rainfall events in channels upstream of basins 1 (Von Post of 9) and 5 (Von Post of 3) on August 11, 2015. The first sample was collected at the end of a heavy rain event (70 mm), while the second was collected during a 10 mm rain event. These two samples were not sieved to represent the actual water composition entering the sedimentation basins. Furthermore, no abnormally large particles (consolidated peat, wood chunk, etc.) were observed in the samples, making them representative of field conditions.
3. Results and discussion 3.1 Monitored data
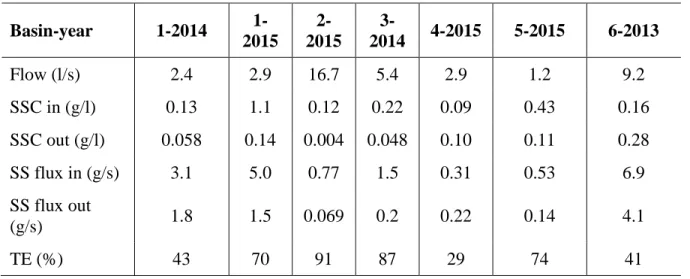
As discussed previously, over the two years of monitoring, seven basin-years provided monitored datasets from which the trapping efficiencies could be calculated. Table 2 shows the average values of observed flow, SSC, suspended sediment fluxes and the TE of the seven basin-years.
Table 2. Characteristics of the seven basin-years used for modelling. Average values are computed on the full time series.
Basin-year 1-2014 1-2015 2-2015 3-2014 4-2015 5-2015 6-2013 Flow (l/s) 2.4 2.9 16.7 5.4 2.9 1.2 9.2 SSC in (g/l) 0.13 1.1 0.12 0.22 0.09 0.43 0.16 SSC out (g/l) 0.058 0.14 0.004 0.048 0.10 0.11 0.28 SS flux in (g/s) 3.1 5.0 0.77 1.5 0.31 0.53 6.9 SS flux out (g/s) 1.8 1.5 0.069 0.2 0.22 0.14 4.1 TE (%) 43 70 91 87 29 74 41
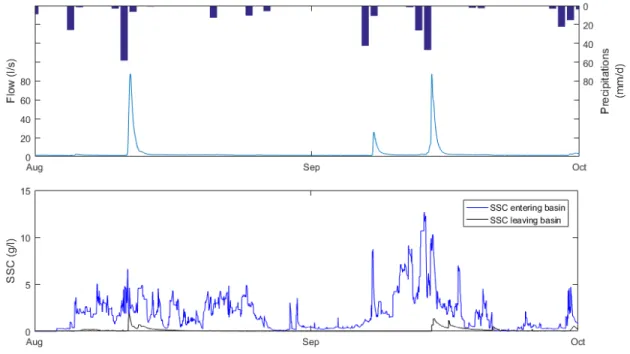
It can be seen from Table 2 that the average flows are low (from 1.2 l/s to 16.7 l/s), although they effectively vary from zero, during very dry periods, to values up to a hundredfold the average flow during the largest rain events. Similarly, the average SSC is highly variable across the basin-years and can also be higher downstream of the basin than upstream. This effect comes from the temporal variability, where large rain events bring high loads of sediment in suspension often in a very short time. In some cases, these suspended sediments reach the drainage ditches and can be released towards the basin over a longer period of low flow. Therefore, it is important to compute the TE on the absolute fluxes (SS flux in and out) over a long period, rather than on the concentrations and on short periods. An example of monitored data (precipitation, flow and SSC) is provided in Figure 2.
Figure 2. Flow and precipitation (upper panel) and SSC input and output (lower panel) for basin-year 1-2015 between August and October 2015.
The site shown in Figure 2 consisted of three basins in series of 45 m, 64 m and 46 m long, respectively, 6 m average width and 1.5 m average depth. Peat at the surface of this drained peatland had a Von Post degree of 9, typical for peatlands that have been harvested for long periods (e.g. decades); this high Von Post explained the very high SSC at the inlet of the basins. The three high flow events represented up to 35% of the total recorded flow and more than 52% of the suspended sediment mass entering the basin.
By dividing the total volume of each basin by their maximum observed flow, the minimum water residence time was estimated to be within 1.2 and 5.3 h across the six sites. It can therefore be hypothesized that any sediment with a settling velocity above 1.2 m/h is very
unlikely to exit the basins, even under the highest observed flows. However, the basins gradually fill during the season, which means that residence times can become lower than those mentioned above, depending on the frequency of basin maintenance.
3.2 Calibration of the Brown equation
Data from the seven basin-years and their associated drainage areas were used to calibrate the Brown equation. Figure 3 shows the efficiency of each basin-year with respect to its V/A ratio. By minimizing the root mean square error between the curve and the data points, the optimal value of D was fixed to 0.27.
A slight influence of the volume of the basin on its TE can be detected on Figure 3. This relation is confirmed by the correlation between the observed and predicted TE, which is relatively low (n = 7, r = 0.67, p = 0.10). The Root Mean Square Error (RMSE) between the observed and computed TE for the Brown model, estimated with a leave-one-out validation, is 47.2%. Many factors can account for this mixed result. The heterogeneity of the SS was identified on two basins, where a large fraction of clay was carried along with peat in drainage waters. Since turbidity is very sensitive to clay and since clay is known to show very low settling velocity (Drever, 1997), basins impacted by clay showed much lower TE. The variable Von Post decomposition level of the harvested peatlands also generates heterogeneity on the SS composition, as was evidenced by the ViCAs experiments. Indeed, the data point which is the furthest from the calibrated curve (V/A = 3370 m3/km2, TE = 0.43; Figure 3) is for a basin collecting highly decomposed peat (Von Post = 9). The Brown equation was applied to many agricultural sedimentation ponds and on peatland sedimentation ponds by Samson-Dô and St-Hilaire (2018). However, the current results show that the TE of sedimentation basins on harvested peatlands cannot be explained only by the basin volume to watershed area ratio and that additional parameters should be considered to provide meaningful prediction of TE.
3.3 Multilinear regression model
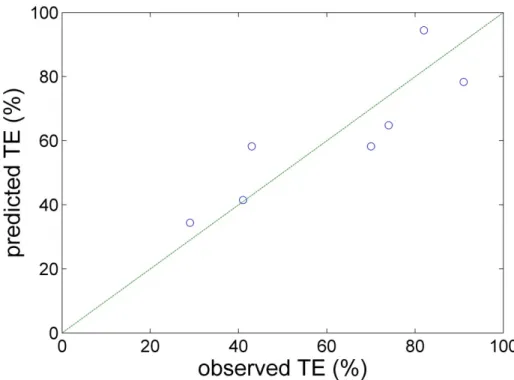
Three variables were used to develop a multilinear regression model explaining the TE of sedimentation basins: the Von Post decomposition level of the surface of the harvested peatland, the volume of the basin (m3) and the drained harvested surface (ha). The model results are presented in Figure 4.
Figure 4. Predicted TE versus observed TE with the multilinear regression model. The line represents the 1:1 bisector.
The three variables were sufficient to achieve a Pearson’s correlation of 0.87 (n = 7, p = 0.01) between the observed and predicted TE. The full model is presented in Equation 6:
𝑝𝑝𝑝𝑝𝑝𝑝𝑑𝑑𝑇𝑇𝑇𝑇 = 0.68 − 0.053 × 𝐷𝐷 + 3.3𝑇𝑇−4× 𝑉𝑉 − 2.0𝑇𝑇−3× 𝐴𝐴 6
where 𝑝𝑝𝑝𝑝𝑝𝑝𝑑𝑑𝑇𝑇𝑇𝑇 is the predicted TE, 𝐷𝐷 is the decomposition degree of the peat on the Von Post scale, 𝑉𝑉 is the volume of the basins (m3) and 𝐴𝐴 is the drained harvested area of the catchment (ha). A leave-one-out validation was performed on the regression and a RMSE of 31.6% was found for the estimated TE.
Although the number of basin-years is insufficient to perform a validation of the model, the correlation between TE and the independent variables in unlikely to be spurious. Indeed, the selected variables are the same as in the Brown equation, with the addition of the decomposition degree of the peat. The known relation between the variables and the TE can therefore offset the black-box nature of the multi-linear regression. Indeed, highly decomposed peat (identified by a high Von Post degree) is characterized by slower settling velocities than lightly decomposed peat, which justifies the negative relation between TE and the Von Post degree. Large basins allow longer residence times, improving the TE. Finally, large catchments generate larger volumes of water, thus reducing the residence time within the basin and the TE.
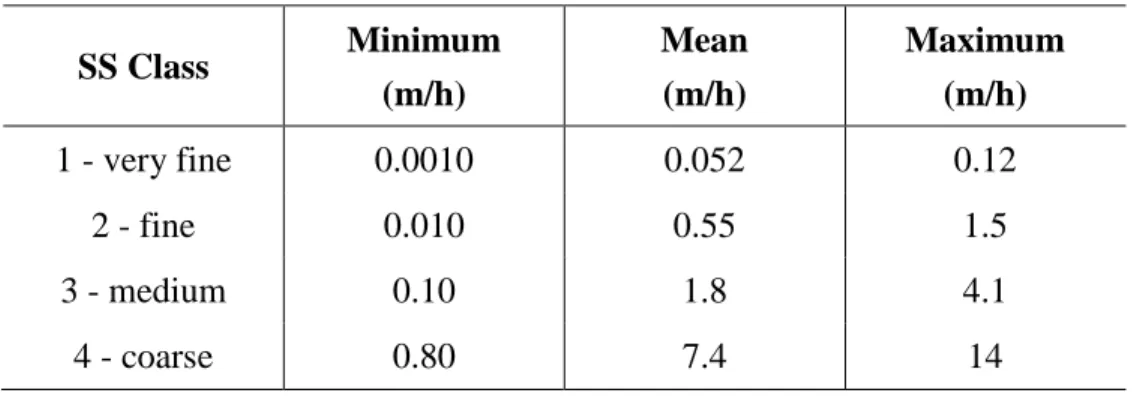
3.4 Estimation of the sedimentation velocity distribution through calibration of the hydrodynamic model MOHID
The MOHID model requires the calibration of the Manning roughness coefficient and the settling velocity of each particle classes. The Manning roughness coefficient was not found to be influential on the TE due to the low water velocity in the basin. Its value was therefore fixed to 0.020 for each basin, based on the literature (Chow et al., 1988). The SSC entering the basin were separated in four classes, each one representing 25% of the total. The settling velocities for these four classes were calibrated for each basin individually. Table 3 presents the key statistics of the settling velocities over all 7 basin-years (minimum, average and maximum settling velocities).
Table 3. Statistics of the settling velocities of the calibrated MOHID models. SS Class Minimum (m/h) Mean (m/h) Maximum (m/h) 1 - very fine 0.0010 0.052 0.12 2 - fine 0.010 0.55 1.5 3 - medium 0.10 1.8 4.1 4 - coarse 0.80 7.4 14
3.5 Estimation of the sedimentation velocity distribution through the ViCAs protocol The results of the ViCAs experiments are shown in Figure 5. Each curve indicates the fraction of suspended solids with a settling velocity less or equal to the indicated settling velocity.
Figure 5. ViCAs experiments results on synthetic samples (A) and samples collected during a rainfall event (B) in basin 1 (B1 – Von Post 9) and basin 5 (B5 – Von Post 3).
The curves indicate the fraction of suspended solids with a settling velocity less or equal to the indicated settling velocity.
10-2 10-1 100 101 102 settling velocity (m/h) 0 0.2 0.4 0.6 0.8 1 cumulative mass of SSC Von Post 3 Von Post 5 Von Post 9 10-2 10-1 100 101 102 settling velocity (m/h) 0 0.2 0.4 0.6 0.8 1 B1 - Von Post 9 B5 - Von Post 3
A B
The ViCAs experiments on the synthetic samples, which were sieved, suggest that the settling velocity of the fine fraction of peat is similar for most levels of peat decomposition. However, if the settling velocity distribution is similar for all three Von Post samples, their erodibility should vary strongly. Indeed, as observed by Tuukkanen et al. (2014) on Finnish peatlands, high Von Post peat, strongly decomposed, generates much more fine sediments than lightly decomposed peat.
The natural samples collected during rainfall events show a different behavior. The less decomposed peat of B5 - Von Post 3 has sedimentation velocities almost ten times higher than the most decomposed peat of B1 - Von Post 9. These two samples were not sieved, which might explain the presence of larger particles in the first sample. A second hypothesis is that the rainfall generating the runoff was much more important for the B1 – Von Post 9 sample (70 mm over the day) than for the B5 – Von Post 3 sample (10 mm over the day), leading to contrasting conditions. Indeed, the drains were flooded at the B1 site and the water was sampled near the surface. Therefore, sedimentation might have occurred before sampling, thus removing the largest particles. Nevertheless, both samples were taken upstream of the basin, and thus represent the SSC entering them.
To analyse the heterogeneity of the SS settling velocities, the SSC were divided in four grain size classes representing 25% of the total SS (0-25; 25-50; 50-75; 75-100). The average settling velocity of each class (corresponding to the settling velocity of a
cumulative mass of 12.5%; 37.5%; 62.5% and 87.5% respectively) is recorded in Table 4. All three synthetic samples and the two field samples are presented.
Table 4. Settling velocity of the different particle classes for all five samples. The settling velocities correspond respectively to 12.5%, 37.5%, 67.5% and 87.5% of the cumulative mass of suspended sediment with a settling velocity below or equal to the presented velocity. Particle class Settling velocity (m/h) Synthetic Von Post 3 Synthetic Von Post 5 Synthetic Von Post 9 Field B1 (Von Post 9) Field B5 (Von Post 3) 1 – very fine 0.14 0.56 0.12 0.03* 0.57 2 – fine 1.34 2.26 1.01 0.10 2.92 3 – medium 3.49 5.26 3.67 0.50 7.81 4 – coarse 10.9 15.13 15.95 2.86 18.81
* the corresponding cumulative mass of suspended sediment was 26%.
These settling velocities, coupled with the minimal residence times observed in the basins (from 1.2 to 5.6 h) suggest that most SS belonging to classes 3 and 4 will settle under typical conditions. SS of classes 1 and 2 are likely to exhibit dynamic behaviour that depends on the local hydrodynamics.
To model the TE of basins, the settling velocities of the field samples should provide better estimates of the SS entering the basins since their characteristics integrate multiple
simultaneous processes such as the erosion of peat, its sedimentation within the ditches and sediment traps and the potential resuspension of previously settled sediment. On the other hand, the synthetic samples provide insight on the settling velocities of the fresh eroded peat, which constitutes useful information to build a model representing the full erosion – sedimentation cycle of the peat from the peatland to the receiving waters.
The seasonal settling velocities obtained by calibration of MOHID (Table 3) are very different from those observed during the ViCAs experiments (Table 4), which suggest that the proportion of the total SSC in each settling velocity class is far from constant during the season. During low flows, there is less erosion in the drainage network. Furthermore, small pools in the drainage ditch network are likely to act as sediment traps, removing SS with high settling velocity. Consequently, the proportion of sediments from each class entering a basin will vary as a function of rainfall and discharge and as a function of operations in the field, such as ditching and harrowing. As the model uses average settling velocities, that stay constant throughout the season, these velocities should not be used to predict the TE for specific events but rather to compute, for example, the overall TE of each basin. For the simulation of specific events, the settling velocities determined from the ViCAs experiments can be used.
3.6 Simulation of TE with MOHID
An example of simulation of the TE with MOHID, for the rainfall event of August 11th, 2015 on basin 1 is provided in this section. Results are given in Figures 7 to 9 and Table 5. For this simulation, the settling velocities measured in the ViCAs experiment B1 – Von
Post 9 (Figure 5-B and 4) were used as initial values for each class. Medium and coarse settling velocities were calibrated from 0.50 m/h to 0.58 m/h and from 2.86 m/h to 2.61 m/h, respectively, to provide better concordance between observed and simulated SSC, and settling velocities for the very fine and fine classes were kept to the values measured from the ViCAs experiment. The observed SSC entering the basin are illustrated in Figure 7, while those exiting the basin and the SSC simulated with MOHID are presented in Figure 8, and Figure 9 shows the simulated accumulated mass of sediment in the basin.
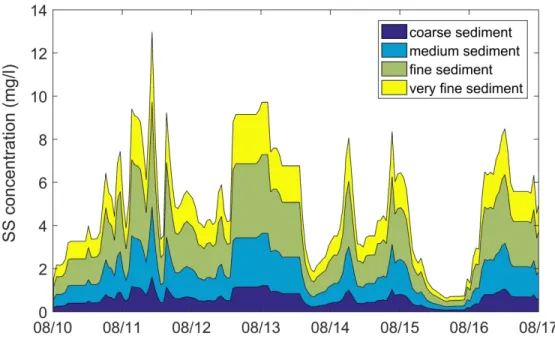
Figure 7. Observed SSC entering basin 1 during the flood of August 11th, 2015. The various colors highlight the contributions of each particle class.
Figure 8. Modelled and observed SSC exiting Basin 1 during the flood of August 11th, 2015. The various colors highlight the contributions of each grain size class.
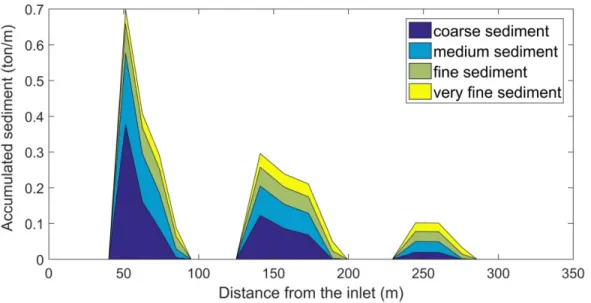
Figure 9. Simulated accumulated sediment in the three basins in series (basin 1) for the event of August 11th, 2015.
Table 5. Simulated trapping efficiency of basin 1 for the event of August 11th, 2015.
Particle class Simulated TE (%) 1 – very fine 58 2 – fine 77 3 – medium 81 4 – coarse 85 Average 75
Results in Table 5 reveal a 75 % average simulated TE for August 11th, 2015, which compares to a 70 % TE computed from the observations. Figure 8 shows that high concentrations of SSC from the fine and very fine classes exit the basin while Figure 9 describes the accumulation of medium and coarse sediments along the basins in series. This result highlights the difficulty of trapping, in standard sedimentation basins, particles belonging to the fine and very fine particles classes, which account for half of the SSC entering the basin. For these particles to be efficiently trapped, control structures increasing the retention time and/or devices increasing the effective settling area (as in inclined plate settlers) should be installed.
4. Conclusion
The TE of sedimentation basins to treat harvested peatland drainage water was monitored on six sites resulting in seven ice-free basin-year time series. The annual TE of these seven basin-years was simulated through two empirical modelling approaches: the Brown equation and a multi-linear regression model. Due to the large diversity of harvested
peatlands monitored and low sample size (7 basin-years), the Brown equation could only provide a limited insight of the TE (r = 0.67, p = 0.1, RMSE = 47.2%). Adding the Von Post degree of decomposition of the eroded peat, in addition to the basin volume and harvested catchment area, in a multilinear regression model was capable of achieving a better correlation between observed and simulated TE (r = 0.87, p = 0.01, RMSE = 23.7%).
It must be noted that both the Brown equation and the multi-linear regression model provide TE estimation at the seasonal scale only. Since most of the erosion happens within a few storm events during each season, a hydrodynamic model, MOHID, was applied to compute TE at the rain-event scale. This model was able to simulate the SSC exiting the basin and the accumulation of sediment in the three sub-basins from each SSC fraction at a sub daily time step. But the question remains how to properly determine the settling velocities of each particle class when using this model. In the scope of this work, it was not possible to estimate the seasonal variation of the settling velocity of the suspended sediments. Nevertheless, the MOHID model, combined with sedimentation equations and a characterisation of settling velocities, was capable of predicting subdaily variations of SSC. This means that, among other things, the use of a hydraulic model such as MOHID for the design of peat sedimentation basins should lead to more refined and proper basin dimensions, in order to reach a specific TE at the rain-event or annual scale. However, series of SSC entering the basins and their settling velocity distributions are required to perform such estimations.
A model predicting both short and long term TE requires a very fine description of SSC entering the basin. This information was not available from turbidity measurements. For this reason, ViCAs experiments were conducted to measure settling velocity distribution curves, from which four particle classes representing 25% of total SSC were defined for the simulations presented in this paper. This hypothesis that the sedimentation classes are constant is likely oversimplifying reality. Indeed, Tuukkanen et al. (2014) measured the shear stress required to erode peat and highlighted that different levels of decomposition could be eroded at different shear stress. But estimating the properties of eroded peat under varying conditions is not a trivial exercise and goes beyond the scope of this work. A solution to this problem could be to work with cumulative mass thresholds instead of a constant proportion in each class. As for example, a model could state that the first X g that would enter a basin for a given rain event would be from class 1, and that the following Y g would be from class 2, and so on. The analyses presented in this paper also showed that about 50% of the SS mass entering some of the basins is composed of particles with very low settling velocities (< 0.01 m/h). This means that, at those sites, a high TE (e.g. > 75%) is unrealistic since it would require huge retention times, and thus enormous basin volumes.
The new insights on peat sedimentation can provide guidance for future research efforts in increasing the TE of peatland sedimentation basins. Future work should focus on:
i) The distribution of SS settling velocities at the inlet of basins, including its variations in time as a function of hydrological conditions,
ii) Methods to model SSC series entering the basin over a season in order to assess TE using a hydrodynamic model like MOHID,
iii) The possibility to use hydraulic simulation models as design tools for retention basins, and
iv) The impact on TE of control structures (e.g. movable gates, flow restrictors) located at the downstream end of the basins.
Finally, it should be mentioned that, apart from the regular operation of retention basins, maintenance activities (i.e. periodic sediment removal from ditches and basins) could also have substantial impacts on sediment delivery to receiving watercourses. These impacts should be studied and innovative methods should be proposed in order to reduce the undesirable effects on natural waters.
Acknowledgements
The authors wish to thank the peat moss producers and the APTHQ (Québec Horticultural Peat Moss Producers Association) for their collaboration, for providing some of the data required for this study and for giving access to their sedimentation basins to the research team. The collaboration of prof. Peter Vanrolleghem from Laval University, who gave access to his laboratory to the research team to perform the ViCAs experiment, and who taught them the ViCAs protocol, is also acknowledged. This work was funded by Mitacs, Acceleration Program #IT05323, by the APTHQ and by the Fonds de Recherche du Québec - Nature et Technologies (FRQNT), Partnership Research Program on the Sustainable Development of the Mining Sector # 2017-MI-201741.
References
Alberto, A., Van den Heuvel, M., St-Hilaire, A., Courtenay S.C., 2016. Monitoring stream sediment loads in response to agriculture in Prince Edward Island, Canada. Environmental Monitoring and Assessment, 188, 415. doi: 10.1007/s10661-016-5411-3.
Bachis, G., Maruejouls, T., Tik, S., Amerlinck, Y., Melcer, H., Nopens, I., Lessard, P., Vanrolleghem, P.A., 2015. Modelling and characterization of primary settlers in view of whole plant and resource recovery modelling. Water Science and Technology, 72, 2251-2261. doi: 10.2166/wst.2015.455.
Brown, C.B., 1943. Discussion of sedimentation in reservoirs. In: Proceedings of the American Society of Civil Engineers, 69, 1493-1500.
Brune, G.M., 1953. Trap efficiency of reservoirs. Transactions of the American Geophysical Union, 34, 407-418.
Brunner, G.W., 2010. HEC-RAS River Analysis System - Users Manual (No. 4.1). Institute for Water Ressources, Hydrologic Engineering Center, Davis, CA.
Camp, T.R., 1946. Sedimentation and the design of settling tanks. Transactions of the American Society of Civil Engineers, 111, 895-936.
Canadian Council of the Ministers of the Environment, 1999. Canadian Environmental Quality Guidelines. Canadian Council of the Ministers of the Environment, Winnipeg, Canada.
Canadian Sphagnum Peat Moss Association, 2014. CSPMA Industry Social Responsibility Report. CSPMA, Alberta, Canada, 39 p.
Chebbo, G., Gromaire, M.-C., 2009. VICAS - An operating protocol to measure the distributions of suspended solid settling velocities within urban drainage samples. Journal of Environmental Engineering, 135, 768-775. doi: 10.1061/(ASCE)0733-9372(2009)135:9(768).
Chow, V., Maidment, D., Mays, L., 1988. Applied Hydrology, 1st ed. McGraw-Hill Series in Water Resources and Environmental Engineering. McGraw-Hill Science/Engineering/Math, New-York, NY.
Clément, M., St-Hilaire, A., Caissie, D., Chiasson, A., Courtenay, S., Hardie, P., 2009. An evaluation of mitigation measures to reduce impacts of peat harvesting on the aquatic habitat of the East Branch Portage River, New Brunswick, Canada. Canadian Water Resources Journal, 34, 441-452. doi: 10.4296/cwrj3404441.
Curtis, D.C, McCuen, R.H., 1977. Design efficiency of stormwater detention basin. ASCE Journal of Water Resources Planning and Management, 103: 125140.
Daigle, J.-Y., Gautreau-Daigle, H., 2001. Canadian Peat Harvesting and the Environment, 2nd ed. Sustaining Wetlands Issues Paper No. 2001-1. North American Wetlands Conservation Council Committee, Ottawa, Canada.
Drever, J.I., 1997. The Geochemistry of Natural Waters: Surface and Groundwater Environments, 3rd ed. Prentice Hall, Upper Saddle River, NJ.
Ekono, I., 1981. Report on Energy Use of Peat. Presented at the Contribution to U.N. Conference on New and Renewable Sources of Energy, Nairobi, Kenya.
Es-Salhi, M.A., Clément, M., St-Hilaire, A., Caissie, D., Courtenay, S.C., 2013. Influence of hydrological conditions and peat extraction operations on suspended sediment concentration and deposition in the East Branch Portage River, New Brunswick
(Canada). Water Quality Resources Journal of Canada, 48, 305-320. doi: 10.2166/wqrjc.2013.061.
Haahti, K., Marttila, H., Warsta, L., Kokkonen, T., Finér, L., Koivusalo, H., 2016. Modeling sediment transport after ditch network maintenance of a forested peatland. Water Resources Research, 52, 9001–9019. doi: 10.1002/2016WR019442. Heinemann, H.G., 1981. A new trapping efficiency curve for small reservoirs. Journal of the American Water Resources Association, 17, 825-830. doi: 10.1111/j.1752-1688.1981.tb01304.x.
Holden, J., Burt, T.P., 2003. Runoff production in blanket peat covered catchments. Water Resources Research 39, 7. doi: 10.1029/2002WR001956.
Kløve, B., 1998. Erosion and sediment delivery from peat mines. Soil and Tillage Research, 45, 1-2, 199-216. doi: 10.1016/S0933-3630(97)00018-4.
Kløve, B., 2000. Retention of suspended solids and sediment bound nutrients from peat harvesting sites with peak runoff control, constructed floodplains and sedimentation ponds. Boreal Environment Research, 5, 81-94.
Marttila, H., Kløve, B., 2008. Erosion and delivery of deposited peat sediment. Water Resources Research, 44, W06406. doi: 10.1029/2007WR006486.
Marttila, H., Postila, H., Kløve, B., 2010. Calibration of turbidity meter and acoustic Doppler velocimetry (Triton-ADV) for sediment types present in drained peatland headwaters: Focus on particulate organic peat. River Research and Applications, 26, 1019-1035. doi: 10.1002/rra.1304.
Marttila, H., Kløve. B., 2010. Dynamics of erosion and suspended sediment transport from drained peatland forestry. Journal of Hydrology, 388, 414-425.
Maruejouls, T., Vanrolleghem, P.A., Pelletier, G., Lessard, P., 2012. A phenomenological retention tank model using settling velocity distributions. Water Resources, 46, 6857-6867. doi: 10.1016/j.watres.2011.11.067.
Pavey, B., St-Hilaire, A., Courtenay, S., Ouarda, T., Bobée, B., 2007. Exploratory study of suspended sediment concentrations downstream of harvested peat bogs. Environmental Monitoring and Assessment, 135, 369-382. doi: 10.1007/s10661-007-9656-8.
Rebhun, M., Argaman, Y. 1965. Evaluation of hydraulic efficiency of sedimentation basins. Journal of the Sanitary Engineering Division, 91, 37-48.
Ronkanen, A.K., Kløve, B. 2008. Hydraulics and flow modelling of water treatment wetlands constructed on peatlands in Northern Finland. Water Research, 42, 3826-3836.
Samson-Dô, M., St-Hilaire, A. 2018. Characterizing and modelling the trapping efficiency of sedimentation basins downstream of harvested peat bog. Canadian Journal of Civil Engineering, 45, 6, 478-788. doi: 10.1139/cjce-2017-0330.
St-Hilaire, A., Courtenay, S.C., Diaz-Delgado, C., Pavey, B., Ouarda, T.B.M.J., Boghen, A., Bobée, B., 2006. Suspended sediment concentrations downstream of a harvested peat bog: Analysis and preliminary modelling of exceedances using logistic regression. Canadian Water Resources Journal, 31, 139-156. doi: 10.4296/cwrj3103139.
Thibault, J., 1998. Guidelines for Peat Mining Operations in New Brunswick (No. Open File 98-7). New Brunswick Department of Natural Resources and Energy. Minerals and Energy Division, Bathurst, NB, Canada.
Trancoso, A.R., Braunschweig, F., Chambel Leitão, P., Obermann, M., Neves, R., 2009. An advanced modelling tool for simulating complex river systems. Science of the Total Environment, 407, 3004-3016. doi: 10.1016/j.scitotenv.2009.01.015.
Tsavdaris, A., Mitchell, S., Davies, W, 2015. Computational fluid dynamics modelling of different detention pond configurations in the interest of sustainable flow regimes and gravity sedimentation potential. Water and Environment, 29, 129-139.
Tuukkanen, T., Marttila, H., Kløve, B., 2014. Effect of soil properties on peat erosion and suspended sediment delivery in drained peatlands. Water Resources Research, 50, 3523-3535. doi: 10.1002/2013WR015206.
Vallet, B., Lessard, P., Vanrolleghem, P.A., 2016. A storm water basin model using settling velocity distribution. Journal of Environmental Engineering and Science, 11, 84-95. doi: 10.1680/jenes.15.00017.
Verstraeten, G., Poesen, J., 2000. Estimating trap efficiency of small reservoirs and ponds: methods and implications for the assessment of sediment yield. Progress in Physical Geography, 24, 219-251. doi: 10.1177/030913330002400204.
Ward, A., Haan, C., Barfield, B., 1977. The performance of sediment detention structures. In: Proceedings of the International Symposium on Urban Hydrology, Hydraulics and Sediment Control, University of Kentucky, 58-68.
Ward, A., Haan, C., Barfield, B., 1979. Prediction of sediment basin performance. Transactions of the ASAE, 22, 0126-0136.
Wilson, B.N., Barfield, B.J., 1984. A sediment detention pond model using CSTRS mixing theory. Transactions of the ASAE, 27, 1339-1344. doi: 10.13031/2013.32968.
Wind-Mulder, H., Rochefort, L., Vitt, D.H., 1996. Water and peat chemistry comparison of natural and post-harvested peatlands across Canada and their relevance to peatland restoration. Ecological Engineering, 7, 161-181.