HAL Id: tel-01680118
https://pastel.archives-ouvertes.fr/tel-01680118
Submitted on 10 Jan 2018HAL is a multi-disciplinary open access archive for the deposit and dissemination of sci-entific research documents, whether they are pub-lished or not. The documents may come from teaching and research institutions in France or abroad, or from public or private research centers.
L’archive ouverte pluridisciplinaire HAL, est destinée au dépôt et à la diffusion de documents scientifiques de niveau recherche, publiés ou non, émanant des établissements d’enseignement et de recherche français ou étrangers, des laboratoires publics ou privés.
Photo-switching of organic monolayers on silicon
surfaces
Stefan Klaes
To cite this version:
Stefan Klaes. Photo-switching of organic monolayers on silicon surfaces. Materials Science [cond-mat.mtrl-sci]. Université Paris Saclay (COmUE), 2017. English. �NNT : 2017SACLX071�. �tel-01680118�
NNT: 2017SACLX071
Thèse présentée pour obtenir le grade de docteur délivré par
l’Université Paris-Saclay
préparée à
l’École Polytechnique
École doctorale No573 : InterfacesSpécialité doctorale “Physique”
ParStefan Klaes
Photo Isomerization of Organic
Photochromes on Silicon Surfaces
Thèse présentée et soutenue à Palaiseau, le 13 octobre 2017
Composition du jury:
François Ozanam PMC, Palaiseau Président
Emmanuelle Lacaze INSP, Paris Rapporteure
Vladimir Khodorkovsky CINaM, Marseille Rapporteur
Rémi Métivier PPSM, Cachan Examinateur
Philippe Allongue PMC, Palaiseau Directeur de thèse
iii
Acknowledgement
This work was performed in the Laboratoire de Physique de la Matière Conden-sée (PMC) at École Polytechnique thanks to a generous funding of LabEx Charmmmat.
I would like to express gratitude the members of the jury. In particular I would like to thank my referees Vladimir Khodorkovsky and Emmanuelle Lacaze who wrote a report including diverse suggestions. I am although grateful to Rémi Métivier and François Ozanam for examining my work and for the exciting discussion, remarks and ideas during the defense.
My deep gratitude goes to Philippe Allongue and Catherine Henry de Villeneuve who supervised this work. Philippe taught me a lot about sci-ence and the importance of scientific communication. I appreciate his rig-orousness as much as his non-conventional humor. I am thankful for all the chemistry that Catherine showed me that was essential for this thesis. I am grateful for her regular help with the surface preparation as well as for her positive and friendly attitude. I am very thankful for the stimulating discussions we had together, often including François, which I will never forget.
sI would like to thank Fouad Maroun for his diverse support and ad-vices about my work in general and nanoparticles in particular; but fur-thermore for his diplomatic critics, too. I am although grateful to Jean-Noel Chazalviel for our discussions about modeling photochromism on surfaces that led to the Monte Carlo simulation.
I would like to thank Karola Rück-Braun for the synthesis of the fulgimide compounds. I wish like to thank Sergii Snegir, Olivier Pluchery from INSP and Thomas Huhn from the University of Konstanz for their cooperation in attaching diarylethene on silicon surfaces that is finally not mentioned in the manuscript.
For the optimization of the experimental setup I have to thank André Wrack and Didier Lenoir for their mechanical and electronic work. In ad-dition, I would like to thank Lucio Martinelli, who taught me a lot about experimental optics and diverse other fields. I wish to thank my intern-ship students Louis Godeffroy (École Normale Supérieure) and Maverick
iv
Chauwin (École Polytechnique) for their motivated participation in this work.
It is a pleasure to work in PMC and therefore I wish to thank many people for the working atmosphere: Anne Marie Dujardin her friendly and diligent help with everything concerning administration, Hongye for spreading a positive mood, Timothy for his friendliness, Brendan for be-ing a chemistry adviser and gambe-ing companion, my runnbe-ing team-mates Marco and Bon-Min, Yann for his mathematical propositions and many others, but naming everyone would clearly go beyond the scope of this acknowledgment.
Furthermore, I have to thank Johannes, Christin and Andres for their discussions and support during the defense. I would like to thank my fam-ily for their backing and everything they did for me. Last but not least, I have especially to thank Morgane for reminding me that science is not everything in life.
v
Contents
Resumé 1 General Introduction 5 Motivation . . . 5 Molecular switches . . . 5 Photochromic molecules . . . 6Photochromism of thin films. . . 9
Photochromism in 2D monolayers . . . 9
Photo-isomerization monitoring . . . 10
Aim and Outline of the present work . . . 11
1 Experimental Details 15 1.1 Introduction . . . 15
1.2 Fulgimides . . . 15
1.3 Preparation and characterization of fulgimide monolayer . . 16
1.3.1 Experimental procedures . . . 16
1.3.2 Qualitative surface composition . . . 19
1.3.3 Quantitative surface composition. . . 21
1.4 Diluted photochromic monolayers . . . 25
1.4.1 Amidation kinetics . . . 26
1.4.2 Procedures. . . 27
1.4.3 Quantitative surface composition. . . 28
1.4.4 Surface topography. . . 30
1.5 Experimental setup and procedures . . . 32
1.5.1 Experimental setup for photo switching on surfaces . 32 1.5.2 Experimental setup for photo switching in solution . 32 1.5.3 Light flux calibration on surfaces and in solution. . . 33
1.5.4 Influence of the light pulse duration . . . 35
2 Photo-Switching Properties of Fulgimides in Solution 39 2.1 Introduction . . . 39
2.2 Results . . . 43
2.2.1 First commutations of as received C fulgimide . . . . 43
2.2.2 Isomeric composition at the photo stationary states . 45 2.2.3 Photo degradation . . . 47
2.2.4 Photoswitching kinetics . . . 48
2.2.5 Isomerization cross section . . . 50
2.2.6 Quantum efficiency. . . 54
2.3 Discussion . . . 56
vi
3 Influence of the Light Polarization on Photo-Switching Properties
of Fulgimide Monolayers 59
3.1 Introduction . . . 59
3.2 Electromagnetic environment in different systems . . . 64
3.3 Methodology of the data analysis . . . 66
3.3.1 Quantitative monitoring of the photo switching . . . 68
3.3.2 Determination characteristic parameters of the photo switching . . . 70
3.4 Results . . . 76
3.4.1 Isomeric composition at the photo stationary states . 76 3.4.2 Photo degradation . . . 77
3.4.3 Isomerization kinetics of successive commutations . 78 3.4.4 Determination of the isomeric composition at the photo stationary states for different surface densities 79 3.4.5 Influence of the fulgimide density on the cross section 80 3.4.6 Light dependence of the photo-switching . . . 81
3.5 Discussion . . . 83
3.5.1 Influence of the surface density on the photo commu-tation . . . 83
3.5.2 Polarization dependent isomerization . . . 84
3.5.3 Isomerization transition dipole . . . 84
3.6 Conclusions . . . 87
4 Influence of Temperature on the Photo Commutation of Fulgimides on Silicon Surfaces 89 4.1 Introduction . . . 89
4.2 Temperature influence on the switching kinetic . . . 90
4.3 Monte Carlo simulations of the photo-switching of fulgimide on surfaces . . . 95
4.3.1 Reaction mechanism for the ring opening reaction . . 95
4.3.2 Methodology . . . 98
4.3.3 Results of the Monte Carlo simulation . . . 102
4.4 Conclusions . . . 106
5 Influence of Gold Nanoparticles on the Photo Commutation of Fulgimide Monolayer on Silicon Surfaces 107 5.1 Introduction . . . 107
5.2 Preparation and characterization of gold nanoparticles monolayers . . . 110
5.2.1 Gold nanoparticles synthesis and characterization . . 110
5.2.2 Surface preparation and characterization . . . 111
5.3 Results . . . 116
5.3.1 Infrared sensitivity . . . 116
5.3.2 Qualitative kinetics . . . 117
5.3.3 Kinetic parameters of the ring closing reaction . . . . 119
5.3.4 Kinetic parameters of the ring opening reaction . . . 120
5.4 Discussion . . . 125
5.4.1 Influence of the AuNP on the photo commutation . . 125
5.4.2 Dielectric environment of AuNP on Silicon . . . 125
5.4.3 Influence electric field enhancement on the photo commutation . . . 130
vii
5.5 Conclusions . . . 135
General Conclusion 137 A Supplementary Information for Chapter 1 141 A.1 Basic principle . . . 141
A.2 Quantitative analysis . . . 142
B Supplementary Information for Chapter 3 147 B.1 Disappearance of impurities during successive commutations 147 B.2 Inert atmosphere FTIR-cell . . . 148
B.3 Analytical models for the switching kinetics. . . 149
B.4 Polarized switching . . . 151
B.5 Perpendicular illumination with and without polarizer . . . 152
C Supplementary Information for Chapter 4 153 C.1 Temperature dependent setup . . . 153
C.2 Temperature calibration . . . 154
C.3 Determination of the temperature before illumination . . . . 155
C.4 Temperature during the irradiation . . . 156
C.5 Experimental procedure for temperature dependent mea-surements . . . 158
C.6 Differential equation for the ring opening reaction . . . 159
C.7 Numerical solution of the differential equation . . . 160
C.8 Monte Carlo simulations with different parameter . . . 162
D Supplementary Information for Chapter 5 165 D.1 Influence of separate plasmon excitation on the photo com-mutation . . . 165
D.2 Temperature influence during the photo commutation. . . . 168
ix
List of Figures
1 Operation principle of a molecular switch . . . 6
2 Examples of photochromes . . . 7
3 Schematic photo isomerization for azobenzene . . . 8
4 Schematized photochromism of organic monolayers . . . 10
5 Switching kinetic measured by Henry de Villeneuve et al.. . 12
6 Switching kinetic measured by Schulze et al. . . 13
1.1 Multi-step protocol for fulgimide monolayer . . . 16
1.2 Infrared absorbance after the different preparation steps . . 20
1.3 Infrared absorbance of C and E fulgimide . . . 22
1.4 Fit of the infrared absorbance of carboxylic acid . . . 23
1.5 Fit of the infrared absorbance of the succinimidyl ester . . . 24
1.6 Fit of infrared absorbance of C fulgimide monolayer . . . 25
1.7 Preparation of dilute fulgimide monolayer . . . 26
1.8 Amidation kinetics . . . 27
1.9 Infrared absorbance of monolayer with different densities . 28 1.10 Different fulgimide densities vs. amidation solution . . . 29
1.11 Topography of hydrogenated silicon . . . 30
1.12 Topography carboxylic acid monolayer . . . 31
1.13 Topography AFM images of a dilute fulgimide monolayer . 31 1.14 Experimental illumination setup . . . 33
1.15 Setup for the calibration measurement of the beams . . . 34
1.16 Temporal development of the intensity of light pulses . . . . 36
2.1 Photochromism of indolyl fulgimide . . . 39
2.2 Franck–Condon diagram for the ring opening reaction . . . 41
2.3 UV-vis absorbance of Fulgimide . . . 44
2.4 Reconstructed C fulgimide absorbance. . . 44
2.5 PSS determination. . . 46
2.6 Photo degradation . . . 47
2.7 Determination of switching kinetics . . . 48
2.8 Different kinetic curves of the ring opening reaction . . . 49
2.9 Different kinetic curves of the ring closing reaction. . . 50
2.10 Cross section of the ring closing reaction. . . 51
2.11 Cross section of the ring closing reaction. . . 52
2.12 Cross sections of the different isomerization cycles . . . 53
2.13 Cross sections for 590 and 655nm . . . 54
2.14 Reaction paths for the indolyl fulgimide under irradiation . 57 3.1 Different strategies for photochromic monolayers . . . 60
x
3.3 Pure C and E fulgimide IR absorbance . . . 67
3.4 Change of infrared absorbance due to visible illumination . 67 3.5 Relative advancement of the commutation (1). . . 68
3.6 Relative advancement of the commutation (2). . . 69
3.7 Calibration of the number of switched isomers . . . 69
3.8 Photo switching for different light fluxes. . . 70
3.9 PSS estimation for dense C monolayer . . . 71
3.10 PSS estimation for dilute C monolayer . . . 72
3.11 PSS estimation under UV light . . . 73
3.12 Numerical cross section for the ring opening reaction . . . . 73
3.13 Cross section determination by linear regression . . . 74
3.14 Determination of the cross sections under UV light. . . 75
3.15 Isomeric composition at the PSS for successive isomerizations 76 3.16 Photo-degradation on surfaces . . . 77
3.17 Successive photo commutation cycles . . . 78
3.18 Numerical cross section of successive isomerizations . . . . 79
3.19 Cross section for successive isomerization cycles . . . 79
3.20 Isomeric composition at the PSS. . . 80
3.21 Numerical cross sections for different surface densities . . . 81
3.22 Cross section for different polarizations . . . 82
3.23 Alignment of the C, E and Z fulgimide . . . 83
3.24 Cross sections vs E-field intensity . . . 85
3.25 Ratio of normalized cross sections . . . 85
3.26 Transition dipole . . . 86
4.1 Cross sections of the different isomerization cycles . . . 90
4.2 Thermal influence on the photo switching . . . 91
4.3 Arrhenius plot for the ring opening and closing reaction . . 92
4.4 Numerical cross sections at different temperatures . . . 92
4.5 Numerical cross section and activation energy . . . 93
4.6 Reaction paths for the ring opening reaction. . . 95
4.7 Different activation energies in different environments. . . . 96
4.8 Fulgimide alignment on silicon surfaces . . . 97
4.9 Simulated commutations of fulgimide monolayer . . . 100
4.10 Estimation of the PSS for the Monte Carlo simulation . . . . 101
4.11 Comparison experiments - simulation: dilute monolayers. . 102
4.12 Isomeric composition of PSS for different densities . . . 103
4.13 Comparison: different temperatures . . . 104
4.14 Comparison: different initial isomeric comsposition . . . 104
5.1 UV visible spectrum of the AuNP. . . 111
5.2 Size distribution of AuNP . . . 112
5.3 Preparation cycle for gold nanoparticle monolayer . . . 112
5.4 SEM: repetitive drop casting . . . 113
5.5 SEM: fulgimide monolayer covered by AuNP. . . 114
5.6 SEM: defects of AuNP-monolayer . . . 114
5.7 Surface plasmon of AuNP . . . 115
5.8 Infrared absorbance of AuNP . . . 117
5.9 Photochromism with AuNP . . . 118
5.10 AuNP influence on ring closing reaction . . . 120
xi
5.12 AuNP influence on different polarizations . . . 122
5.13 AuNP influence on ring opening reaction (655nm) . . . 123
5.14 Calculation of Ek at the silicon surface with AuNP . . . 127
5.15 Calculation of E⊥at the silicon surface with AuNP . . . 128
5.16 Electric field enhancement for different zones . . . 129
5.17 Numerical cross section: p polararized light . . . 131
5.18 Numerical cross section: s polararized light . . . 132
5.19 Zoom on kinetic hotspot (C→E) . . . 133
A.1 IR calibration: absorbance of succinimidyl ester . . . 145
A.2 IR calibration: integrated ester peaks . . . 145
B.1 Removal of species during first UV irradiation. . . 148
B.2 Inert atmosphere FTIR-cell . . . 148
B.3 Analytical models for switching kinetics (1) . . . 149
B.4 Analytical models for switching kinetics (2) . . . 150
B.5 Kinetic for diverse reactions, polarizations and densities . . 151
B.6 Switching kinetics with and without polarizer . . . 152
C.1 Temperature calibration: thermal cell. . . 153
C.2 Temperature calibration: silicon infrared bands . . . 155
C.3 Temperature calibration: heated sample . . . 156
C.4 Temperature calibration: during illumination (1) . . . 157
C.5 Temperature calibration: during illumination (2) . . . 158
C.6 Differential equation: solution cross section . . . 160
C.7 Differential equation: kinetic curve . . . 161
C.8 Parameter influence on Monte Carlo simulation (1) . . . 162
C.9 Parameter influence on Monte Carlo simulation (2) . . . 162
C.10 Parameter influence on Monte Carlo simulation (3) . . . 163
D.1 Seperature plasmon: ring closing reaction . . . 166
D.2 Seperature plasmon: ring opening reaction . . . 167
xii
List of Tables
1.1 Infrared bands of open and closed fulgimide . . . 21
1.2 Light flux calibration in solution . . . 35
1.3 Light flux calibration on surfaces . . . 35
2.1 Isomeric composition at the visible and UV PSS . . . 46
2.2 Cross sections and quantum efficiencies . . . 55
2.3 Reaction rates per photon . . . 57
3.1 Dielectric function of silicon . . . 66
3.2 Local electric field intensities at the surface . . . 66
3.3 Isomeric composition at the PSS. . . 80
3.4 Cross sections for the ring opening and closing reaction . . . 81
3.5 Cross sections for different polarizations . . . 82
4.1 Cross sections for different temperatures. . . 91
4.2 Monte Carlo simulation parameters . . . 99
5.1 Cross sections with and without AuNP . . . 123
5.2 Isomer contribution to measured absorbance . . . 129
xiii
List of Abbreviations
AFM Atomic Force Microscopy ATR Attenuated Total Reflection DAE Diarylethene
DFT Density Functional theory
EDC N-(3-Dimethylaminopropyl)-N-ethylcarbodiimide FTIR Fourier Transformed Infrared Spectroscopy
MC Monte Carlo
NHS Nydrosuccinimide PSS Photo-Stationary State SAM Self Assembled Monolayer
SEIRA Surface Enhanced Infra Red Absorbance SEM Scanning Electron Microsopy
SERS Surface Enhanced Raman Spectroscopy SFG Sum Frequency Generation
SHG Second Harmonic Generation SPR Surface Plasmonic Resonance THF Tetrahydrofuran
UV Ultraviolet
vis visible
XPS X-ray Photoelectron Spectroscopy kB Bolzmann constant
ki rate constant
T Temperature
φ Photon Flux
η Quantum efficiency
σ Photo isomerization cross section σabs Absorbance cross section
νa Asymmetric stretch
1
Resumé
Les photochromes organiques sont des molécules qui peuvent commuter de manière réversible entre différentes conformations structurales par ab-sorption de lumière. Les changements structuraux induits par illumina-tion s’accompagnent en général d’une modificaillumina-tion de leurs propriétés op-tiques. Parmi différentes familles, les composés indolyl fulgimide présen-tent des propriétés poprésen-tentiellement intéressantes en vue de leur utilisa-tion comme commutateurs optiques. En soluutilisa-tion, l’illuminautilisa-tion UV-Vis de ces composés permet de commuter de façon réversible entre deux types d’isomères thermiquement stables: des formes ouvertes (E,Z) et des formes cycliques fermées (C) qui présentent des bandes d’absorption bien séparées dans le domaine UV-Vis et en IR.
Dans ce travail nous nous sommes intéressés aux propriétés de photo-commutation de ces composés immobilisés sur des surfaces. Des isomères (E,Z) ou (C) ont été ancrés de façon covalente sur des surfaces de silicium pré-fonctionnalisées par des monocouches organiques. La cinétique de photo-commutation des monocouches de fulgimides a été étudiée in situ par spectroscopie FTIR en fonction de la densité de fulgimides et des con-ditions d’illumination (intensité et polarisation) et a été comparée à celle observée en solution.
Le manuscrit est conçu comme suit :
Le chapitre 1 présente les principales techniques expérimentales util-isées dans cette thèse. L’approche développée pour la préparation de monocouche avec des densités de fulgimides variables est décrite. La com-position chimique en surface (concentration en fulgimides) est déterminée par spectroscopie infrarouge à transformée de Fourier en géométrie ATR.
2
La topographie des monocouches est examinée par microscopie à force atomique. La deuxième partie du chapitre présente le dispositif expéri-mental qui a été spécifiquement développé pour l’illumination et le suivi in situ de la photocommutation sur les surfaces de silicium par spectroscopie FTIR.
Le chapitre 2 présente une étude approfondie de la photocommuta-tion des fulgimides en soluphotocommuta-tion (acétonitrile). Dans cette étude, des con-ditions d’illumination similaires à celles utilisées pour étudier la commuta-tion sur les surfaces, ont été utilisées de façon à pouvoir comparer les pro-cessus d’isomérisation (cinétique, composition isomériques aux états pho-tostationnaires) et évaluer l’influence de l’environnement (surface ou solu-tion) sur la photo-isomérisation. L’efficacité des isomérisations C↔E (sous lumière visible) et E↔C (sous lumière UV) a été évaluée en calculant les sections efficaces en solution pour chacunes des réactions.
Le chapitre 3 est dédié à l’étude des monocouches de fulgimides sur les surfaces de silicium. La photocommutation a été étudiée en fonction de la densité de fulgimides, et en faisant varier les conditions d’illumination (intensité et polarisation). La composition isomérique aux états photo-stationnaires et les paramètres cinétiques ont été déterminés à partir de mesures par spectroscopie FTIR. Les résultats montrent que 100% des fulgimides sont commutables en dessous d’une densité critique. Au-dessus, les résultats montrent qu’une fraction des fulgimides ne commute pas à cause d’effets stériques. Des sections efficaces d’isomérisation plus faibles sont observées sur les surfaces et varient en fonction de la polarisa-tion. Il est montré que les différences observées - surface versus solution ou selon la polarisation - s’expliquent par des environnements diélectriques différents et donc des intensités différentes du champ électrique local. Par ailleurs, un effet d’orientation des photochromes est également mis en évi-dence.
Dans le quatrième chapitre, la photocommutation des fulgimides est mesurée en fonction de la température. Nous avons mis en évidence que
3
la réaction de cyclisation E↔C (sous UV) ne dépend pas de la tempéra-ture, alors que la réaction inverse C↔E (sous la lumière visible) est ac-tivée thermiquement et que l’énergie d’activation associée n’est pas con-stante mais augmente au cours de la commutation. Des simulations Monte Carlo prenant en compte l’environnement moléculaire local variable des fulgimides (type d’isomère au voisinage) au cours de l’isomérisation per-mettent de rendre compte des variations d’énergie d’activation et de section efficace observées expérimentalement.
Dans le cinquième chapitre, l’effet d’une augmentation du champ élec-trique local a été étudié. Pour cela des nanoparticules d’or ont été déposées au-dessus de la monocouche des fulgimides pour induire une amplification locale du champ électrique par résonance plasmon. En illuminant avec une longueur d’onde dans la bande d’absorption des plasmons des nanopar-ticules d’Au (λ = 690nm), un phénomène d’augmentation des sections ef-ficaces a été mis en évidence qui dépend de la polarisation. Les amplifica-tions observées expérimentalement sont interprétées de façon quantitative par des calculs numériques d’intensité du champ électrique au voisinage des nanoparticules d’or.
En conclusion, une approche expérimentale a été couplée à des simu-lations théoriques pour étudier l’influence de l’environnement sur les pro-cessus de photo-isomérisation de fulgimides immobilisés sur des surfaces de silicium. Ce travail montre que les propriétés diélectriques en surfaces et l’organisation moléculaire influencent de manière décisive la cinétique d’isomérisation.
5
General Introduction
Context
A molecular switch is a molecule that can reversibly be switched between two or more (meta-) stable forms. Certain functionalities are achieved by the change of the molecular state. The switching process is excited by an external stimuli, for example light, temperature, pH or electric current.
In fact molecular switching is a basic concept found in nature. A promi-nent example is the molecule Rhodopsin that is present in the human vision process [1,2]. Rhodopsin undergoes structural changes due to the absorp-tion of light. This is the first step of the visual phototransducabsorp-tion in which light is converted to an electric signal to inform our brain that our eyes see visible light.
The example of the human vision illustrates the interest of molecular switches. Consequently the chemical and physical research on switchable molecules is very active due to many potential applications. Switchable molecules modify the properties of a material if they are anchored to its surface. Possible applications of switchable molecules on surfaces are for example data and signal progressing [3–5], optical switches [6], switchable catalysis [7], cell culturing [8], data storage [9], micro-fluids [10] etc.
Molecular switches
A molecular switch is a molecule that exhibits at least two stable or more meta-stable forms and transitions between these forms exists, as displayed in figure 1. The molecule is in its ground form a and another stable or meta-stable form b exists. The transition from one form to the other can be
6 General Introduction
induced by the absorption of a photon or by electron injection, but other external stimuli, e.g. pressure, are existing, too. Thermally activated transi-tions are possible depending on the energy barrier between the two forms.
FIGURE1: Operation principle of a molecular switch
The different forms of the molecule exhibit different properties, in par-ticular optical properties as color (different visible absorbances), but fur-thermore, conductivity, geometry, dipole moments, refractive indices, elec-tric polarizability and magnetic susceptibility may be different for the two forms.
Photochromic molecules
Photoswitchable molecules are molecular switches whose transitions are induced by the absorption of light. Photochromic molecules undergo a change in their color (chromic) by the absorption of light (photo). These molecules may be colorless in the energetically lower form and can be switched by the absorption of UV light to the colored form.
Two kinds of photochromes are distinguished: P- and T-type (photon and temperature). In P-type photochromes the energetically higher form bis thermally stable and therefore the back switching must be induced by a visible photon. In T-type photochromes the colored form b is not ther-mally stable and therefore the photochrome can spontaneously relax to the ground-form. This is represented by the height of the energy barriers EB of the meta stable form with respect to the room temperature (T-type:
General Introduction 7
FIGURE2: Examples of photochromes
Different photochromic compounds are existing (figure2), the most fa-mous being azobenzene. The chemical transformation of the azobenzene (T-type) consists of a trans cis isomerization around the double N=N bond which induces a large change in the dipole moment and prompted many studies of this system[11].
The reaction mechanism of azobenzene has been studied by pumped femtosecond spectroscopy [12–14]. The reaction mechanism for the trans→cis isomerization is shown in figure3[15,16]. Two pathways for the trans→cis isomerization are available, by rotation around the N=N double bond or by inversion. Due to the absorption of a photon the closed isomer is excited from the trans form into a Franck Condon state on the S2 or S1
energy sphere. It then reaches a hybridized transition state. From the tran-sition state two reaction channels are available, internal conversion back to the trans form or the trans→cis isomerization to the cis form. However, cis-azobenzene is not stable at room temperature and thermal back isomer-ization to the trans isomer occurs (T type). Therefore azobenzene like other
8 General Introduction
P type photochromes is not suitable for applications where thermal stability is required in both forms. Furthermore, the lack of thermal stability repre-sents a significant burden for the study of the photo-switching kinetics of photochromes in different environments.
FIGURE 3: Schematic photo isomerization process for
azobenzene taken from [12]
Other photochromic molecules are often switched from one form to the other by the rotation around a double bond or by a ring opening and ring closing reaction. The photo-isomerization of diarylethene and fulgimide (P-type) consist of the ring opening of cyclohexadiene to a hexatriene back-bone or the reverse closing reaction. In spiropyran (T-type) the fragile car-bon oxygen car-bond can be broken and again a ring opening reaction is ob-tained. In all cases to leave the ground form UV light is necessary and the back isomerization can be excited by visible light. Among photochromes, fulgimides are known to be resistant to fatigue upon repeated UV-Vis ir-radiation cycles [17, 18]. Depending on the side groups of the fulgide or fulgimide 104switching cycles have been observed and therefore they can represent a very fatigue resistant molecular switch [19].
Many different systems consisting of several photochromic compounds have been designed. Photochromes can be bound to form dimers or poly-mers and thereby their photochromic properties may be coupled [20–22]. The photochromism can be significantly affected when a transition metal is coupled to photochromic compound [23–25]. Furthermore, the coupling
General Introduction 9
of photochromes with metallic nanoparticles is an emerging research field [26–31]. Even organic nanoparticles consisting of organic photochromes have been designed [32,33].
Photochromism of thin films
Above mentioned photochromes have been incorporated in polymers to obtain thin films with photochromic properties. However, for photochrome based devices such as optical memories, it is desirable to immobilize the photochrome at the surface. Thin layers containing photochromes may be prepared by spin coating, Langmuir–Blodgett or layer-by-layer method [34, 35]. An alternative approach consists in binding photochromes on a sur-face. In this case, controlling the binding of the absorbed molecule and the substrate is critical for the switching behavior.
Photochromism in 2D monolayers
Many studies have also considered 2D monolayers of photochromes and showed that the molecule’s electronic properties and structure may be in-fluenced by coupling with the substrate. For instance, the potential energy surface in figure 3 in ultrahigh vacuum is significantly changed for pho-tochromes absorbed on metal surfaces [36]. Two photons experiments have also demonstrated that the structure of excited state may be different at sur-faces and in solution. As a result, photoswitching is often strongly impacted or even suppressed for compounds immobilized on a surface. For example, the switching ability of azobenzene is suppressed for azobenzene directly absorbed on gold substrates [37, 38]. The photo switching is restored by intercalating a spacer between the photochrome and the metallic surface to reduce electronic coupling with the substrate [39]. Different methods have been employed, the most popular one being the introduction of a function-alized self-assembled monolayer of thiols on gold surfaces (see figure4). A more extended literature survey will be given in chapter 3.
10 General Introduction
Other studies considered semimetals like bismuth [40] to modify elec-tronic coupling and these showed that PS is more efficient than on metallic substrates.
FIGURE4: Schematized photochromism of organic
mono-layers on Au surface modified with a functionalized SAM of thiols to immobilized the photochromes on the substrate.
Photo-isomerization monitoring
In solution the photo-isomerization of photochromes can easily be mea-sured by UV visible photo-spectroscopy because of the distinguishable vis-ible absorbances of the different isomers. Immobilized on surfaces the readout of the photo commutation is more challenging due to the limited amount of photochromic compounds (ca. 1-10 ·10−10mol/cm2). Since
nu-merous properties change due to the photo switching diverse measurement methods are used to monitor the switching kinetics. For example the iso-merization of single molecules can be measured by scanning tunneling mi-croscope [41], the global isomerization can be monitored by contact angle measurements [10], but both techniques do not allow studies of the switch-ing kinetics of the monolayer. The photo-isomerization can be measured ex-ploiting optical properties in the infrared, visible and high energy regions using different spectroscopies (infrared, Raman, visible absorption, X-ray etc.). An more detailed overview of the different measurement methods is given in the introduction in chapter3.1.
The literature shows that photo-switching properties of photochromes attached surfaces are generally different with respect to those measured in solution. These are often explained by the particular environment of the photochromes at the surface. Steric hindrance is very often invoked but electronic coupling between substrate and photochrome and/or between
General Introduction 11
photochromes plays a role, too. This has justified the different strategies to uncouple the photochromes from the metallic surfaces, by introducing a spacer (often a self-assembled monolayer) or the use of semi-metals such as Bi [40] and semiconductors [42]. Nonetheless, disentangling of the different factors is difficult and, as will be shown later, requires a better precision while monitoring the photo-commutation.
Aim and outline of the present work
The very good thermal stability of fulgimides makes them good model systems to investigate above mentioned effects. These compounds have been synthesized in Japan in 1991 [43] and have been considered as po-tential molecular memories and switches [44]. The mechanisms of photo-isomerization were vastly investigated in liquid solutions [45–48] using pump-probe techniques [47, 49] because photo-isomerization is very fast (100 ps time scale). Temperature dependent studies in solution showed fulgimide photo-isomerization follows a complex energy landscape. Ther-mal stability of fulgimides was exploited to create logic gates [50,51], mem-ories and logic devices by incorporating them in polymer films [6,9,52–54]. Studies of fulgimide photoswitching on surface are very recent and were all conducted after their immobilization on a functionalized silicon substrate [55–58]. In all these works fulgimides were modified with an amino linker to anchor them via a peptide covalent bond on an acid ter-minated alkyl monolayer. The photo-isomerization was characterized by FTIR [55, 56, 58], XPS [56] and very recently by SHG [57]. Data essen-tially demonstrated the reversible photo-isomerization of fulgimide mono-layers between two PSS, named as such because the monitoring signal was no longer depending on time or the photon dose. The exact iso-meric composition at PSS was however not determined except in [55, 58] and data allowed postulating that some photochromes remain ’frozen’ or inactive when the surface density exceeds a critical density. The photo-isomerization of fulgimides on silicon surfaces was first monitored by FTIR
12 General Introduction
by Henry de Villeneuve et al. [55] (see figure5). Additional preliminary investigations as a function of surface density of immobilized fulgimides have been conducted in [55,58]. These works showed that the photoswitch-ing is much slower than in solution and that it does not obey a first order kinetic law. Nonetheless, a recent study, using SHG [57], reported a first order kinetic law with an effective cross sections (2.3 · 10−18cm2(UV: E→C) and 1.2 · 10−18cm2 (Vis: C→E) ) as large as those measured in solution.
FIGURE5: Time dependence of isomeric composition of a fulgimide monolayer on Si(111). The first few cycles are
shown. Figure taken from [55]
All in all, one knows that (i) fulgimide monolayers can be reversibly switched between two photo stationary states and (ii) that the isomeric composition at PSS seems to depend on the surface density of immo-bilized fulgimides. However, there is some disagreement about photo-isomerization characteristics (cross sections and kinetic law) which needs to be revisited. In this work the photo-isomerization of fulgimides on sili-con surfaces is investigated using calibrated FTIR [55,58]. To vary the sur-face density of fulgimide a new approach is introduced in chapter 2 which is more flexible than the previous approach used in the group [58]. In ad-dition, a new experimental approach to control the photon dose has been implemented (see chapter 1) and a new data analysis was also developed (see chapter 3). Both help to greatly enhance the precision on determination
General Introduction 13
FIGURE6: Changes in the SHG signal amplitude as a func-tion of photon dose for a fulgimide monolayer on Si(111). (A) Increase of the SHG intensity as a function of photon dose at λ = 365 nm corresponds to the ring-closure reaction
(E/ZP SS→ CP SS). (B) SHG intensity decrease as a function
of light exposure at λ = 530 nm nm due to the ring opening
(figure reproduced from [57])
of the effective cross sections.
Thanks to these new tools, the effective cross section σ and PSS may be measured with sufficient precision to discuss the influence of light po-larization (chapter 3), the influence of sample temperature (chapter 4) and the influence of plasmonic gold nanoparticles (AuNP) absorbed on top of the fulgimide monolayer (chapter 5) on the photoswitching kinetics of fulgimides immobilized of a surface. Chapters 3 and 5 deal in essence with the question of the influence of electromagnetic field, while chapter 4 aims at discussing the energy landscape as well as the impact of the local envi-ronment.
15
Chapter 1
Experimental Details
1.1
Introduction
In the continuity of previous studies carried out in the group [55, 58] fulgimide monolayers were prepared using the multi-step protocol shown in figure1.1, which was developed in this group [55,58] based on the proto-col of Moraillon et al. [59]. However, in this work we introduce a more reli-able and flexible procedure to vary the surface density of the photochromes on the surface (section1.4) and new experimental set-up for in situ illumi-nating and monitoring the isomerization process on the surfaces has been developed (section 1.14). The new fully automatized set-ups allow good control of the photon dose and faster FTIR measurements, for a more pre-cise monitoring of the isomerization process in particular in early stage of the process. Calibration of the photon dose on the surface and/or in solu-tion was carefully carried out and the photo-isomerizasolu-tion on the surfaces was compared to photo-isomerization in solution using the same (new) il-lumination set-up.
1.2
Fulgimides
Fulgimide compounds (powder) were generously supplied by Karola Rück-Braun (TU, Berlin). The synthesis of the compounds and details on their chemical characterizations are reference [56]. As shown in figure1.1 these compounds are substituted with an amino-linker to immobilize them on the surface. They were packaged under N2 atmosphere and stored in
16 Chapter 1. Experimental Details
FIGURE1.1: Multi-step protocol for the covalent linkage of amino-fulgimide onto hydrogenated silicon surfaces.
Fig-ure adapted from [55]
the dark at 4◦C, and were protected as far as possible from light during the solution preparation and/or once anchored on the surfaces .
1.3
Preparation and characterization of fulgimide
monolayer
1.3.1 Experimental procedures Substrate preparation
N type silicon wafers1(Phosphor doped) with an (111) surface orientation
of a thickness of 0.50 mm to 0.54 mm have been used as substrates. The (111) surface had a miss-cut of 0.2◦ towards the (112) direction to obtain terraces after etching. Both sides of the Float-zone silicon have been polished. The samples had a length of 12 mm to 15 mm and a height of 13 mm. The silicon is covered by a thin oxide layer.
The infrared spectroscopy in ATR geometry requires the infrared beam to enter and leave the silicon substrate from the lateral sides. Therefore the lateral sides of the silicon substrate have been polished in an angle of 45◦. In ATR geometry around 24 to 30 internal reflections of the infrared beam
1.3. Preparation and characterization of fulgimide monolayer 17
are obtained. After the polishing the silicon prisms have been cleaned in tricloroethylene, acetone and ethanol to remove traces of wax that has been used in the polishing process.
Silicon etching and hydrogenation
For the grafting of organic monolayers on silicon surface the oxide mono-layer needs to be removed to get hydrogenated silicon surface. This can be achieved by chemical etching using fluoride solution (e.g. ammonium flu-oride, hydrogen fluoride) [60,61]. In this work chemical etching has been done using 40% NH4F to favor anisotropic etching of silicon resulting in
regular terraces flat at atomic scale [62].
To do so the silicon substrates are twice exposed to piranha solution using a mixture of 3 volumes 96% of H2SO4 to one volume of 30% H2O2
for at least 10 minutes. All non metallic materials were cleaned in piranha solution, too. Afterwards the samples are rinsed in copious amounts of ultra-pure water (18.2 MΩcm). Then the silicon is exposed to the 40% NH4F
containing small amounts of (NH4)2SO3for oxygen binding during 15
min-utes to etch the oxide layer. After etching the substrates are rinsed again in ultra pure water and dried using an argon flow. Finally the sample is stored in an argon atmosphere for at least 10 minutes to dry the last remaining wa-ter and wait until its introduction into the grafting solution
Grafting of carboxydecyl monolayer
The grafting of carboxylic acid monolayer (step 1 in1.1) was done follow-ing the protocol developed by Faucheux et al. [63]. 1-undecylenic acid CH2=CH-(CH2)8-COOH2reacts with the freshly prepared SiH surface. For
the grafting 15 ml undecylenic acid is poured into a Schlenk reactor and then out-gassed by argon at around 40◦C for 10 minutes. The temperature is then increased to 100◦C under continuous argon flow for at least 30 min-utes to eliminate traces of water. Then the solution was let to cool down to 40◦C and the hydrogen terminated silicon sample is added. The solution
18 Chapter 1. Experimental Details
and the sample were flushed with Argon for 20 minutes before the Schlenk has been hermetically closed. The grafting is activated by UV light irradia-tion (λ = 316 nm with 6 mWcm−2) inside a home-build photo reactor for at least 3 hours.
After the grafting the Schlenk reactor is let to cool down. The sample is removed from the solution and cleaned twice in hot acetic acid at 70◦C for around 30 minutes in order to remove residual undecylenic acid ph-ysisorbed atop the monolayer by hydrogen bounds [64]. Afterwards the sample is copiously rinsed in ultra-pure water to remove residual acetic acid and blown dry.
Surface activation
This step is required to activate the terminal carboxyl group and enable the linkage of amino-photochromes in soft conditions that preserve the organic photochrome.
For the attachment of amino groups (step 2) the carboxylic acid needs to be transformed to succinimidyl ester (COOH → COOSuc) [59,65]. To do so the carboxylic acid monolayer is immersed in freshly prepared 0.1 M hydro-succinimide (NHS), 0.1 M N-Ethyl-N’-(3-(dimethylamino) propyl) carbodi-imide (EDC) in MES buffer solution at pH 5.5 for one hour at 15◦C under continuous argon flow.
Afterwards the activated surface is successively rinsed in 0.1M NaH2PO4 (pH=5), 0.01M NaH2PO4 (pH=5) and ultra-pure water for each
time 10 minutes at 40◦C. Finally the sample is dried using an argon flow.
Anchoring of amino-Fulgimide
The final step of the sample preparation is the linkage of amino-fulgimide by aminolysis of the succinimidyl ester groups.
The amino photochromes are covalently coupled to the surface by re-action with the COOSuc activated surface (step 3). This is achieved by im-mersion of the COOSuc surfaces into acetonitrile containing 5mM of closed
1.3. Preparation and characterization of fulgimide monolayer 19
C or open E/Z amino terminated fulgimide. The Schlenk containing ace-tonitrile and the fulgimide is then out-gassed for 5 minutes to remove O2.
The Schlenk is closed and the reaction let to proceed for two hours at room temperature. Subsequently the photochromic monolayer is cleaned three times in an acetonitrile bath at 40◦C for about 10 minutes and then blown dry. Once prepared, the sample with the fulgimide monolayer are stored in the dark and under nitrogen atmosphere until their characterization or study of their photo commutation properties.
As far as possible all preparations and experiments with the pho-tochromes are performed in the dark.
1.3.2 Qualitative surface composition
The Fourier transformed infrared absorbance spectra (p polarization) after the different preparation steps are shown in the figure 1.2. The reference spectrum for all spectra is the hydrogenated silicon prior to any modifica-tion of the same sample. Thereby the positive and negative infrared bands correspond to gained and lost absorption dipoles. The contribution of wa-ter vapor on all FTIR is automatically corrected using different reference spectra of water-vapor. A first order polynomial correction of the baseline of the absorption spectra may have been applied if necessary.
The carboxylic acid monolayer after the first preparation step is dis-played on top. The negative band at 2083 cm−1 of the carboxylic acid spec-trum corresponds to the νSiH stretching mode and therefore shows loss of SiH bonds. The other negative infrared bands at 2334 cm−1 and 2361 cm−1 correspond to a lower CO2 content during the carboxylic acid
measure-ment with respect to the measuremeasure-ment of the hydrogenated silicon and can be ignored. The large positive infrared band at 1715 cm−1 belongs to the carbonyl νC=O stretching of the carboxylic acid. The large infrared bands at 2853 cm−1and 2922 cm−1are assigned to the symmetric and asymmetric νCH2 stretching modes, respectively. The broadening of the CH2 peaks is due to the different environments at the beginning, middle and end of the alkyl chain. The infrared bands of silicon oxide are in the interval between
20 Chapter 1. Experimental Details 1000 1500 2000 2500 3000 −8 −6 −4 −2 0 2x 10 −3 wavenumber in cm−1
absorbance per reflection
carboxylic acid succinimidyl ester
C fulgimide
E fulgimide
FIGURE1.2: Infrared absorbance after the different prepa-ration steps in p polarization on Si(111). The freshly etched
hydrogen terminated surface served as reference.
1000 cm−1 and 1200 cm−1. The loss of the SiH bonds and the gain of the infrared bands corresponding to the carboxylic acid and CH2 clearly indi-cates the successful grafting of the undecylenic acid. The absence of any oxidation peaks indicates a good grafting yield. Qualitatively the infrared spectrum corresponds to other infrared spectra reported in the literature [58,63].
The infrared absorbance after the functionalization of the carboxylic acid monolayer (step 2) is shown in figure1.2 (second curve). The νC=O band of the carboxylic acid at 1715 cm−1is replaced by three new bands at 1745 cm−1, 1787 cm−1and 1817 cm−1that are assigned to the three carbonyl groups of the ester and the succinimidyl group. The negative SiH and the CH2 peaks basically remain unchanged with respect to the carboxylic acid surface after grafting. The three peaks in the carbonyl region indicate suc-cessful activation of the carboxylic acid to the succinimidyl ester.
After the fulgimide coupling the IR absorbance spectrum changes sig-nificantly between 1200 cm−1 and 1800 cm−1. The infrared spectra after aminolysis (step 3) using C and E fulgimide are displayed. Very similar absorbance spectra are obtained for C and E fulgimide monolayer. In the
1.3. Preparation and characterization of fulgimide monolayer 21
carbonyl region several bands are present that are listed in table1.1. The in-frared bands are in agreement with measurement of the same components in solution and on surfaces [55,56,66]. The bands can be assigned to partic-ular vibrations by density functional theory calculations [66]. The diverse assigned to the fulgimide clearly indicate their presence on the surface. The amide band at 1654 cm−1indicates the covalent bonding of the fulgimide to the surface.
C Fulgimide E/Z Fulgimide Band assignment 1546 cm−1 1543 cm−1 νC=C indolyl ring 1605 cm−1 1595 cm−1 νC-H phenyl ring
- 1620 cm−1 νC=C indolyl ring
1654 cm−1 1654 cm−1 νN-C=O amide
1698 cm−1 1690 cm−1 νaC=O malmeide group
1758 cm−1 1739 cm−1 νsC=O malmeide group
TABLE 1.1: Infrared bands of open and closed fulgimide in
the carbonyl region
In figure 1.3 the infrared absorbance of closed and open fulgimide monolayer in the carbonyl region is shown. The most significant differ-ence of the infrared absorbance is the asymmetric and symmetric νC=O of the maleimide group whose peak positions and heights of C and E monolayer clearly differ. For the C fulgimide the asymmetric and symmet-ric maleimide positions are 1698 cm−1 and 1758 cm−1, respectively, for the open E/Z fulgimide the asymmetric and symmetric maleimide positions are 1690 cm−1and 1739 cm−1.
1.3.3 Quantitative surface composition
The surface concentration of the carboxylic acid monolayer has been deter-mined by the FTIR absorbance. This has been done following the procedure developed in this group [59,63]. For this procedure the integrated infrared absorbance bands at the surface are compared to reference infrared bands of the same compound in solution at known concentrations. For the compar-ison on surfaces the infrared spectrum needs to be measured in both s and
22 Chapter 1. Experimental Details 1600 1650 1700 1750 1800 0 5 10 15 20x 10 −4 wavenumber in cm−1
absorbance per reflection
C Fulgimide E Fulgimide
FIGURE1.3: Infrared absorbance in p polarization of C and E fulgimide monolayer in the carbonyl region. The refer-ence is hydrogenated silicon, both infrared spectra are in p
polarization.
p polarization to take normal and perpendicular orientations of the dipoles into account. The absorbance bands are normalized with respect to their electric field in solution or on the surface. Geometrical factors accounts the isotropy in solution or the anisotropy on silicon. The method is explained in detail in the annexA.2.
In figure 1.4the νC=O peak of the carboxylic monolayer is displayed. For the determination of the surface concentration of the carboxylic acid groups the integrated peaks needs to be compared to solution. The blue curve shows the measured absorbance, the thin black lines the individual peaks and the red curve the addition of the peaks. A Voigt profile has been fitted to the νC=O peak centered at 1714 cm−1. A small shoulder is added to take impurities corresponding to ester groups νC=O at 1740 cm−1. Not respecting the shoulder increases the integrated absorbance by only 1%. The absorbance spectrum measured by an s polarized infrared beam is very similar and fitted in the same way.
The surface density for the acid monolayer shown in the figure is 2.8 · 1014cm−2which corresponds to 2.8 carboxylic acid per nm2. The sur-face densities for all examined samples are between 2.6 · 1014cm−2 and 2.9 · 1014cm−2, the shown absorbance is therefore representative. These val-ues are in agreement with previously determined surface concentrations of
1.3. Preparation and characterization of fulgimide monolayer 23 1600 1650 1700 1750 1800 1850 −2 0 2 4 6 8 10 12 14x 10 −4 wavenumber in cm−1
absorbance per reflection
FIGURE1.4: Infrared absorbance of carboxylic acid in p
po-larization on Si(111) in the carbonyl region. The blue curve corresponds to the measured absorbance and the red line shows the fitted absorbance. The individual fits are shown
in black
carboxylic acid monolayers [58, 59, 63]. Compared to the number of SiH bonds sites available onto of the Si(111) surface (7.8 · 1014cm−2) this corre-sponds to a coverage of around 33% to 37%.
The determination of the surface density of the succinimidyl ester layer is particularly important because not only the succinimidyl ester surface characterized by this procedure but the number of photochromes is de-termined by the number of disappeared succinimidyl ester groups, too. However, the three infrared bands in the carbonyl region at 1745 cm−1, 1787 cm−1 and 1817 cm−1 strongly overlap. Furthermore, the 1745 cm−1 band has a significant shoulder towards lower wavenumbers. Diverse opti-mized parameter give similar χ2resulting in significant incertitudes on the surface density. Therefore the new fitting procedure introduced before has been used to stabilize the procedure.
The overlap of the succinimidyl ester on surfaces is much stronger than in solution due to the band widening in molecular crystals. In solution the bands are well separated and can be fitted without problems. The ratio of the integrated peaks of the three different carbonyl bands has first been de-termined in solution. On surfaces the succinimidyl ester is then fitted with a self made fitting program that conserves the ratios determined in solution.
24 Chapter 1. Experimental Details
This is explained in detail in the annex. Thereby succinimidyl ester den-sities of between 2.0 · 1014cm−2 and 2.4 · 1014cm−2 have been determined
indicating a successful activation of 70% to 85% of the acid groups.
1600 1650 1700 1750 1800 1850 1900 −0.5 0 0.5 1 1.5 2 2.5x 10 −3 wavenumber in cm−1
absorbance per reflection
FIGURE1.5: Infrared absorbance of the succinimidyl ester in the carbonyl region measured by p polarized infrared
The surface density of the fulgimide monolayer is determined by the number of disappeared succinimidyl ester groups. In figure 1.6 the fulgimide absorbance of a as prepared C monolayer is shown using the succinimidyl ester monolayer before amidation as reference. Thereby the infrared bands at 1745 cm−1, 1787 cm−1 and 1817 cm−1 are negative and the bands corresponding to the fulgimide are positive. Non-activated acid groups are canceled out to the ester reference. The spectrum shows the ab-sorbance by a p polarized infrared beam, a similar result is obtained for the beam in s polarization. The fitting of this monolayer is particularly chal-lenging because of the strong overlap of the different bands. Therefore for the fitting of the disappeared succinimidyl ester groups the same peak po-sitions and widths have been used as before. Furthermore, again the ratios between the three peaks are fixed by the calibration in solution. Thereby the degrees of freedom are significantly reduced and the fit is more robust. For the monolayer whose infrared spectrum in p polarization is shown the number of disappeared succinimidyl esters is 1.8 · 1014cm−2. It is assumed
1.4. Diluted photochromic monolayers 25 1500 1600 1700 1800 1900 −2 −1.5 −1 −0.5 0 0.5 1 1.5 2x 10 −3 wavenumber in cm−1
absorbance per reflection
FIGURE 1.6: Infrared absorbance of a monolayer of C fulgimide in the carbonyl region using succinimidyl ester as reference. The number of disappeared ester is determined by fitting different infrared bands (black line), the sum of
the individual peaks is displayed in red.
1.4
Diluted photochromic monolayers
In the work of [58] diluted fulgimide monolayers are prepared by control-ling the density of anchoring sites on the silicon surface. In his PhD Thang showed grafting silicon using mixtures of decene/undecylenic acid leads to segregation into domains on the surface which is not suitable for the pur-pose of this study. He used mixed monolayers prepared from mixture of w-decene and w-ester because there was no evidence of domain formation. This required, however, to convert the ester group into COOH by hydroly-sis, which reaction yield is not unity. Moreover the quality and purity of the ester monolayers were generally not as good as that of acid monolayers.
For these reasons a new approach is introduced here where the first monolayer is an acid monolayer as in figure 1.1. The dilution of the fulgimides on the surface is obtained by exposing the succinimidyl ester monolayer to a solution containing fulgimides and ethylamine. A random grafting is expected and the final fulgimide surface density is controlled by the relative concentration of the fulgimides and ethylamine, as schemati-cally shown in figure 1.7. The relative surface concentration of fulgimides and ethylamine is piloted by the concentration of precursors in solution.
26 Chapter 1. Experimental Details
FIGURE1.7: Preparation of dilute fulgimide monolayer
1.4.1 Amidation kinetics
For the preparation of dilute monolayers the amidation solution did not only consist of Fulgimide but of a mixture of fulgimide and ethylamine (CH3-CH2-NH2). Ethylamine is used because it is a small amine that can
be coupled to the surface and its ethyl group is not expected to strongly interact with the photochromes. By mixing the fulgimide and ethylamine both amidations happen simultaneously and a mixed monolayer are ob-tained. The order of magnitude of amidation mixtures to obtain desirable photochrome densities on the surface is not known.
The characteristic amidation time is estimated by time resolved moni-toring the amidation of open fulgimide and ethylamine in acetonitrile. This is realized by mounting a succinimidyl ester monolayer in a cell where it is in contact with the amidation solutions (cell in appendixB.2). During the amidation the infrared absorbance spectrum of the sample is continuously measured. The results are shown in figure1.8. The number of disappeared succinimidyl ester is shown against the amidation time. The concentrations of the fulgimide and ethylamine amidation solutions are 0.5 mM.
When ethylamine is in contact with the succinimidyl ester monolayer the amidation is much quicker compared to the coupling of fulgimide. The beginning of the amidation has not even been observable for ethylamine due to the time delay between the start of the infrared absorbance recording and the injection of the amidation solution. Furthermore, using ethylamine all succinimidyl ester could have been removed. Less succinimidyl ester are replaced by the bulky fulgimides than by the small ethylamine. The characteristic amidation times can roughly be estimated to be in the order
1.4. Diluted photochromic monolayers 27 0 5000 10000 15000 20000 0 0.5 1 1.5 2 2.5 3x 10 14 time in s
loss of ester chains in cm
−2
Ethylamine Fulgimide
FIGURE1.8: Disappeared succinimidyl ester determined by FTIR for diluted amidation solutions of open fulgimide and
ethylamine against amidation time
of τf ul= (4000 ± 500) sand τethyl= (200 ± 150) s. These characteristic times
are too long to be explained by mass transport limitations of precursors towards the surface. The rate determining step of amidation must be the binding step which requires that the precursor adopt an adequate confor-mation on a 2D restricted environment. This is obviously easier for a short chain (ethylamine) than for the amino linker attached to bulky fulgimide compound.
1.4.2 Procedures
The experimental procedure for dilute fulgimide monolayer is a variation of the anchoring of amino terminated fulgimide (step 3) that is described above.
The COOSuc surfaces are immersed into acetonitrile containing 5mM of closed C or open E/Z amino terminated fulgimide and different amounts of ethylamine. Due to the quicker amidation with ethylamine with respect to the amino fulgimide an excess of fulgimide has been used. Different fulgimide-ethylamine ratios have been used: for the different samples the ethylamine concentration is smaller by a factor of 0.17, 0.26, 0.33, or 0.66 with respect to the fulgimide concentration. As for the dense fulgimide monolayer the Schlenk containing the fulgimide and ethylamine is out-gassed using argon, the reaction proceeds at least 2 hours and finally the
28 Chapter 1. Experimental Details
samples are cleaned in acetonitrile and dried using argon.
1.4.3 Quantitative surface composition
In figure1.9the different infrared absorbance spectra corresponding to dif-ferent mixtures of C fulgimide and ethylamine are shown (the ratio of 0.26 has been done with E fulgimide and is therefore not listed). The different mixtures are obtained using a constant amount of fulgimide (5mM) and a variable amount of ethylamine. The left and right panel show the infrared absorbance using hydrogenated silicon and succinimidyl ester as reference, respectively. The intensity of infrared band associated to the asymmet-ric maleimide C=O stretching at 1698 cm−1 clearly differs for the different curves. 1500 1600 1700 1800 1900 −1.5 −1 −0.5 0 0.5 1 1.5 2x 10 −3 wavenumber in cm−1
absorbance per reflection
1 : 0 1 : 0.17 1 : 0.33 1 : 0.66 1500 1600 1700 1800 1900 −5 −4 −3 −2 −1 0 1 2x 10 −3 wavenumber in cm−1
absorbance per reflection
1 : 0 1 : 0.17 1 : 0.33 1 : 0.66 0 : 1
FIGURE 1.9: Infrared absorbance spectra after using dif-ferent mixtures of fulgimide and ethylamine in p polariza-tion using hydrogenated silicon (left) and succinimidyl
es-ter (right) as reference.
The intensity of all infrared bands associated to the fulgimide differ strongly for different mixtures. The less ethylamine is in the amidation so-lution the more intense is the fulgimide peak at 1700 cm−1. On the other hand the amide group at 1650 cm−1and the number of disappeared succin-imidyl ester groups are rather constant for all experiments. This indicates the successful preparation of dilute monolayer consisting of fulgimide and ethyl groups attached on the surface.
The photochromic density can not be determined from the disappeared succinimidyl ester because the latter are replaced by ethylamine, too. Their density has therefore been determined using the spectra in right panel of
1.4. Diluted photochromic monolayers 29
figure1.9. The dilute monolayer must be a linear composition of the dense fulgimide monolayer (red) and the ethylamine monolayer (purple). The density of the pure C monolayer is determined by the number of disap-peared esters. Accordingly the number of fulgimides on dilute monolayers can be calculated by the linear decomposition of the dilute fulgimide mono-layer by a dense fulgimide and ethylamine monomono-layer.
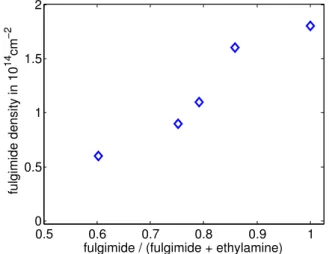
The determined densities of the fulgimide monolayers are shown in fig-ure1.10as a function of the fulgimide/(fulgimide + ethylamine) concentra-tion. We note that the data points are aligned on a straight line that does not pass through the origin. This is in perfect agreement with the fact that the amidation kinetics of ethylamine is much faster (figure1.8).
The density of the fulgimide monolayer spans from 0.6 to 1.8 · 1014cm−2
(factor 3). Further decreasing the fulgimide density would strongly affect the sensitivity of the measurement1.9and no precise study of the switching kinetics would be possible.
0.5 0.6 0.7 0.8 0.9 1 0 0.5 1 1.5 2
fulgimide / (fulgimide + ethylamine)
fulgimide density in 10
14
cm
−2
FIGURE 1.10: Different densities of dense and dilute fulgimide monolayer prepared by ethylamine and C
30 Chapter 1. Experimental Details
1.4.4 Surface topography
In dilute monolayers the photochromes can form aggregates. Therefore ev-ery step of the sample preparation is controlled by atomic force microscopy (AFM).
A representative AFM image of topography of hydrogen terminated sil-icon after etching is shown in the left figure 1.11. The surface exhibits a staircase structure with flat terraces and atomic steps (0.31 nm high). The atomically flat terraces of around 100 nm width are visible all over the sur-face. The surface shows only small amounts of impurities. In the right panel a line profile is displayed for the black line (labeled 1) of the left fig-ure showing the different terraces and their height difference. The height variation on the surface is not significant. The root mean square roughness is 0.17 nm. 0 100 200 300 400 500 0 0.2 0.4 0.6 0.8 1 distance in nm height in nm
FIGURE 1.11: Topography AFM images of hydrogenated
silicon (left) and a profile line (right).
The morphology of the carboxylic acid monolayer is shown in1.12. The staircase structure of the silicon surface remains clearly visible, no signifi-cant change of the surface topography is detected. Therefore a good sur-face coverage is indicated that corresponds to the determined sursur-face den-sities of carboxylic acid monolayers. However, due to the monolayer the edges are smoother. Only a very small amount of impurities is present. The roughness (RMS) is similar as for the hydrogen terminated surface 0.18 nm. A representative AFM image of the topography of a dilute fulgimide monolayer (0.9·1014cm−2) is shown in figure1.13. The image was captured
1.4. Diluted photochromic monolayers 31 0 100 200 300 400 500 0 0.2 0.4 0.6 0.8 1 distance in nm height in nm
FIGURE1.12: Topography carboxylic acid monolayer (left) and profile (right).
after several switching measurements. The silicon staircases of 0.31 nm are still observable through the organic monolayer. The surface looks homoge-neous without residual of fulgimide or ethylamine aggregates. Local dif-ferences between the ethylamine and fulgimide are not observable due to the lack of resolution. The roughness (RMS) is about 0.20 nm.
0 100 200 300 400 500 0 0.2 0.4 0.6 0.8 1 distance in nm height in nm
FIGURE 1.13: Topography AFM images of a dilute fulgimide monolayer (left) and corresponding profile
32 Chapter 1. Experimental Details
1.5
Experimental setup and procedures
The photo commutation of fulgimide is measured on surfaces and in solu-tion. For a good monitoring of the switching kinetics the photochromes are switched in situ inside the infrared or UV-visible photo-spectrometer for the experiments on surfaces or in solution, respectively. The illumination setup used in the group before [58] is improved by more powerful LEDs, an fully automated control of the light pulse intensity and duration and better control of the polarizers. The illumination setup is adapted to the experimental conditions.
1.5.1 Experimental setup for photo switching on surfaces
The illumination setup for the photo isomerization on silicon surfaces can be seen in figure1.14. The surface can be illuminated by different LEDs with wavelengths of 365 nm (UV)3, 525 nm (green)4, or 590 nm (yellow)5.
LED specific lenses are fixed directly on-top of every LED to reduce the divergence of the beam. The light is moreover paralleled using a plano convex lens so that an area of the size of the measured sample (15 mm x 3 mm) is illuminated homogeneously. Furthermore, a red laser6of 655nm may be used to illuminate the surface. This laser is not fixed to the setup but separately mounted.
The LEDs can illuminate the surface in an angle of 45◦or 90◦.
1.5.2 Experimental setup for photo switching in solution
To monitor the photo-isomerization of photochromes in solution, 10 µM or
20 µM of solely C-Fulgimides are solved in 2ml of acetonitrile. They are stored in a closed cuvette of quartz glass with transparent sides. The cu-vettes are placed inside the UV visible photo-spectrometer7. The solution can be illuminated with the same LEDs as on surfaces. The LEDs have
3Nichia Corporation NVSU233A
4Nichia Corporation NCSG119T
5Nichia Corporation NCSA119T
6Roithner LaserTechnik GmbH, RLDH660-40-3
1.5. Experimental setup and procedures 33
FIGURE 1.14: Experimental illumination setup for the in situ irradiation inside the FTIR spectroscope (changed
schema, original schema from [58])
the same lenses mounted directly on-top of each LED but to ensure that the photon flux is homogeneous on a centimeter scale no additional lens is used.
1.5.3 Light flux calibration on surfaces and in solution
The experimental setup for the light flux calibration is depicted in figure 1.15. The forward current ∆I of a power supply is controlled by an ana-log voltage input ∆V that can be created by labview or the infrared spec-troscopy software OPUS. The forward currents then aliments the two visi-ble or UV LEDs. The photon flux of the different LEDs is calibrated using a silicon photo-diode8. The photosensitive area is a circle with a diameter of 1mm for the calibration of the 365 nm and 525 nm and 2mm for 590 nm and 655 nm. The photo current can be converted to a light flux using the respon-sivity of the photo diode of 0.05 A/W, 0.24 A/W, 0.35 A/W and 0.42 A/W for 365 nm, 525 nm, 590 nm and 660 nm, respectively. Systematical uncer-tainties of the photo diode and its responsivity used in the light flux cali-bration are in the same directions for all measurements and are therefore