Université de Sherbrooke
CALCIUM CONTENT REGULATION IN SKELETAL AND CARDIAC MUSCLE IN
PHYSIOLOGICAL CONDITIONS
by
Sandra Lopez Romero
Department of Pharmacology and Physiology
Thesis submitted at the Faculty of Medicine and Health Sciences in partial fulfillment of
the degree of Master in Physiology
Sherbrooke, Québec, Canada
April 2018
Members of the jury
Dr Paul Pape Department of Pharmacology - Physiology
Dr Robert Dumaine Department of Pharmacology - Physiology
Dr Guylain Boulai Department of Pharmacology - Physiology
II ABSTRACT
CALCIUM CONTENT REGULATION IN SKELETAL AND CARDIAC MUSCLE IN PHYSIOLOGICAL CONDITIONS
Sandra Lopez Romero
Department of Pharmacology and Physiology.
Thesis submitted at the Faculty of Medicine and Health Sciences in partial fulfillment of the degree of Master in Physiology. Faculty of Medicine and Health Sciences, Université de
Sherbrooke, Sherbrooke, Québec, Canada, J1H 5N4
Calcium is an essential element involved in various physiological processes such as cell apoptosis and muscle contraction. Several pathologies have been associated to a bad intracellular Ca2+ handling, which leads to changes in total Ca2+ concentration in the muscle ([CaT]WM). A new method has recently been developed in our laboratory (Lamboley et al., 2015; J. Gen. Physiol., 145(2):127153) to measure [CaT]WM in skeletal and cardiac muscle, which allowed us to make the following observations: 1) [CaT]WM in mouse extensor digitorum longus (EDL), increases as the mouse weight / muscle weight ratio increases; 2) [CaT]WM in the EDL (but not in the soleus) and in the left ventricle of agitated/active mice was almost twofold higher than that of control mice. We hypothesize that there is one or multiple physiological mechanisms regulating [CaT]WM in the muscle to satisfy force requirements. Our goals are to find a group of reproductible conditions involved in [CaT]WM regulation, as well as adapting the previously mentioned method, so faster measurements can be performed. 36 mice were randomly assigned to one of the following groups: 1) control mice (rested); 2) injected with epinephrine or saline; 3) trained in a treadmill; 4) injected with epinephrine or saline and trained in a treadmill. [CaT]Heart values of control mice were ~27 times higher than those reported by other authors. Our results indicate a decrease in [CaT]WM in all the muscles studied in those mice under epinephrine, probably because of α-adrenergic stimulation dominating over β-adrenergic stimulation. This decrease was more pronounced when the treadmill training was added to the injection, probably because more Ca2+ is being released from the SR, so more Ca2+ can be extruded to the extracellular space. We report an increase of [CaT]WM in the EDL when the treadmill training is applied alone, which might represent a Ca2+ upregulation mechanism by which the muscle builds up intracellular Ca2+ to satisfy force requirements. The channels responsible for Ca2+ entry are yet to be identified. Finally, the adaptations applied on the technique proved to be useful for performing faster measurements.
III
RÉSUMÉ
RÉGULATION DE LA TENEUR EN Ca
2+DU MUSCLE SQUELETTIQUE ET DU
MUSCLE CARDIAQUE EN CONDITIONS PHYSIOLOGIQUES
Par Sandra Lopez Romero, département de Pharmacologie et Physiologie
Mémoire présentée à la Faculté de Médecine et des sciences de la santé en vue de l’obtention du diplôme de Maitrise en Physiologie. Faculté de médecine et des sciences de la santé,
Université de Sherbrooke, Sherbrooke, Québec, Canada, J1H 5N4
Le Ca2+ est un élément se trouvant dans plusieurs processus physiologiques, parmi lesquels, la contraction musculaire et l’apoptose cellulaire. Plusieurs pathologies sont associées à une mauvaise régulation du Ca2+ intracellulaire. Une nouvelle méthode a été développée dans notre laboratoire (Lamboley et al., 2015; J. Gen. Physiol., 145(2):127153), afin de mesurer la concentration totale de Ca2+ dans le muscle ([Ca
T]WM) de souris, ce qui nous a permis de faire les observations suivantes : 1) Pour l’extensor digitorum longus (EDL), plus le ratio poids de l’EDL/poids de la souris augmente, plus la [CaT]WM est élevée et 2) la [CaT]WMdans l’EDL (mais pas dans le soléaire) et dans le ventricule gauche des souris agitées/actives était environ 2 fois plus élevée que celle des souris témoins. Notre hypothèse est qu’il existe un ou plusieurs mécanismes qui régulent la [CaT]WM du muscle pour répondre à une demande spécifique de force. Nos buts sont de trouver un ensemble de conditions reproductibles affectant la [CaT]WM,ainsi que d’adapter la méthode utilisée afin de la rendre plus efficace. 36 souris ont été distribuées aléatoirement en plusieurs groupes : 1) souris témoins; 2) injectées à l’épinéphrine ou au salin; 3) injectées à l’épinéphrine ou avec une solution saline et entrainées avec un tapis roulant. La [CaT]Cardiaque mesurée a été ~27 fois plus élevée que celle rapportée par d'autres auteurs. Nos résultats indiquent une diminution de la [CaT]WM dans tous les muscles étudiés dans le cas des souris injectées a l’épinéphrine, peut-être dû à la dominance de la stimulation α-adrénergique sur la stimulation β-adrénergique. Cette diminution a été plus prononcée quand l’entrainement dans le tapis roulant a été combiné avec l’injection, puisque plus de Ca2+ est relâché à partir du RS, donc plus de Ca2+ peut être extrudé au milieu extracellulaire. Nous avons aussi observé une augmentation de la [CaT]WMdans l’EDL, quand seul l’entrainement a été appliqué, ce qui pourrait représenter le mécanisme de régulation que nous cherchons. Par contre, les canaux impliqués n’ont pas encore été identifiés. Finalement, les adaptations appliquées sur la méthode nous ont permis de réaliser des mesures de Ca2+ plus rapidement.
IV
TABLE OF CONTENTS
Introduction 1 1. Muscle anatomy 1 1.1 Skeletal muscle 1 1.2 Cardiac muscle 42. Excitation contraction coupling 6
3. Calcium and muscle contractility of cardiac tissue 7 4. Role of calcium in heart failure and muscle dystrophy 8
5. Calcium measurements in the heart 9
6. The BAPTA method 10
7. Early results from our lab 12
Materials and methods 15
1. Animal ethics 15
2. Animal model 15
3. Animal handling 15
4. Composition of the solutions 15
5. Establishment of conditions to determine the effect of adrenergic stimulation or exercise on calcium content and muscle tissue preparation
16 6. Removal of extracellular calcium in heart samples 17
7. Absorbance measurements 18
8. [CaT]WM determination 19
9. Data analysis 19
Results 21
1. Adaptation of the BAPTA method to the use of a plate reader for absorbance measurements
21
1.1 Handling Cabackground coming from the plates and other materials 21
1.2 Replacing manual grinding with automatic grinding 24
1.2.1 Stainless Steel Balls 25
1.2.2 Teflon Balls 25
2. [CaT] measurements 27
3. Calcium content of the heart 31
4. Effects of epinephrine and exercise on [CaT] 31
4.1 Samples collected for each condition 31
4.2 Administration of an epinephrine or saline injection 31
4.3 Administration of an epinephrine or a saline injection combined with the treadmill training
32
4.4 Treadmill training 33
Discussion 38
1. Adaptation to the BAPTA method to the use of a plate reader for absorbance measurements
38
2. Calcium content of the heart 39
3. Effects of epinephrine and exercise on [CaT] 41
V
3.2 Administration of an epinephrine or a saline injection combined with exercise
42
3.3 Treadmill training 43
Conclusions 45
VI
LIST OF ILLUSTRATIONS
Figure 1: Organization of skeletal muscle.
2 Figure 2: Organization of myofilaments in a myofibril.
3 Figure 3: Portion of pericardium and the heart wall layers.
5 Figure 4: Comparison between [CaT]WM values obtained from right and left mouse
EDL. 23
Figure 5: Comparison of [CaT]WM values from samples coming from the same
region of the heart. 23
Figure 6: Cabackground measurements.
24 Figure 7: Manual and mechanical grinders.
24 Figure 8: Rusted stainless-steel balls and Teflon balls.
26 Figure 9: Comparison between Cabackground values of different set of balls.
26 Figure 10: fbackground results from a series of measurements of stainless-steel balls
and Teflon balls. 27
Figure 11. Example of a plot obtained from a [CaT]WM analysis in skeletal muscle.
29 Figure 12. Example of a plot obtained from a [CaT]WM analysis in heart muscle.
30 Figure 13. [CaT]WM of skeletal muscles EDL, Sol, BCP and BR and heart of control
mice, mice injected with either epinephrine or saline and mice injected with either epinephrine or saline and that underwent treadmill training.
VII
LIST OF TABLES
Table 1: Preliminary results from Dr. Pape’s laboratory.
14 Table 2: Summary of the data obtained.
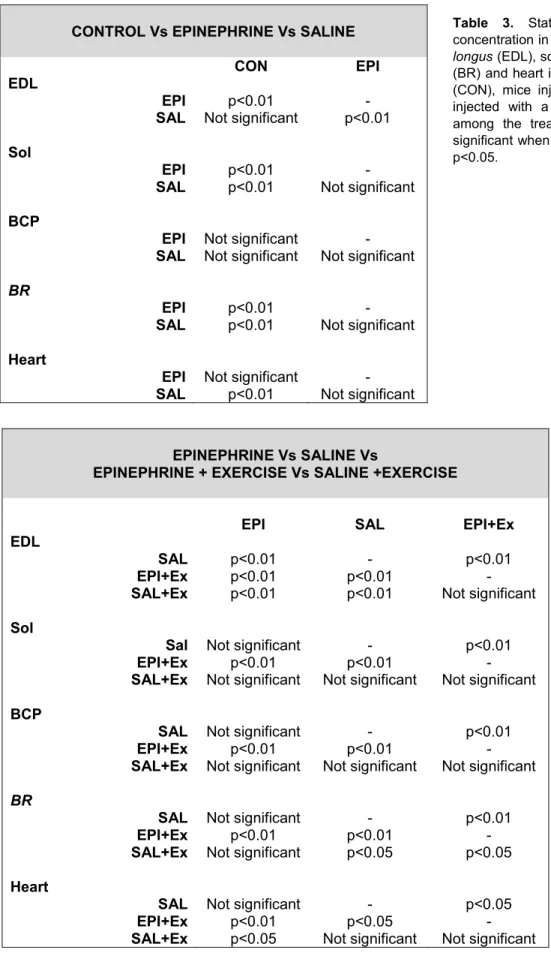
33 - 34 Table 3: Statistical comparison of total calcium concentration in the muscle of mouse
extensor digitorum longus (EDL), soleus (Sol), biceps (BCP), brachioradialis (BR) and
heart in three different conditions: control mice (CON), mice injected with epinephrine (EPI) and mice injected with a saline solution (SAL).
37
Table 4: Statistical comparison of total calcium concentration in the muscle of mouse
extensor digitorum longus (EDL), soleus (Sol), biceps (BCP), brachioradialis (BR) and
heart in four different conditions: mice injected with epinephrine (EPI), mice injected with a saline solution (SAL), mice injected with epinephrine and that went under treadmill training (EPI+Ex), mice injected with a saline solution and that underwent treadmill training (SAL+Ex).
VIII LIST OF ABBREVIATIONS AND SYMBOLS
0Ca/0Na Calcium-free / Sodium-free AAS Atomic absorbance spectroscopy
ACh Acetylcholine
ADP Adenosine diphosphate
AP Action potential
ATP Adenosine triphosphate
BAPTA 1,2-Bis(2-aminophenoxy) ethane-N,N,N′,N′-tetraacetic acid tetrakis
BCP Biceps
BR Brachioradialis
Ca2+ Free calcium
Cabackground Calcium coming from sources other than the muscle sample CaCl2 Calcium chloride
CaM Calmodulin
CaMKII Calmodulin kinase II Ca-BAPTA Calcium bound to BAPTA
CFPA-FMSS Comité facultaire de protection des animaux de la Faculté de médicine et des sciences de la santé
CholineCl Choline chloride
CICR Calcium-induced calcium release
CON Control group
DHPR Dihydropyridine receptor DMD Duchenne muscle dystrophy E-C coupling Excitation – contraction coupling
EDL Extensor digitorum longus
EGTA Ethylene glycol-bis(2-aminoethylether)-N,N,N′,N′-tetraacetic acid EPI Group of mice injected with epinephrine
EPI+Ex Group of mice injected with epinephrine and exercised in a treadmill
Ex Exercise group
HEPES 4-(2-hydroxyethyl)-1-piperazineethanesulfonic acid)
HF Heart failure
KCl Potassium chloride
LTCC L (long lasting) – type calcium channels
Mg2+ Magnesium
MgCl2 Magnesium chloride
MS Measurement solution
Na+ Sodium
NaCl Sodium chloride
NaOH Sodium hydroxy
NCX Sodium – calcium exchanger
Pi Inorganic phosphate
PKA Protein kinase A
PLB Phospholamban
RyR1 Type 1 ryanodine receptors RyR2 Type 2 ryanodine receptors
SAL Saline group
IX SDS Sodium dodecyl sulfate
SERCA Sarcoplasmic reticulum calcium ATPase
SLN Sarcolipin
SACs Stretch-activated calcium channels SOCs Store-operated calcium channels
Sol Soleus
SR Sarcoplasmic reticulum
TnC Troponin C
T-tubules Transversal tubules
[Ca2+] Free calcium concentration
[Ca2+]i Intracellular calcium concentration [CaT] Total calcium concentration
X
ACKNOWLEDGEMENTS
This project was financed by the NSERC and was fully developed in the Université de Sherbrooke. While not part of this thesis, I want to thank Robert Dumaine (Université de Sherbrooke) for the chance to do a rotation in his lab.
Special thanks to Eric Rousseau (Université de Sherbrooke), for his useful advice, Jean-Bernard Denault (Université de Sherbrooke), who allowed me to use the plate reader, Abby McDonell (Queen’s University), who worked in the preliminary data collection and Fatou Touré (Université de Sherbrooke) who has also been involved in the development of the technique used in this study. Finally, I am especially grateful to my supervisor, Paul Pape (Université de Sherbrooke), whose help, patience, attitude and disposition made this work possible.
1
INTRODUCTION
1. Muscle anatomy
The body contains three types of muscle tissue: skeletal, cardiac and smooth muscle. This thesis focuses on the first two types.
1.1 Skeletal muscle
The skeletal muscle includes not only skeletal muscle fibers (which will be properly introduced later in this section), but also blood vessels, lymphatic vessels, nerve fibers and connective tissue, which provides structure to the muscle and compartmentalizes the muscle cells (Tortora & Derrickson, 2012). Skeletal muscles are often connected to the bones by tendons, which are extensions of the connective tissue that conduct the tension generated by the muscles to the bones. In other cases, muscles might be bound to bones by aponeurosis, a tendon-like sheet also a result of the extension of the connective tissue. The most important structures of muscle tissue are muscle cells, also called muscle fibers (Fig. 1). Inside each skeletal muscle, muscle fibers are organized in fascicles separated by connective tissue (particularly collagen and reticular fibers) (Betts et al., 2013). The plasma membrane (known as sarcolemma) of a muscle fiber displays a series of invaginations called transverse (T) tubules filled with interstitial fluid (Tortora & Derrickson, 2012). The sarcolemma surrounds the cytoplasm of the muscle cell, also referred to as the sarcoplasm, that contains small striated structures called myofibrils that are composed by protein structures called myofilaments (Betts et al., 2013). The myofilaments are classified as thick or thin myofilaments. The main component of the thick filaments is myosin, which works as the motor protein in all types of muscle by using energy coming from ATP. In the case of the thin filaments the main component is the protein actin, that is equipped with myosin – binding sites, although two essential regulatory proteins can be also found: tropomyosin and troponin. The thick and thin filament are arranged in compartments called sarcomeres (Fig. 2), the functional units of myofibrils, delimited by regions with high protein content called Z discs. Since the filaments do not extend the entire length of the muscle fiber, the sarcomere contains zones with only one type of filaments, as well as zones where the two types of filaments overlap. The Z discs are located in the middle of the I bands, which are zones
2 containing only thin filaments, a fact that gives them a lighter color. Moving from the extremes towards the middle of the sarcomere, the thick and thin filaments overlap forming the A band, a much darker zone that represents the length of the thick filaments. In the center of the sarcomere, within the A bands, there is a smaller zone with only thick filaments, called the H zone. In the middle of the sarcomere, surrounded by the H zone and the A bands, supporting proteins that hold the thick filaments together form the M line, which represents the middle of the sarcomere (Tortora & Derrickson, 2012).
Figure 1. Organization of skeletal muscle. Fig. 1A shows the organization of muscle cells in fascicles. Muscle fibers are organized in fascicles separated by connective tissue (particularly collagen and reticular fibers). Fig. 1B shows a detail of a muscle fiber. The sarcolemma displays a series of invaginations called transverse tubules and it surrounds the sarcoplasm of the muscle cell which contains the myofibrils. The myofilaments of the myofibrils are also shown. Image corresponding to Fig. 10.2 in Tortora & Derrickson, 2012.
3 Among the organelles present in a muscle cell, an especially important one is a fluid-filled system of membranous sacs called the sarcoplasmic reticulum (SR) (Tortora & Derrickson, 2012). The SR is a specialized smooth endoplasmic reticulum which stores, releases and retrieves calcium (Betts et al., 2013). The Ca2+ fluxes across the SR membrane are primarily controlled by the type 1 ryanodine receptors (RyR1) and the SR Ca2+ ATPase (SERCA pump). The RyR1s are calcium channels located in the membrane of the SR that regulate the calcium outflow towards the cytoplasm (Calderon, 2014) and their open probability is increased by sarcoplasmic [Ca2+] among other factors (Diaz et al., 2005). Their activity is regulated by various proteins, such as FKBP12.6 (or calstabin 2), calmodulin (CaM), CaMKII, PKA and protein phosphatases 1 and 2 (Neef & Maier, 2013). The SERCA pump is a protein, also located on the SR membrane, that uses the energy derived from ATP hydrolysis to transport Ca2+ into the SR. RyR
1 are mechanically coupled to voltages sensors Figure 2. Organization of myofilaments in a myofibril. Fig. 2A shows the disposition of the thin and thick filaments in a myofibril and the different zones this disposition allows to differentiate. Fig.2B shows the same, only the filaments are more detailed. Image corresponding to Fig. 10.3 in Tortora & Derrickson, 2012.
4 called L-type calcium channels (LTCCs) or DHPRs (Franzini-Armstrong et al, 1994), transmembrane proteins/channels located in a region of the T-system called a triad. The triads are regions where one tubular element of the T-system is found between two terminal segments of SR (Porter and Palace, 1957).
The role of the LTCCs, the RyR1 and the myofilaments in muscle contraction will be covered later.
1.2 Cardiac muscle
There are some differences between skeletal and cardiac muscle tissue. Although most of the heart is myocardium, there are also other types of tissue present that is important to take into consideration. The importance of a good histological knowledge of the heart for my project will become clearer later.
The heart is an organ composed of multiple layers (Fig. 3). Protecting the heart, so in the most external part, we find the pericardium, a membrane composed of two elements. From the outer to the inner part of the heart, we find in the first place the fibrous pericardium, a membrane mainly composed of connective tissue. The second element is the serous pericardium, that encompasses two thin membranes separated by serum or pericardial fluid: the parietal layer, fused to the fibrous pericardium and the visceral layer, composed of mesothelium. The visceral layer is also considered to belong to one of the layers of the heart wall. The heart wall consists of three layers, the most external one being the epicardium, composed of the already mentioned visceral layer and a second layer of variable composition, where the adipose tissue is the predominant element. Blood and lymphatic vessel are also present in this layer. Internal to the epicardium we find the myocardium, a layer of striated muscle. Cardiac muscle cells are similar to skeletal fibers, only shorter and less circular and they exhibit branching. Neighboring fibers connect by thickenings of the sarcolemma, the intercalated discs. Finally, inner to the myocardium, the endocardium, a layer of endothelium placed over a layer of connective tissue, can be found (Tortora & Derrickson, 2012). Other kinds of tissue can be also found in the heart, such as the Purkinje fibers, present in the heart ventricles, right below the endocardium.
5 Regarding internal components, there are also some differences among skeletal and cardiac muscle that are relevant for us. As in the skeletal muscle, in cardiac tissue, we find regions where the junctional SR makes close contact with the T-tubule membrane (Eisner
et al., 2017). These regions are called dyads. However, in the heart, it is the inward influx
of Ca2+ through LTCC which triggers the opening of the type 2 ryanodine receptors (RyR 2) (Protasi, 2002), as explained in next sections. The SERCA pump is also present in cardiac muscle and its activity is primarily regulated by the protein phospholamban (PLB) which, in a non-phosphorylated state, inhibits SERCA activity (Periasamy et al., 2007).
The action potential generation and certain steps of the excitation – contraction coupling process in the heart also differ from those of the skeletal muscle. This will be discussed later in this section.
Figure 3. Portion of pericardium and the heart wall layers. The pericardium is the most external of the layers of the heart and it is composed of the fibrous pericardium and the serous pericardium. The serous pericardium is composed of the parietal layer and the visceral layer, which is also considered to be a part of the most external of the three layers of the heart wall, the epicardium. Inner to the epicardium, a layer of muscle tissue, the myocardium can be found. The innermost layer of the heart wall is the endocardium, a layer of endothelium placed over a thin layer of connective tissue. Partial image corresponding to Fig. 20.2 in Tortora & Derrickson, 2012.
6 2. Excitation contraction coupling
The term “excitation-contraction (EC) coupling” refers to the sequence of events from electrical excitation of the myocyte to the contraction of the heart (Bers, 2002) or the skeletal muscle. In the case of the skeletal muscle, a neurotransmitter, acetylcholine (ACh), released into the motor plate by the inferior motor neuron acts as an initiator for the action potential (AP) in muscle fibers (Calderon et al, 2014). The ACh binds receptors located in the plasmatic membrane of the muscle cell and, as a result, they undergo a conformational change that open a pore. Positively charged ions can now pass through into the muscle cell, causing a membrane depolarization. Thanks to this depolarization another type of channel, the voltage – gated sodium channel, opens. Na+ can now enter the muscle cell, bringing the membrane potential to positive values thereby triggering an action potential that propagates throughout the membrane and the T-tubules system (Betts et al., 2013). In the heart, APs are caused by a group of self-excitable muscle fibers that depolarized to the threshold. The AP starts in the sinoatrial node, where these autorhythmic cells are located, and propagates to the neighboring cells causing the opening of the voltage – gated Na channels, similar to the skeletal muscle. The arrival of the depolarization to a triad (in skeletal muscle) or a dyad (in the heart) causes a still unclear conformational change in the LTCC (Calderon et al, 2014), channels responsible for most of the calcium current across the sarcoplasm (Bers, 2002). As mentioned previously, in skeletal muscle the LTCC are in physical contact with the RyR1 (Franzini – Armstrong et al, 1994) and they act as voltage sensors involved in the opening of the RyR1, a process that can be monitored with a gating current termed intramembranous charge movement (Schneider & Chandler, 1973, Pape & Carrier, 2002). The most widely accepted coupling mechanism in cardiac muscle involves Ca2+ - induced Ca2+ - release (CICR) mediated by the LTCC current. According to this mechanism, 2 – 4 Ca2+ ions binding to a RyR
2 are enough to trigger Ca2+ release from the SR (Bers, 2002). In both cases (cardiac and skeletal muscle), the cytosolic [Ca2+] increases due to Ca2+ release from the SR. The presence of Ca2+ in the sarcoplasm triggers muscle contraction. In a filament relaxation state, regulatory proteins prevent interaction of myosin and actin. The regulatory protein troponin is conformed of 3 subunits: troponin C (TnC), the Ca2+ binding component; troponin T, the tropomyosin binding subunit and troponin I the inhibitory subunit, so-called because it binds to actin and inhibits actomyosin ATPase activity (Grabarek et al, 1992). The Ca2+ released into the sarcoplasm from the SR binds TnC, which causes the tropomyosin to move away from the myosin-binding sites on actin. When this happens, the contraction cycle begins: ATP is hydrolyzed to ADP + Pi (that remains bound to the myosin)
7 thanks to the action of an ATPase located in the myosin “heads”. This leads to a reorientation of the myosin “heads”. The myosin “heads” attach, then, to the myosin-binding site on actin forming the so-called cross-bridges and the phosphate group is released. In the next step, the site on the bridges where the ADP is still bound, opens. The cross-bridges rotate, and the ADP is released. This rotation causes the sliding of the thin filament past the thick filament, which shortens the length of the sarcomere. In the last step, another ATP comes to bind its binding site on the myosin causing the detachment of the myosin “heads” to the actin. (Tortora & Derrickson, 2012). As long as Ca2+ is present in the sarcoplasm, this so-called “cross-bridge cycle” keeps on working. Ca2+ must be removed from the sarcoplasm to allow relaxation. In the heart, this is mostly achieved by the closing of the RyR, the activity of the SERCA pump of the SR and the extrusion of Ca2+ towards the extracellular medium by the Na+/Ca2+ exchanger (NCX) (Eisner et al., 2017). The quantitative importance of SERCA pump and the NCX in calcium removal varies depending on the species (Bers, 2002).
3. Calcium and muscle contractility of cardiac tissue
As mentioned in the previous section, the presence of calcium in the sarcoplasm is crucial for muscle contraction. As shown in Fig 2 of Bers, 2002, there is a correlation between total calcium concentration in a cell (and, also, the free intracellular calcium concentration ([Ca2+]i)) and the force of contraction of the heart, increasing the force of contraction as the [Ca2+]i increases. There are several cytosolic Ca-binding proteins such as TnC (Ca2+ and Ca2+/Mg2+ binding sites), myosin, SERCA, calmodulin, ATP, creatine phosphate, parvalbumin (which is present only in fast-twitch muscle and responsible for its rapid relaxation) and other sarcolemmal sites (Bers, 2002). According to Bers (Bers, 2002), one of the main ways of changing the strength of cardiac contraction is by altering the amplitude or the duration of the Ca2+ transients. A correlation between SR calcium content and intracellular Ca2+ transients has been reported, with a decreased SR Ca2+ release in a low SR calcium content scenario (Bers, 2002). Because of the alleged implication of Ca2+ handling in some pathologies, such as heart failure and muscle dystrophy (discussed in the following paragraphs) there has been a growing interest in studying calcium behavior.
8 4. Role of calcium in heart failure and muscle dystrophy
Heart failure (HF) is a leading cause of death in Western civilization and, although there are different features characterizing this syndrome, some common ones are a prolongation of the QT interval, progressive depression of basal cardiac contractility and loss of inotropic reserve (Piacentino et al., 2003). Several attempts have been made to understand the mechanisms underlying HF but the cellular basis is not completely understood. It is generally agreed that much of the contractile deficit is due to an aberrant intracellular calcium handling, which leads to reduced Ca2+ transients (Piacentino et al., 2003; Lindner et al., 1998, Diaz et al., 2005, Bers et al., 2003, Neef & Maier, 2013). The most popular
explanation for reduced Ca2+ transients is a reduced SR Ca2+ content (Piacentino et al., 2003; Lindner et al., 1998, Diaz et al., 2005, Bers et al., 2003, Hobai et al., 2001), although the reason behind this reduction is still controversial. Some groups found enhanced NCX expression and activity, which would increase the extrusion of Ca2+ towards the extracellular compartment (i.e., Hasenfuss, 1988). A lower expression or activity (i.e., Hasenfuss, 1988; Meyer et al., 1995) of the SERCA pump, in some cases due to a lower phosphorylation of the phospholamban (i.e., Schwinger et al., 1999), has also been reported. Finally, an altered activity of the RyR2 leading to a calcium leak is thought to contribute to a reduced SR Ca2+ content.
Duchenne muscle dystrophy (DMD) has also been of interest for those studying calcium pathologies. DMD is a X-linked recessive disease affecting 2 – 3 per 10000 males in the world population (Yoshida et al., 2006) and characterized by a lack of dystrophin (a protein linking the sarcolemma with the cytoskeleton), which causes a series of events that are not completely understood and that lead to muscle weakness due to fiber necrosis and fibrosis (Fraysse et al., 2004). Although not unanimous, the hypothesis of an increase of the [Ca2+]i leading to a pathological condition referred to as “calcium overload” is the most accepted one when trying to explain the conditions leading to muscle destruction (Fraysse et al., 2004; Mazala et al., 2015; Yoshida et al., 2006). This increase in intracellular calcium would lead to the activation of certain proteins such as calpains (Belcastro, 1993), a family of proteases in charge of the degradation of certain intracellular structures such as the RyR (Singh et al., 2004) and the junctophilin-1 (Murphy et al., 2013), a protein that has a role in the proper formation and maintenance of the triad junction (Landstrom et al., 2014). Mazala et al. (2015) suggested that the weakness of skeletal muscle in DMD patients is due to E-C
9 coupling failure as a result of the degradation of these essential structures (Mazala et al., 2015).
Although the mechanism underlying a poor intracellular calcium handling in these pathologies is still to be described, measurement of [CaT] in the intracellular space has been of particular interest and several attempts have been made in order to establish accurate values for both skeletal and cardiac muscle.
5. Calcium measurements in the heart
As mentioned before, due to the importance of calcium in muscle contraction and intracellular signaling pathways (among others) and its implication in pathologies such as the ones described in the preceding section, the study of calcium behavior has been of great interest. Some of the characteristics researchers look at are calcium transients, intracellular calcium buffers and intracellular and extracellular free calcium and total calcium concentrations in skeletal and cardiac muscle tissue (denoted [CaT]). Kirbi et al. (1975, 1981) and Gissel & Claussen (1999) give some examples of [CaT] measurements in frog and rat skeletal muscle. Frog EDL calcium content was measured by equilibrating the sample with Ca45 (Kirbi et al., 1975). In the case of rat skeletal muscle, [Ca
T] has also been estimated using atomic absorbance spectroscopy (AAS), a technique where the sample is burned, and the calcium measured by its atomic absorbance spectrum (Kirbi et al., 1981; Gissel & Claussen, 1999). There are some issues related to the use of these techniques. The main issue regarding the technique involving Ca45 is the loss of calcium during the sample equilibration with Ca45 which would lead to an underestimation of the actual calcium content. In the case of the AAS, the process is long and the estimation of [CaT] can have associated an important error due to the calibration that the method requires. However, in general, there is an agreement regarding [CaT] in mammal skeletal muscle.
Several attempts have also been made to measure [CaT] in cardiac tissue. In 1995, Bassani and Bers performed total calcium measurements on chemically and mechanically isolated rat and rabbit cardiomyocytes (Bassani & Bers, 1995). In these experiments, total SR calcium content was estimated from the [Ca]i transients evoked by caffeine. The authors reported values of 114 µmol / L cytosol and 106 µmol / L cytosol for rat and rabbit, respectively. However, as explained in detail later in this document, our results (presented in this study) indicate that [CaT] in the heart is, actually, about 27 times higher. These results
10 were obtained by using a new method recently developed in our lab (Lamboley et al., 2015). Interestingly, calcium content of isolated fibers from frog skeletal muscle, agrees with [CaT] measured from whole muscle. It is also noted that [CaT] measured by Lamboley et al., (2015) also agrees with measurements with other methods, though there was a very large discrepancy between how much Ca2+ comes from the intracellular vs. the extracellular space.
6. The BAPTA method
This new method uses the difference in the UV absorbance spectra of the Ca-bound and Ca-free forms of the Ca-chelator BAPTA. A mouse muscle sample is manually homogenized with a solution referred to as measurement solution (MS), containing the calcium-chelator BAPTA and SDS, a detergent used to permeabilize biological membranes. The resulting product is centrifuged, and the supernatant recovered. At this point, the calcium present in the solution (mostly, coming from the muscle sample) is bound to the BAPTA which, when measured in a spectrophotometer, will give a specific absorbance spectrum that the authors call AM (the subscript referring to muscle). After the first
measurement, another calcium-chelator, the EGTA, is added to the sample and the absorbance is measured. Under the conditions presented by the authors, the EGTA has a higher affinity for the calcium than the BAPTA and it is added in a much higher concentration. Because of this, EGTA displaces essentially all of the calcium from BAPTA causing a change in BAPTA absorbance. This absorbance is called A0, the subscript
referring to 0 Ca bound to BAPTA. Finally, a high concentration of calcium is added in another aliquot of the original solution, which causes all the BAPTA to bound calcium and the absorbance is measured (A∞, the subscript referring to infinite calcium). A program was
developed to process the previously mentioned sets of absorbance data (AM, A0, A∞), as
well as a set of equations using the data obtained together with other parameters such as the muscle weight, the volume of the original solutions and the volume of the aliquots in order to calculate [CaT]WM. These equations were based on several assumptions explained in Lamboley et al. (2015) and they are based on the Lambert-Beers’s Law.
11 Equation AM is given by
(
)
(
)
l
CaB
CaB
B
CaB
CaB
A
A
background M T B background M CaB INTR M
−
−
+
+
+
=
]
[
]
[
]
[
]
[
]
[
(1)where AINTR is the intrinsic absorbance, [CaB]M and [CaB]background are the concentrations of
the Ca-bound form of BAPTA, when the calcium comes from the muscle (M) and from places other than the muscle (background), respectively,
CaB
and B are the extinction coefficients of the Ca-bound and Ca-free forms of BAPTA, respectively and l is the pathlength. Likewise,A0 and A∞ are given by
l
B
A
A
0=
INTR+
B[
T]
(2)l
B
A
A
=
INTR+
CaB[
T]
(3)where [BT] is the total BAPTA concentration and is determined by the difference between A∞ and A0 substituted and the difference between equations 2b and 2a (see Lamboley et al., 2015 for further explanation). From the two previous equations and assuming AINTR to
be the same in both, one can obtain the following equation
M
background M CaB CaB l A A + = − 0 (4)where
CaB -
B. [CaB]background is determined by performing the same kind ofmeasurement only with no muscle sample present (see Lamboley et al., 2015 for more information). Finally, calcium content of the muscle ([CaT]WM, the subscript WM standing for whole muscle), in units of millimoles of calcium per kilogram of muscle, can be estimated as
12
M muscle solution WM TCaB
W
V
Ca
=
(5)where Vsolution is the volume of MS added to the sample combined with the weight of the
muscle sample and Wmuscle is the weight of the muscle.
Equations 1, 2, 3, 4 and 5 correspond to equations 1, 2, 3, 5 and 17 in Lamboley et al. (2015), respectively.
One of the advantages of this new method is the capability of obtaining precise [CaT]WM estimations. However, this method is also time consuming, since the samples to measure need to be grinded manually (which takes around 7 minutes per samples) and the absorbance is measured with a spectrophotometer, which allows the measurement of one sample at a time. Because of this, we’ve more recently adapted the BAPTA method to the use of a plate reader, which allows the analysis of multiple samples at a time. We’ve also introduced a commercially available grinder to replace the manual grinder. A major part of my work during my M.Sc. training involved working out several issues associated with these modifications of the protocol, some of which are presented later.
7. Early results from our lab
By using this new method, Lamboley et al. (2015) studied the relationship among the calcium content of a given muscle ([CaT]WM) and the ratio between the weight of the mouse and the weight of that muscle. Interestingly, they noticed that [CaT]WM increases as the ratio mouse weight/ muscle weight increases, a condition found in the mouse fast-twitch muscle EDL and slow-twitch muscle soleus (Sol) (Lamboley et al., 2015). We, then, hypothesized that the muscle is “sensing” that a given level of force is required, and it is capable of upregulating its intracellular calcium load in order to give an appropriate response. This would, in this case, help small muscles (relative to the mouse weight) compensate for the force demands. The potential importance of this observation is the possible existence of one (or several) physiological mechanism(s) by which muscle cells upregulate their intracellular calcium content in other to respond to the functional demands of the tissue. This hypothetical mechanism might be important to improve our understanding of some Ca-related pathologies such as muscle dystrophy, where the muscular tissue is replaced by
13 connective tissue, which causes a muscle deficit. In this scenario, the muscle would try to compensate for the deficit by increasing intracellular calcium, which would lead to an enhanced apoptotic activity. This would worsen the original condition, which would cause more calcium to come into the cell, producing a vicious cycle situation. Understanding such a mechanism in skeletal muscle and its potential to lead to Ca-overloading is likely to have some relevance to other pathologies related to Ca-overload such as heart failure, Alzheimer’s disease and Huntington’s disease.
Rather than simple, this hypothetical mechanism could be a process involving several structures operating at many different levels. Because of this, our first aim was to find a set of reproducible conditions that would cause sort term changes in calcium content. Our main lead came from the results obtained from a set of experiments performed in our lab. They indicate a possible role for stress and/or exercise in increasing total calcium in muscle tissue (McDonell & Pape, 2015). When measuring [CaT]WM in skeletal and cardiac tissue, a difference was found between a group of control mice and a group of mice that were reported to look very agitated and that were constantly moving around and climbing inside of their cage. Table 1 shows measured [CaT]WM of both control and “agitated” groups. The authors reported a statistically significant difference among [CaT]WM between both groups in the case of the EDL and the Sol.
The goal of this study is to find a set of reproductible conditions involving adrenergic stimulation and exercise and affecting [CaT] in the skeletal and cardiac muscle. For this aim, we also propose an adaptation of the BAPTA method to the use of a plate reader to perform faster and more accurate measurements.
14
[Ca
T]
WM(
mmol/ kg wet muscle) RATIO Rested mice Active miceEDL Average 2.25 4.05 1.80 SEM 0.293 0.452 N 8 8 SOL Average 2.32 2.42 1.04 SEM 0.766 0.232 N 7 7 HEART Average 1.42 2.67 1.88 SEM 0.0313 0.251 N 10 10
Table 1. Preliminary results from Dr. Pape’s laboratory. [CaT]WM of
muscles extensor digitorum longus, (EDL), soleus (SOL) and
the heart was measured using the BAPTA method (Lamboley et al., 2015). Differences between a group of rested mice and a group of mice that were climbing inside of their cage and moving around (referred to as “active” mice) are shown. The ratio establishes the comparison between the two groups. Biophysical Journal Vol. 110, Issue 3. 60th Annual Meeting
of the Biophysical Society, Los Angeles, California, United States (99a). Data obtained by Abby McDonell.
15
MATERIALS AND METHODS
1. Animal ethics
All the procedures were conducted under a protocol approved by the CFPA-FMSS (Comité facultaire de protection des animaux de la Faculté de médicine et des sciences de la santé) of Université de Sherbrooke.
2. Animal model
A mouse model (C57BL/6 females, aged 64 – 72 days) was used in all the experiments preformed.
3. Animal handling
For all the experiments explained in this document, mice were anesthetized by isoflurane and, immediately after, euthanized by cervical dislocation.
4. Composition of the solutions
The composition of the main solution, referred to as measurement solution (MS) is as follows: 0.2 mM BAPTA, 2 mM HEPES, 2 mM MgCl2, 120 mM NaCl. The solution was titrated with NaOH to pH 8. Before being dried and weighted, muscles were generally placed briefly (~2 - 3 sec) in mammalian Ringer’s solution whose composition was as follows: 1.8 mM CaCl2, 5 mM KCl, 146 mM NaCl, 1mM MgCl2 and 10 mM HEPES titrated with NaOH to pH 7.4. A calcium-free sodium-free modified mammalian Ringer’s solution (5 mM KCl, 10 mM HEPES, 1 mM MgCl2, 146 CholineCl, 1 mM EGTA) was used to wash out the extracellular calcium in some cases (as described later). All modified physiological solutions were titrated with NaOH to pH 7.4 and the osmolarity was adjusted to 295 mosm.
Two solutions consisting of 0.3 and 0.6 mM Ca in MS were also prepared as a calibration system of the BAPTA method.
16 5. Establishment of conditions to determine the effect of adrenergic stimulation or
exercise on calcium content and muscle tissue preparation
36 mice were assigned to one of the following groups: control (CON), epinephrine injection (EPI), saline injection (SAL), exercise (Ex), epinephrine injection and exercise combined (EPI+Ex) and saline injection and exercise combined (SAL+Ex). N = 6 in each of the groups. The effect of the adrenergic stimulation was studied by the application of an epinephrine injection, as indicated by the name of the group of mice that underwent this treatment. Mice were injected intraperitonially with 0.017 mL/gram of mouse weight of a solution containing epinephrine at 12 mg/mL in 0.9% NaCl. This would give a final epinephrine concentration in the mice of 0.204 mg/mL. Saline injections consisted on 0.017 mL/g of 0.9% NaCl.
The effect of exercise on calcium content was tested by using a rodent treadmill (LE 8700 Series, Panlab Harvard apparatus). For determining the speed and duration of the exercise as well as for acclimating the mice to the use of the treadmill, two training sessions were performed about 1 week before the day of the test. The goal of Session 1 was to determine the maximal speed that each mouse can achieve. For that aim, the mouse was placed on the treadmill, and the speed was increased gradually until the mouse was not capable of keeping up with the speed. Session 2 took place 24h after Session 1. The goal was to determine the duration of the exercise and to allow further acclimation to the treadmill. For that aim, the speed was increased gradually to 80% of the maximal speed achieved during Session 1. The mice were then left to run for a maximum of 10 min. The time was noted when the mouse could no longer keep up with the exercise or at 10 min. The test, 7 days after Session 2, was done at 80% of the maximal speed achieved by each mouse, determined in Session 1, for a period of time corresponding to the time measured in Session 2, or longer.
It is noted that group CON did not undergo these two training sessions since we assume that there would be no difference between a control group that underwent this acclimation period and the one we used in our experiments, which was not trained. This seems like a reasonable assumption, since it seems that any hypothetical effect of physical activity on [CaT]WM should wear off in a matter of hours.
Group CON was brought to the laboratory from the animal facility and left for at least one hour to acclimate. After the acclimation, one mouse was euthanized, followed by the euthanasia of a second mouse before proceeding to the extraction of muscle for both mice.
17 The reason behind this is avoiding muscle drying, which might happen if all the mice were euthanized at the same time. EPI and SAL groups went through the same steps, with the addition of an epinephrine or saline injection 30 min prior to euthanasia. Group Ex followed the two training sessions and was euthanized immediately after the test. Groups EPI+Ex and SAL+Ex were injected with epinephrine and saline, respectively, 20 min prior to the 10-min exercise protocol.
Muscles extensor digitorum longus (EDL), soleus (Sol), biceps (BCP) and brachioradialis (BR), ranging from 4 to 21 mg, were collected from tendon to tendon within a range of 30 to 90 min after the euthanasia. The whole heart was also taken and weighted and three samples between 6 and 17 mg corresponding to the apex, the left ventricle and the atriums were collected. The skeletal samples were taken with as little tendon as possible without affecting the muscle. Both skeletal and cardiac samples, unless otherwise is indicated, were briefly placed in the mammalian Ringer’s solution for 2 – 3 seconds prior to being blotted dry in 1.5 mL polypropylene microcentrifuge tubes and weighted. The tubes contained 8 Teflon balls (1/8” PTFE Solid Plastic Balls, US Plastic), used for the homogenization of the tissue in MS. In all cases, the samples were frozen in the previously mentioned tubes for later processing. The homogenization was performed with 0.2 mL of MS added to the tube in an automatic grinder (BeadBug Microtube Homogenizer, Benchmark Scientific, US). 1.5 mL of MS were added after the homogenization to give a final volume of 1.7 mL, as well as SDS to give a ~0.5% concentration in the tube. The SDS is necessary to dissolve surface and T-system membranes as well as for protein denaturation. The final volume in the tube was calculated by weight, by subtracting the previously measured weight of the tube containing the grinding balls, assuming a density of 1 g/mL. Samples were centrifuged at 13300 rpm for 30 min at 6ºC to remove insoluble muscle components that would give a high intrinsic absorbance or light scattering.
6. Removal of extracellular calcium in heart samples
A sample of every heart used for the determination of the effects of adrenergic stimulation and exercise was left for 30 minutes in a Ca-free, Na-free modified mammalian Ringer’s solution and later dried, bottled and processed as described above.
18 7. Absorbance measurements
For the absorbance measures, a 96-well Glass Bottom MicroWell plastic plate (model MGB096-1-1-LG-L; MatriCal, Inc., Spokane, WA, USA) conforming the standards to be used in a Tecan Infinite® M1000 plate reader was used. In order to perform the measurements detailed below, different compounds need to be added to different aliquots of the same sample, so two wells of the plate were required for each muscle sample. The volume of each aliquot added to the well was 300 µL at the beginning of the first measurement. The previously mentioned Tecan Infinite® M1000 device was used to perform the measurements. The absorbance measurements are determined from changes of intensity of the light that passes through the glass bottom of the plates and the solution added to the well.
Four absorbance measurements are done on each set of samples, namely AM, A0, AS and
A∞. Two wells are used per sample to perform these measurements. AM and A0 are
determined in the first well. In the second well, AM is also measured, followed by AS andA∞.
Every measurement is repeated twice and is preceded by 30 seconds of shaking, followed by 2 min of pause. These parameters can be set in the plate reader. As explained earlier in this document, AM represents the absorbance of the solution obtained from the tubes after
the centrifugation with no further processing. A0 is determined by the addition of EGTA to one of the aliquots, in order to displace all the calcium from the BAPTA, as EGTA is added in a much larger concentration than BAPTA. The EGTA concentration in the well is 2 mM, which should be enough for the EGTA to complex > 99.5% of the total calcium present (see the Appendix section in Lamboley et al., 2015). AS is obtained by including a known amount
of calcium standard to the second aliquot, in this case, 0.03 mM Ca. This measurement is used as calibration of the method. A∞is determined by adding excess calcium (the final concentration in the well is 2 mM Ca) to the AS so that all the BAPTA present is in the
Ca-BAPTA form. A pair of wells is reserved to be filled with water, which will be used as blank. One of the rows of the plates (6 pairs of wells) are use for a second calibration system. They are filled with either 0.3 or 0.6 mM Ca MS and measured with the samples, being treated as a regular sample.
Some steps need to be followed before analyzing the samples in order to improve the accuracy of the measurements performed. Before the samples are measured, the calcium that is not coming from the samples (background Ca) needs to be eliminated as much as possible. We follow a cleaning protocol where the plate is rinsed 6 times with low resistance
19 water, filled with MS and left for 5 min (so the calcium present can bind the BAPTA present in the MS) and rinsed again 3 times with low resistance water. This protocol is applied before and after every measurement perform on the plate. The fraction of calcium that is not coming from the samples (Cabackground) is determined by filling the plate that will be later used to
measure the absorbance of the samples with MS and performing the measurements explained in the paragraph above (AM, A0, As, A∞), only with no muscle present. This set of
measurements is called before values and, as explained in Lamboley et at., (2015), the single measurements are referred to as Sm, S0, Ss and S∞. After the Cabackground is measured,
the plate is used to measure the samples. Cabackground is determined once again (after values)
in a last step.
8. [CaT]WM determination
Calcium content of the samples was estimated by following the formulae described briefly above and in detail in Lamboley et al. (2015). The main ones used are equations 1, 2, 3 and 4 in this document (see introduction), corresponding to equations 1, 2, 5 and 17 in Lamboley
et al. (2015).
As in the original paper, Cabackground values are determined by performing the same kind of
measurement only with no muscle sample present. However, as explained in the first subsection of the results in this document, since the method has been adapted to the use of the plate reader, the background is now specific for each set of wells of the plate. See the Results section for more details.
9. Data analysis
The results of each of the sample were studied individually and discarded in the case where a human error was spotted (i.e. one of the elements was not added during the absorbance measurements).
A one-way ANOVA test was run to compare the results obtained from the CON, EPI and SAL groups. Since this test shows if there is a statistically significant difference among treatments, but it does not indicate which pairs of treatments are different from each other, a post-hoc Tukey HSD Test was used to complete the analysis.
20 A one-way ANOVA test followed by a post-hoc Tukey HSD Test were also run to compare the results obtained from the EPI, SAL, EPI+Ex and SAL+Ex groups.
Finally, CON and Ex results were compared with a one-way ANOVA test.
For both tests, two significance levels are applied: p<0.05, which suggests a statistically significant difference and p<0.01, which suggests a strong statistically significant difference.
21
RESULTS
1. Adaptation of the BAPTA method to the use of a plate reader for absorbance measurements
Before the final protocol (described in the Materials and Methods section in this document) concerning the treatment and analysis of muscle samples in order to measure [CaT]WM was established, several issues had to be resolved in order to obtain accurate values. The following paragraphs summarize chronologically the steps followed and the difficulties faced in the process of the protocol development.
1.1 Handling Cabackground coming from the plates and other materials
It is mentioned in Lamboley’s publication (2015) that the calcium present in the solution has diverse origins. Although most of it comes from the muscle, calcium is also present in the materials used to perform the measurements and it is imperative to measure it. Determination of Cabackground has been one of the hardest tasks to accomplish.
The most likely sources of calcium contamination are the MS itself (calcium can leach from the materials used to prepare it) and the plates used for measuring the absorbances. Since getting rid of the calcium is not likely an option, the solution given to handling it was to measure it. For this aim, several methods were tested until the final protocol was described. Our first approach was to use a pair of wells filled with MS as background. These wells are treated as regular samples and the absorbance measurements are called Sm, S0, S∞ to be
consistent with the nomenclature used by the original authors. For convenience, binding is often expressed in terms of the fraction of BAPTA bound with calcium, which is denoted “f” by the authors of Lamboley et al., 2015. f is defined by the following expression:
0 0
A
A
A
A
f
M−
−
=
(6)22 This equation was determined from equations 5, 6 and 9 in Lamboley et al., 2015 and corresponds to equation 13 in the same document.
f can be defined as sum of two parts: calcium coming from the muscle and calcium coming
from the background, so it can also be expressed as follows:
background M
f
f
f
=
+
(7) where]
[
]
[
T M MB
CaB
f
(8) and]
[
]
[
T background backgroundB
CaB
f
(9)Another useful way of expressing fbackground is:
0 0
S
S
S
S
f
M background−
−
=
(10)where Sm, S0 and S∞, as previously mentioned, correspond to the same measurements
performed with the muscle samples, only with no samples present. Equations 7, 8, 9 and 10 of this document, correspond to equations 10, 11, 12 and 14 in Lamboley et al., 2015. Lamboley et al. (2015) reported similar calcium content for left and right EDL and soleus muscles belonging to the same mouse. When our preliminary results were obtained, the same analysis was done. However, our values looked very scattered (Fig. 4). Another type of data analysis came to confirm a problem with the background. For our experiments, 3 heart samples were collected, and each of them was split in two. The 6 samples were measured, [CaT]WM was calculated, and the results compared. Similar [CaT]WM values are expected from samples coming from the same regions of the heart. Fig. 5, however, indicates otherwise. Since the scatter of data indicated a problem with the method, several
25 1.2.1 Stainless Steel Balls
Another important source of Cabackground is the grinding balls. One of the properties of the
stainless-steel balls (Fig. 8A) that made them appealing for this study, is that calcium was not expected to leach from them. The protocol followed to obtain our preliminary results included the use of this type of balls. However, suspicion arouse that calcium might have been leaching from them and contaminating our samples, although some other components (such as the aluminum, which also binds to BAPTA) present in this type of balls might also be the cause of contamination. The first attempt to address this problem was to redesign the washing protocol used on the balls. For this aim, different groups of stainless-steel balls were rinsed several times in deionized water and left in different compounds. The fact of the stainless-steel balls being reused for every experiment (these balls are referred to as old stainless-steel balls) has also been questioned. Fig. 9 shows the calcium concentration measured from 1) new stainless-steel balls rinsed with deionized water, 2) old (already used) stainless-steel balls rinsed with deionized water, 3) old stainless-steel balls rinsed with deionized water and left in clean deionized water, 4) old stainless-steel balls rinsed with deionized water and left in MS and 5) old stainless-steel balls rinsed with deionized water, “grinded” with SDS during 1 min and later rinsed with a 0.9% NaCl solution. Unexpectedly, old balls showed lower calcium concentration than new balls, most likely due to the use of MS during the sample processing, which includes the Ca-chelator BAPTA. Among the old stainless-steel balls, those “grinded” with SDS and later rinsed with NaCl showed the lowest Cabackground levels. Although the washing protocol was initially changed to include the use of SDS + NaCl, the SDS caused the stainless-steel balls to get rusted. Despite successfully reducing Cabackground with stainless-steel balls, the appearance of rust (Fig. 9A) led us to
abandon the use of stainless-steel balls and try another type of balls. Other types of balls offered by the manufacture, including ceramic balls, also caused problems. We, therefore, decided to try Teflon balls, obtained from another source.
1.2.2 Teflon Balls
Since no washing protocol was suitable enough, another type of balls, Teflon balls (see Fig. 8B), was tested. Teflon is an appreciated material in our laboratory since calcium does not significantly leach from it. Two questions arouse concerning the usefulness of the Teflon balls: whether the amount of calcium leaching from them is negligible and whether they are
28
A0 – A∞ data (represented by the solid blue line). The green curve shows the least-squares
best fit of the AM –AS difference to the A0 –A∞ difference. The same applies to Fig. 11D,
where the nomenclature changes to SM, S0, SS andS∞, since no muscle sample is present.
According to Eq. 6, the fraction of BAPTA bound to Ca2+ (f) is given by (A
M –A0) / (A∞ – A0),
which is the best fit scaling factor giving the blue curve in Fig. 11B. Correspondingly, the best-fit scaling factor of (S0 –SM) / (S0 – S∞) (or (SM –S0) / (S∞ – S0)) gives fbackground (Eq. 10).
According to Eq.7, the difference between f and fbackground gives fM, the fraction of BAPTA
with Ca2+ coming from the muscle sample. f
M is then used to calculate [CaB]M ([CaB]M = fM x
BT) as explained in Lamboley et al., 2015).
Fig. 12 represents the exact same analysis than Fig. 11, only performed in cardiac muscle. Fig. 12A and B represent the results obtained from a mouse left ventricle [CaT]WM measurement and C and D correspond to a Cabackground measurement, obtained in the same
way as A and B only with no muscle present. Absorbance spectra are similar in both skeletal and cardiac tissue. However, intrinsic absorbance is higher in the case of the heart, as shown in the top left panel (Fig. 12A). Experiments performed with muscle sample but no BAPTA present, indicate that the intrinsic absorbance it is not altered by the addition of EGTA (needed for obtaining A0), calcium standard (needed for obtaining AS) or excess
calcium (added for the A∞ measurement) (Fig. 2 and associated text in Lamboley et al.,
2015). This justifies the assumption that the intrinsic absorbance cancels out in the different spectra (i. e., Eq. 4).
31 3 Calcium content of the heart
Calcium content of mice left ventricle was measured. From each heart excised, two samples of the left ventricle were measured and their [CaT]WM values averaged. We determined [CaT]WM to be 2.55 mmol/kg wet muscle (n = 6, SEM = 0.21).
As mentioned in the materials and methods section, an attempt was made to wash out the extracellular calcium in order to measure the intracellular calcium and, like this, improve the accuracy of our determination. One samples from each heart was left for 30 min in a Ca-free, Na-free solution. The Na-free solution is aimed to stop the activity of the NCX. The measured [CaT] was 1.27 mmol/kg wet muscle (n = 7, SEM = 0.05). Assuming all the calcium in the extracellular solution was removed and there was no loss of intracellular calcium, this result indicates that only half of [CaT] in the heart solution is intracellular.
4 Effects of epinephrine and exercise on [CaT]
Table 2 shows a summary of the average [CaT] values of the muscles studied obtained under the different conditions applied.
4.1 Samples collected for each condition
Left and right EDL, Sol, BCP, BR and the heart were collected from 6 mice/condition.
4.2 Administration of an epinephrine or saline injection
[CaT]WM values obtained from control mice, mice injected with epinephrine and mice injected with saline were compared. An epinephrine injection caused a [CaT]WM reduction in all the muscles studied, although, as detailed later, this reduction was not significant in all the cases. On the other hand, a saline injection also led to a decrease of the [CaT]WM in all the muscles studied, with the exception of the EDL (Fig 13A, Table 2).
Concerning the EDL, there is a statistically significant difference between the group injected with epinephrine and both the group injected with saline (p<0.01) and the control group (p<0.01), being the [CaT]WM values lower in the epinephrine group. There is no significant difference between the group injected with saline and the control group. For both the Sol
32 and the BR, both the epinephrine and the saline injections caused a statistically significant [CaT]WM reduction, compared to the control group (p<0.01 in both cases). However, there is not a significant difference between the epinephrine and the saline groups. In the case of the BCP, no significant difference was found after neither of the two injections. In the heart, a saline injection caused a significant reduction, when compared to the control group (p<0.01), whereas, unexpectedly, no difference was found between the group injected with epinephrine and both the saline group and the control group (Table 3).
4.3 Administration of an epinephrine or a saline injection combined with the treadmill training
To determine the short-term effects of adrenergic stimulation when combined with exercise, [CaT]WM values obtained from the mice injected with epinephrine, the mice injected with saline, the mice injected with epinephrine and exercised, and the mice injected with saline and exercised were compared among each other. For all the muscles studies, the group injected with epinephrine and exercised showed a significant reduction of [CaT]WM when compared to the groups that were just injected with either epinephrine or saline (Fig 13B, Table 2). Regarding the group that was injected with saline and exercised, [CaT]WM values were always lower when compared to the groups that were just injected with either epinephrine or with saline, although this difference was less drastic and, in some cases, not significant (Fig 13B, Table 2).
Regarding the EDL, the fact of combining either an epinephrine or a saline injection with the treadmill training caused a statistically significant reduction of [CaT]WM, when compared to the administration of the injections alone (p<0.01 in all the cases). In the soleus and the BCP, the combination of an epinephrine injection with the exercise reduced [CaT]WM significantly, when compared to the groups that were just injected with either epinephrine (p<0.01 in both cases) or saline (p<0.05 in the case of the soleus and p<0.01 in the case of the BCP). However, no difference was found between the groups injected with a saline solution and exercised and the groups that were just injected. Concerning the BR, the combination of an epinephrine injection with the exercise reduced [CaT]WM significantly when compared to the groups that were just injected with either epinephrine or saline (p<0.01 in both cases) and, contrary to other muscles, a significant reduction was also found between the group injected with saline and exercised and the group injected with saline (p<0.05). Interestingly, [CaT]WM values of the group injected with epinephrine and exercised were


![Table 1. Preliminary results from Dr. Pape’s laboratory. [Ca T ] WM of](https://thumb-eu.123doks.com/thumbv2/123doknet/2786147.65652/24.918.149.552.105.524/table-preliminary-results-dr-pape-laboratory-ca-wm.webp)
![Table 2. Summary of the data obtained. The table shows muscle and mouse weight, ranges of [Ca T ] WM values, average [Ca T ] WM](https://thumb-eu.123doks.com/thumbv2/123doknet/2786147.65652/44.918.92.865.145.1009/table-summary-obtained-muscle-weight-ranges-values-average.webp)