BIOCHEMICAL AND GENETIC STUDIES ON REVERTANTS OF ADENOVIRUS TRANSFORMED RAT CELL LINES RESISTANT TO
METHYLGLYOXAL BIS-(GUANYLHYDRAZONE)
BY
Mabel Theresa Rodrigues
A thesis submitted ta the Department of Microbiology in partial fulfillment of requirements for the
degree of Doctor of Philosophy (Ph.D)
Faculté de Médecine Université de Sherbrooke
Sherbrooke, Québec 1989
Permission has been granted to the National Library of Canada to microfilm this thesis and to lend or sell copies of the film.
The author (copyright owner) has reserved other publication rights, and neither the thesis nor extensive extracts frorn it may be printed or otherwise reproduced without his/her written permission.
L'autorisation a 'té accordée
à
la Bibliothèque nationaledu Canada de microfilmer cette thèse et de prêter ou de vendre des exemplaires du film.
L'auteur (titulaire du droit d'auteur) se réserve les autres droits de publication: ni la thèse ni de longs extraits de celle-ci ne doivent être imprimés ou autrement reproduits sans son autorisation écrite.
ABSTRACT
The rnechanisrn of reversion of adenovirus-transformed cells in response to the selection of drug-resistant variants resistant to rnethylglyoxal-bis-(guanylhydrazone) was studied. The results presented here suggest that there is no direct relationship between developrnent of MGBG resistance and cellular detransformation. All MGBG resistant variants displayed the transformation revertant phenotype in that these cell lines (i) had a flat rnorphology, (ii) exhibited anchorage-dependence, (iii) did not produce turnors in nude mice and (iv) possessed the viral transforming genes integrated into the cellular genome.
The present study deals principally with investigating the basis of drug-resistance and the cause of detransformation in these MGBGR-variants. Drug resistance in these cells may have resul ted from two possible events: (a) the target enzyme, SAM-decarboxyl ase, may be altered leading to development of resistance to MGBG, or (b) the cell has an altered drug transport system. None of the MGBG-resistant variants were altered in the SAM-decarboxylase. By contrast, analysis of the transport mechanism showed a decreased influx of MGBG, and no change in the efflux rate. These resul ts demonstrate that these cells are transport mutants that are defective in MGBG uptake.
Detransformation could have been brought about through three different ways: (a) loss or inactivation of the adenovirus transforming genes, (b) mutation in a cellular gene required for transformation and (c) activation of a cellular tumor suppressor gene. Three of the cell lines studied came under category (a): The G4F cell line had lest the integrated viral transforming genes. The G2a and G5 cell lines had undergone a mutation which prevented the transcription of the viral transforming genes. None of the cell lines exhibited the properties of a cell line expected of those in category (b). Finally, a single cell line, G2 exhibited the properties of a cell line with an activated
tumor suppressor gene. This conclusion was based on the
following experimental observations: ( 1) G2 cells expressed a
biologically active Ela transforming protein as shown by ( i) resistance to retransformation by Ela plasmids, ( ii) positive complementation of an Ela deletion mutant, and (iii) Ela-mediated tumor necrosis factor cytolysis, and (2) somatic cell hybridization between the parental transformed F4 cell line and the detransformed G2 cell line resul ted in hybrids which were
non-tumorigenic. These hybrids had about double the number of
chromosomes, carried bath parental drug-resistance markers and expressed Ela proteins.
Thus, the G2 cell line belongs to the class of recently reported revertants that result from activation of a dominant transformation-suppressor gene(s).
ACKNOWLEDGEMENTS
I would like to express my sincere appreciation to Dr. Joseph M. Weber for his guidance and encouragement during the course of this study. It has been an extremely stimulating and
exhilerating learning experience. I am also grateful to Dr.
Joseph Horvath and Dr. Arvind Chopra for their help and expert advice.
I am grateful to Patrick Dion, Alain Houde, Johanne
Fleurent, Martine Hamel, Martin B. , and staff members of the
Département de Microbiologie for their friendship and discussions.
I am also grateful for the capaple technical assistance of Mme Lise Imbeault, Andre Lacroix and Serge Dorval.
I would like to sincerely thank my family, The Rodrigues, for their encouragement and belief in me during my studies. I wish to dedicate this thesis to them.
The financial assistance of the Ministère de L'Education du Québec, the studentship granted to me for. one year from the Université de Sherbrooke is gratefully acknowledged.
My sincere thanks especially to the members of the jury: Dr. Martha Brown (University of Toronto), Dr. Danielle Bourgaux-Ramoisy and Dr. Darel Hunting for taking the time to read and comment on this thesis.
TABLE OF CONTENTS
Page
ABSTRACT. . . . . i
ACKNOWLEDGEMENTS. . . . iii
TABLE OF CONTENTS. . . . i V LIST OF TABLES... vii
LIST OF FIGURES. . . • • . . . • . . . . viii
LIST OF ABBREVIATIONS. . . ix
INTRODUCTION. . . • 1
CARCINOGENESIS. . . . • . . . . 1
1. Cellular genes involved in transformation.... 1
2. Reversion of transformation... 3
STUDIES WITH ADENOVIRUSES... 5
1. Cells transformed by adenoviruses... 6
2. The adenovirus genome... 6
3. The transforming region El... 9
a. ElA region... 9
b. ElB region... 13
4. Transforming revertants selected with drugs... 15
DRUG RESISTANCE . . . . 16
1. Methylglyoxal-Bis(guanylhydrazone) (MGBG) ..•.. 16
a. Structure - activity relations of MGBG... 16
b. Properties and function of MGBG... 18
c. Cellular uptake of MGBG... 18
2. Polyamine biosynthesis pathway... 19
a. s-adenosylmethionine decarboxylase... 19
TUMOR NECROSIS FACTOR... 21
A. History of TNF. . . . . . . . . . . . . . . . . . . . . . . . . . . . 21
B. Isolation and structure of TNF... 21
c. Studies on the activities of TNF... 23
1. cytotoxic activities... 23
2. Antiviral activity... 24
Page
RESEARCH OBJECTIVES. . . • . . • . . . . • . . 2 5
MATERIALS AND METHODS. . . . • . . . • . . . • . 2 8
1. CELLS... 28
a. Growth conditions... 28 2 • ISOLATION OF MUTANTS. . . . • . . . 2 8
A. Mutagenesis and selection of mutants... 28
I. Ethylmethane sulfonate (EMS)
mutagenesis. . . 29
II. Retroviral insertion mutagenesis.... 29 III. DNA transfection ...•..••....•. 29 IV. Retransformation... 30
3 • MGBG RESISTANCE. . • . • • • . • . • . . . • . • . . . 3 0
4. PROPERTIES OF THE TRANSFORMATION MUTANT CELLS. 31
I. II. III. IV. V. Growth in soft-agar ...•.•. Tumorigenicity ... . Karyotype analysis ...•...•.. SAM decarboxylase activity ..•.••••. 1. Preparation of cell extracts .. .
2. Enzyme assay ... .
( 14c) MGBG uptake and efflux studies
31 31 31 32 32 32 33 5. FUNCTIONAL INTEGRITY OF THE ElA PROTEINS .•... 34
a. Virus... 34
b. Virus infection... 34 c. Preparation of samples . . . • . . • . . • . • 3 5 d. Horizontal lysing agar gel
electrophoresis... 35 e. Southern blotting analysis .•..•.•••... 36 f. Preparation of probes... 36 g. conditions of prehybridization and
hybridization of blots... 37 6. TUMOR NEC~OSIS FACTOR CYTOTOXICITY ASSAY ..•.• 37
a. In situ RNA dot blot... 38
b. Probes . . . . . . . . . . . . . . . . . . . . . . . . . . . . . . . 3 8
c. Prehybridization and hybridization
conditions. . . 3"8
MATERIALS AND METHODS (Continued) Page
7. DOMINANCE TEST OF THE CELLULAR MUTATION IN
REVERTANT CELLS BY SOMATIC HYBRIDIZATION ....• 39
a. Deriv~tion of parental NeoR and
Hygro cell lines... 39 b. Cell fusion with polyethylene glycol... 40 c. Tumorigenicity assay ..•.••..•..•••...•.• 40
d. Karyotyping . . . 41
e. Immunoprecipitation ...•...••.... 41
RESULTS . . • • . . • • . • • . . . • . . . • . . . • . • . . . . 4 2
1. Isolation of MGBG - resistant variants •...• 42 A. The G2 cell line • . . . • • . • . • . . . . • • • • • • • • 42
B. Selection of other MGBG-resistant
variants. . . • . . . . • . • . . . • . . . . ·4 3 2. Biochemical characterization of MGBG-resistant
cel 1 1 in es . . . . . . . . . . . . . . . . . . . . . . . . . . . . . . . . . . . 4 5
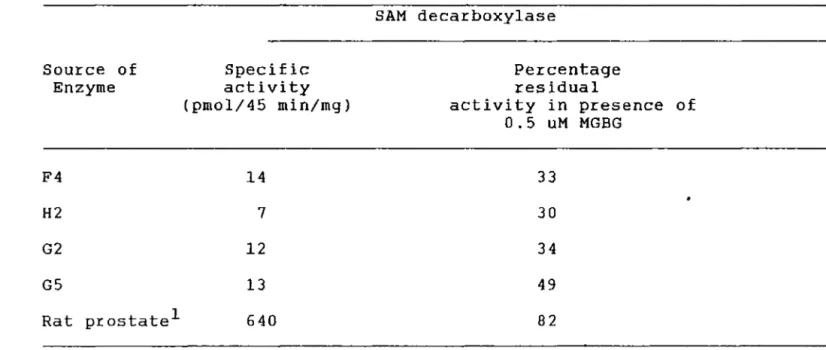
A. Effect of MGBG on SAM decarboxylase
activity... 46
B. Transport of MGBG ... 46 3. Transformation related properties of the MGBG
-resistant variants ...•... 52 A. Transformation properties .••.•.•... 52
B. Integrity of ElA oncoproteins in the
revertant cel 1 s . . . 5 3
1. Complementation analysis using ElA
deletion mutants. ...•.. 53 2. Tumor necrosis factor sensitivity
assay. . . . . . . . . . . . . . . . . . . . . . . • . . • • . . . 54
4. Genetie analysis of the affected cellular gene
in the revertant cells ...•..•.•... 62 A. Characterization of the revertant phenotype
by somatic cell hybridization. ...• 62
DISCUSSION. . . . . 69
REFERENCES • . . . 7 8
APPENDIX 102
LIST OF TABLES Table No.
1. Properties of MGBG - resistant variants 44
2. SAM decarboxylase activity and its inhibition
by MGBG 47
3. Uptake of (3H)sperrnidine by the MGBG
-resistant cells 50
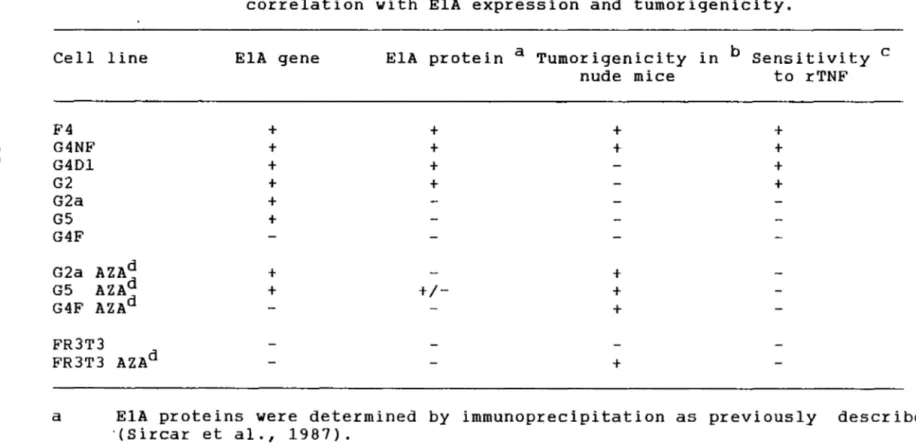
4. TNF sensitivity of transformed and revertant cell lines. Correlation with ElA expression
and tumorigenicity 57
5. Properties of hybrid cells obtained by fusion of the G2 revertant cell line with the
normal FR3T3 or the Ad2-transforrned F4 cell
lines 65
LIST OF FIGURES Figure No.
1. Map of the Ad2 genome integrated in F4 cells 7
2. Map of the Ad2 genome with two functional
demains (Early and Late) 8
3. The functional demains of the ElA proteins 11
4. Chemical structures of spermidine and
methylglyoxal bis(guanylhydrazone) (MGBG) 17
5. MGBG uptake 48
6. MGBG efflux 51
7. Complementation analysis of MGBG-resistant
variants 55
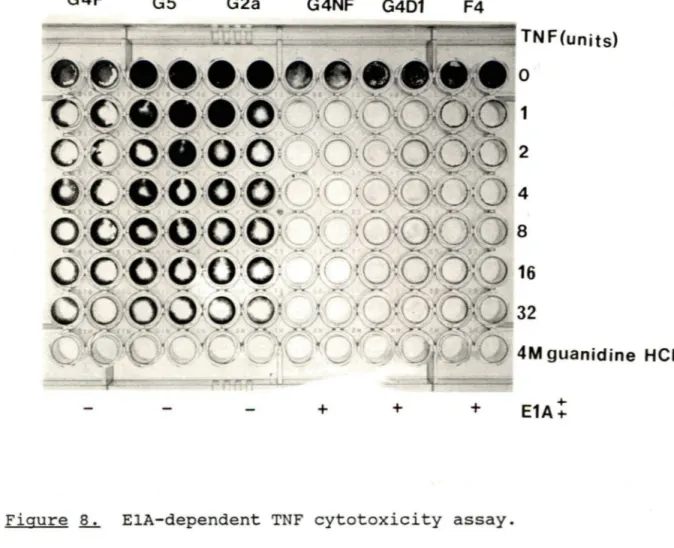
8. ElA - dependent TNF cytotoxicity assay 58
9. Effect of rTNF on the transcription of ElA 60
10. Effect of rTNF on the transcription of c-myc 61
11."Histogram illustrating chromosome number in
the parental and hybrid cells. 64
12. Immunoprecipitation of ElA proteins from F4,
G2 and hybrid cells. 68
Ad2 Ad5 Ad7 Adl2 azac BSA cm Ci DMEM DNA DNase dATP dCTP dGTP dTTP EGF EMS EDTA Et Br FFU Fig. g mg ng ug h 3H Kd M pM mM UM min MGBG MOI ml MW N nm PAGE PEG PFU p. i. R RB RNA RN a se rpm
~
5
s-met
ABBREVIATIONS adenovirus serotype 2 adenovirus serotype 5 adenovirus serotype 7 adenovirus serotype 12 5-azacytidinebovine serum albumin centimeter
Curie
Dulbecco's modified Eagle's medium deoxyribonucleic acid deoxyribonuclease deoxyadenosine triphosphate deoxycytidine triphosphate deoxyguanosine triphosphate deoxythymidine triphosphate epidermal growth factor ethylmethane sulfonate
ethylene - diamine tetraacetic acid (disodium salt)
ethidium bromide focus forming units figure gram milligram nanogram microgram heur (s) tritiated kilodalton molar picomolar millimolar micromolar minutes methylglyoxal bis(guanylhydrazone) multiplicity of infection milliliter molecular weight Normal nanometer polyacrylamide-gel electrophoresis polyethylene glycol
plaque forming units post-infection
amine acid residues /or (superscript) - resistance retinoblastoma gene
ribonucleic acid ribonuclease
revolutions per minute Svedberg units
SAM SAMDC SDS
ssc
TBE TCA TNF Tris V wt w/v s-adenosylrnethionine s-adenosylrnethionine decarboxylase sodium dodecyl sulfatestandard saline citrate (0.5 M NaCl + 0.015 M sodium citrate) Tris borate EDTA (0.09M Tris + 0.09M borie
acid + 2.5rnM EDTA, pH 8.2) Trichloroacetic acid
Turner necrosis factor
tris (hydroxyl rnethyl) arninornethane volt(s)
wild type
weight by volume
How often have I said to you, that when you have eliminated the impossible, whatever remains however improbable must be the truth -Sherlock Holmes
INTRODUCTION
CARCINOGENESIS
It is well established that malignant cell transformation is a multistep process (Klein and Klein, 1985). Each step in the process involves the interaction of one or more activated or constitutively expressed oncogenes and appropriate cellular genes (Spandidos and Anderson, 1987). More than one pathway leads to transformation of the cell and each pathway is controlled by a differentiation program which the oncogenes must alter or black
(Alt et al.,1981; Weissman and Aaronson, 1983).
In spite of the immense knowledge that has been accumulated about oncogenes and the proteins they specify, little is known about cellular interactions of the proteins and the mechanism(s) by which they transform cells (Bishop, 1983).
1. Cellular genes involved in transformation
There is evidence suggesting cellular genes interact with viral oncogenes (in this study the adenoviral El genes) to bring about the transformed phenotype (Duesberg, 1987; Sachs, 1987), and there are cellular genes capable of suppressing oncogenes. There is compelling evidence showing the existence of cellular genes capable of regulating or suppressing the transf ormed state
Murphree and Benedict, 1984; Sager, 1986; Weissman et al., 1987). The strongest experimental evidence supporting the concept that malignant cell transformation involved the expression of defects in a cellular mechanism was derived from studies in which fusion of tumor cells with normal diploid cells resulted in isolation of hybrids that were suppressed in their tumorigenic potential. This implies normal chromosomes from nontumorigenic cells contain elements capable of suppressing tumorigenicity
(Harris et al., 1969; Klinger and Shows, 1983; Sager, 1986;
stanbridge et al., 1982; Weissman et al., 1987) . Recently,
molecular cloning of the DNA sequences that suppress tumorigenicity confirmed the existence of such genes (Kitayana et al., 1989; Noda et al., 1989; Schaefer et al., 1988). A loss of function rather than a dominant gene activation or alteration (as with oncogene studies) appears to be associated with malignancy progression. Several approaches were examined in an attempt ta illustrate the existence of this regulatory function (Bassin and Nada, 1987). Changes in cellular gene expression following transformation has been one of them (Hinds et al., 1987, Johnson et al., 1987, Leof et al., 1987, O'Hara et al., 1987, Owen and Ostrowski, 1987, Simon et al., 1987). Another approach has been the isolation of cryptic transformants i.e. normal cell clones which fail ta respond to the oncogenic influence of viral transforming genes (Ryan et al., 1985). Sorne investigators have looked for cellular proteins which bind directly to viral oncoproteins (Harlow et al., 1986, Yee and Branton, 1985) and have attempted the isolation of transformation revertants which
descended from a transformed cell and lack at least one of the transformation properties. This approach has been used in the present study and is described below.
2. Reversion of transformation
Cells in the transformed state are def ined by certain characteristics such as changes in altered growth and morphology, acquired anchorage independence, ability to grow in semi-solid media and to produce tumors when inj ected into animals. Very little is known about the mechanism(s) by which the transforming agents alter essential cell metabolism required to maintain the "normal" cellular growth state. One way of investigating the alterations between the transformed state and the normal state is to isola te from a culture of malignant cells, flat revertant cells that lack at least one of the properties of a transformed cell from which it is descended (Vogel and Pollack, 1974).
This promising approach can be used most successfully in characterizing cellular genes that are involved in preventing or antagonizing cellular transformation i.e. selecting cells capable of suppressing the transforming activity of a defined oncogene. This genetic approach was accomplished in the past by cloning rare flat revertants arising during culture or by selecting cells surviving cytotoxic drug treatment under conditions favoring the growth of transformed cells (Bauer et al. , 1987; Noda et al., 1983; Norton et al., 1984; Ryan et al., 1985; Samid et al., 1987; Stephenson et al., 1973; Vogel and Pollack, 1974; Talbot et al., 1988) or by using a fluorescence activated sorting technique
(Haynes and Dowing, 1988; Zarbl et al., 1987). Sorne of the above mentioned procedures resulted in three classes of flat revertants isolated and characterized from cells transformed by specif ic
oncogenes. The f irst class of revertants resul ted from
inactivation of the specific oncogenes (Cho et al., 1976; Fischinger et al., 1972; Greenberger and Aaronson, 1974; Mathey-Prevot et al., 1984; Maruyama et al., 1981; Ozanne and Vogel, 1974; Varmus et al., 1981; Vogel and Pollack, 1974; Wilson et al., 1986). Those in the second class were due to inactivation of cellular target genes (Inoue et al., 1983; 1989; Norton et al., 1984; Ryan et al., 1985; Sacks et al., 1979; Stephenson et al., 1973; Talbot et al., 1988; Zarbl et al., 1987) , or
co-operating genes (Katz and Carter, 1986) required for
transformation by a specific oncogene. The third type of
revertants resulted from activation of dominant transformation suppressor genes (Nada et al., 1983; Kuzumaki et al., 1989). Of the three classes only the second or third class revertants are of great value for elucidating the mechanism(s) or the existence of common pathways of cellular transformation (Bassin and Nada, 1987) as they are target-related, resistant to retransformation and continue to express the transforming protein(s). These cells, phenotypically normal or quasi-normal, are expected to conta in the mutations in either the cellular target gene(s) in question or in oncogene suppressor gene(s).
STUDIES WITH ADENOVIRUSES
Biochemical studies with cells transformed by oncogenic viruses has extended our basic knowledge of cell growth regulation and tumorigenesis. Since the discovery that certain species of adenovirus were oncogenic when injected into newborn hamsters and rats (Huebener et al. 1962; Trentin et al. 1962) much knowledge has accumulated about the structure and expression of adenovirus transforming genes. Adenoviruses are viruses of human origin and are known to be disseminated in the human population, particularly in young children, causing gastroenteritis, a wide variety of respiratory illness and frequently latent infections
(Israel, 1962; Yabe, 1964; Rosen, 1960). Although, it is
extremely unlikely that human adenoviruses are causative agents of cancer in man, they have the ability to transform cells and, as a resul t, are considered to be powerful tools to study mammalian cell transformation. In addition to delineating the process of transformation of normally growing cells to tumor cells, the adenoviruses were extensively used as model systems to study the organization and expression of eukaryotic genes. Many properties unique to eukaryotic organisms were in fact observed during studies with DNA viruses. Thus adenoviruses provided an excellent experimental system to investigate the molecular biology of mammalian. cells in general, including cell transformation and regulation of gene expression.
1. Cells transformed .Q.y adenoviruses
Cells which are semipermissive or nonpermissive to the adenovirus infection are transformed by the virus. Segments of adenoviruses were shown to integrate into the genome of susceptible cells, and cells which contained the transforming ElA and ElB genes from the left of the viral DNA (Gallimore et al. 1974, Sambrook et al. 1975) or the whole viral genome (Green et al., 1976) were transformed. Independent cell lines transformed by human adenovirus type 2. (Ad2) possess the left-hand end of the viral DNA and in some cases only 14% of the total Ad2 DNA was
integrated into the cellular genome. Very often multiple partial copies of viral DNA not colinear with the viral genome were found integrated into the genome of the transf ormed cell ( e. g. the adenovirus 2 genome in F4 cells used in the present study (see Fig. 1)) .
2. The adenovirus genome
Genetie information of the adenoviruses is coded by a double-stranded linear DNA (molecular weight 2.0-2.4 x l07daltons; van der Eb and van Kestern, 1966; Green et al., 1967), and the genome can be divided into two functional demains (Fig. 2). The first demain consists of four groups of "early" genes that are expressed during the early phase of the infection and products derived from this phase are required for activation of the larger set of "late" genes that comprise the second demain (Berk, 1986; Flint, 1977). The early phase of an adenovirus infection is initiated by expression of the pre-early transcription unit ElA
/
/
Xba.1 R.1/
RI""-/ 1 1 - - - - -1---.~l_H
__ __.l.__F ___
X~--Lt/_/_/~'---'-'-''_.-1---·w~~
100
._______________ _
~6 ~---~3
ikb 22kb<===============;>
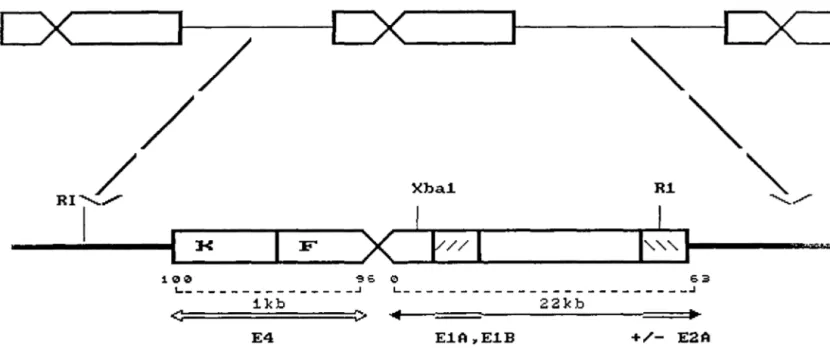
~ E4 E.1A,.E.1B +/- E2AFIGURE 1: Map of the Ad2 genome integrated in F4 cells (Tooze, 1981) .
The upper diagram shows the structure of a tandem array of viral and host sequences f ound in the Ad2 transformed rat embryo cell line, F4. The lower diagram is the enlargement of one of the viral and cellular sequence. Viral DNA sequences are represented by the block areas, the f lanking cellular sequences are shown as thin lines. (Taken from Tooze, p 576 d).
FIGURE 2: IX .. MLP
[-=~~!!:_~ro~ot~r
•
Ll
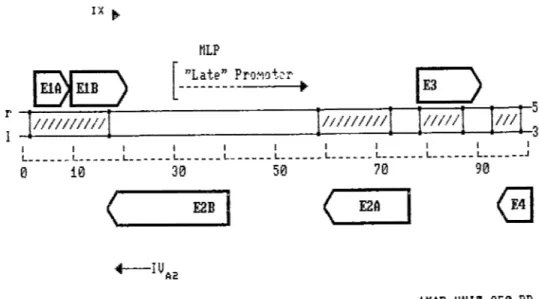
5' 1 1 1 1 1 1 1 1 1 1 1 L- _____ L- _____ L- _____ L- _____ L- _____ L- - - L- - - L- - - L- - - L- - - _J 0 10 30 50 70 90 (,_ ___ E2_B_. ( E2A 1MAP UHIT=350 BPMap of the Ad2 genome wi th two functional demains (Early and Late) (Flint, 1977).
The DNA duplex is represented by the horizontal line (0-100 units). Thick arrows represent the direction of transcription of the major early demains numbered ElA to E4.
The narrow arrows correspond to the late units specifying the late promoters i.e. IX and IV a2, included in this unit are the transcripts starting at the major late promoter (MLP).
Nevins, 1981). In addition, the ElA and ElB genes, both early phase transcription units of adenoviruses, are together responsible for the oncogenic transformation ascribed to adenoviruses (Graham, 1984). Beth ElA and ElB genes are found in the transforming region called El.
3. The transforming region El
This region is located in the first transcription unit of the adenovirus DNA (r-stand) and can be divided into two regions, ElA and ElB (Wilson et al. 1979; Berk and Sharp, 1979) . The organization of this region of the genome is very similar among various adenovirus serotypes (Ad2, Ad5, Ad7 and Adl2) (Grand, 1987). These genes are the first set to be transcribed and expressed after the onset of virus infection and rely completely on the host cell transcription and translation mechanism.
(a) ElA region
The ElA region (map units [m.u.] 1.3 to 4.5 in the adenovirus serotype 2 and 5) codes for two proteins 289R and 243R. The se proteins have identical amine and carboxy termini but differ in their internal primary sequences as a result of differential RNA splicing (Berk and Sharp, 1978; Chow et al. 1979; Perricaudet et al. 1979) . Each of the primary translation products undergoes extensive posttranslati~nal modification resulting in a series of
highly related proteins that are located in the nucleus of · the cell (Harlow et al. 1985). Although both 289R and 243R species are required for cell transformation (Branton et al. 1985), the
289R product alone was shown to stimulate (Kingston et al. 1985; Liu et al. 1985) or repress (Borrelli et al. 1984; Hen et al. 1985; Velcich and Ziff, 1985) other viral or cellular genes (Siva Raman et al. 1986; Nevins, 1982; Kao and Nevins, 1983) and trigger synthesis of cellular DNA {Oda et al. 1986; Stabel et al. 1985; Branton et al. 1985).
Comparison of ElA proteins among adenovirus serotypes revealed a pattern of highly conserved regions alternating with sequences of low homology (Kimmelman et al., 1985; Figge et al., 1988). The three conserved sequences were ·designated as regions 1, 2 and 3 (Moran and Mathews, 1987). Results from combined mutational analyses revealed the three regions to be functional demains of the ElA proteins (Fig. 3). Demains 1 and 2, common to both the 289R and 243R polypeptides, appear to be required for immortalization, collaboration with ras in transformation and induction of cellular DNA synthesis (Lillie et al. 1986; Moran et al. 1986; Lillie et al. 1987; Zerler et al. 1986; Schneider et al. 1987; Subramanian et al. 1988; Whyte et al. 1988b). Domain 3, which is specific for the 289R polypeptide, can efficierrtly transactivate early viral and cellular genes {Carlock and Jones, 1981; Montell et al. 1982; Moran et al. 1986; Glenn and Ricciardi, 1985; Lillie et al. 1986; 1987), but it is not required for cell transformation and immortalization (Whyte et al. 1988b; Green, 1989) . From mutational analysis of the ElA protein coding region it was apparent that some activities of ElA were distinct from others and were carried out independently by different regions of the protein. These observations indicated
...
,
....,
....,
.... 13 S MRNAc~
[i]3
....
t
1
289R 1 2 3..,,....,...
./ ...,,,,
...
12 S MRNAc~
ri]
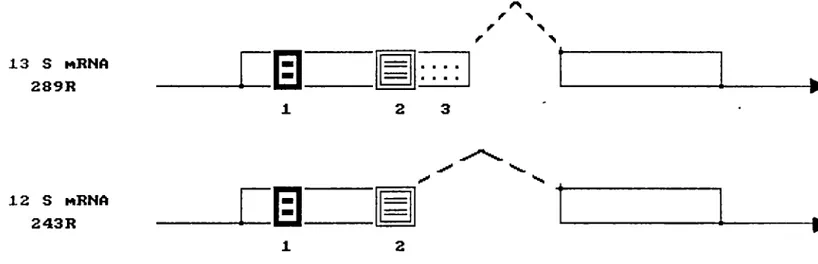
243R 1 2FIGURE J...i.. The functional demains of the ElA proteins (Moran and Mathews, 1987).
The three conserved demains 1, 2 and 3 were
revealed by mutational analysis. Messenger RNAs
of the major ElA Ad2 are shown as lines with arrows for direction of transcription and the
caret syrnbols to indicate introns. The protein
coding regions are indicated as boxes on the
rnRNAs. Each filled box labeled 1,2 and 3 in the
ElA protein ref ers to the highly conserved regions (Lillie et al., 1986, Moran et al., 1986, Zerler et al., 1987). The nurnber of amine acid residues
(R) in each protein is shown as are the
sedimentation coefficients of the ElA rnRNAs. The
function of each demain is mentioned in the text.
~
ElA proteins are mul tifunctional proteins at the biochemical level (Maran and Mathews, 1987).
Since the ElA protein is net a DNA binding protein (Ferguson et al. 1985), cellular activation mediated by this protein was suggested to be an indirect event involving hast cell components
(Feldman et al 1982; Imperiale et al. 1983; 1984; Nevins et al.
1988). Recently the interaction between ElA and a series of
cellular polypeptides, the most abundant of which are 300, 107 and 105 Kd (Yee and Branton, 1985; Harlow et al. 1986) was detected by coimmunoprecipitation. The l05Kd polypeptide was identif ied as a product of the cellular retinoblastoma (RB) gene
(Whyte ~t al. 1988a) . Recently, Whyte et al. ( 1989) used a
variety of ElA mutants and showed the binding site of pl05, the RB protein, required bath conserved regions 1 and 2 of ElA which were previously believed to be involved in transformation. However, the other two cellular proteins bind in an overlapping fashion to the same ElA regions as the pl05-RB wi th the 3 OOKd polypeptide binding to region 1 and the 107Kd polypeptide to region 2 (Whyte et al. 1989). Although there are differences in the precise binding sites of these three proteins, this study suggested that the cellular polypeptides were potential targets for the ElA transforming function(s).
Several oncogenes, including the polyoma large T antigen gene, members of the mye gene family or the p53 oncogene were shown to replace ElA for transformation of the cell (Land et al. 1983; Ruley, J.983; Eliyahu et al. 1984; Jenkin et al. 1984; Parada et al. 1984; Schwab et al. 1985; Yancopoulous et al. 1985)
sufficient for complete cellular transformation. The ElB region is required for complete transformation (Houweling et al. 1980; van den Elsen et al. 1983a).
(b) ElB region
The ElB reg ion (map unit 4. 6 to 11. 2) codes predominantly for two proteins, (55Kd and 19Kd) both in infected and
transformed cells (Stillman, 1986). In transformed cells, both
products are translated from the same 22S mRNA, but from dif f erent reading frames and theref ore do not have common amino
acid sequences (Bos et al. 1981; Branton et al. 1985) . The
19Kd protein can also be translated from the 13S mRNA in inf ected permissive cells, during late infection. Other minor proteins, related to the 55Kd protein, with unknown functions were also identified, but are derived from a third existing ElB rnRNA
(Anderson et al. 1984; Virtanen et al. 1982; 1985). In addition to the se the ElB DNA was shown to encode another specif ic structural protein, pIX, (Wilson et al. 1979; Alestrorn et al. 1980) which is transcribed frorn an independent prornoter.
The ElB region itself, has no transforming capacity, but contributes to cell transformation in severval ways (van den Elsen et al. 1983a). The ElB sequences are required for cornplete expression of the transforrned phenotype, since cell lines transformed only with the ElA DNA were observed to be 'incomplete
transformants' due to a f ibroblastic appearance. These cells
showed differences in growth patterns and turnorigenicity (Houweling et al. 1980; Gallirnore et al. 1985b) in cornparison to
cells containing the entire El region. Jochemsen et al. (1987) found that the ElB region was required in the cis position for enchancement of the transcription-initiation rate of the ElA region and complete oncogenic transformation of cells.
At least five functions, derived from characterization of adenovirus mutants, were assigned to the ElB proteins (Barker and Berk, 1987; Grand, 1987; Flint 1987). Bath the major products are required for complete transformation of cells in culture (Bernards et al 1986) . The larger ElB protein (Ad 55Kd) can complex with the E4(25Kd) protein (Flint, 1987; Grand, 1987) and inhibit host-cell protein synthesis by interfering with the transport of the cellular RNA from the nucleus to the cytoplasm (Babiss and Ginsberg, 1984; Babiss et al. 1985; Pilder et al. 1986). The smaller ElB protein (19Kd) protects bath viral and cellular DNA from degradation during the course of infection and regulates viral participation (White et al. 1984a, 1984b; 1986; 1988; Lai Fatt and Mak, 1982; Pilder et al. 1984; Subramanian et al 1984) in cellular gene expression and transformation (Herbst et al. 1988) .
A potentially interesting property of the large ElB protein is its association in transformed, but not productively-infected, cells with a cellular recessive, antioncogenic, (Hinds et al., 1989) tumor protein, p53 (Sarnow et al. 1982), which also binds to the SV40 large T antigen (Crawford, 1983). However, i t is net clear whether the ElB-p53 complex per se has a role in cell transformation.
4. Transformation revertants selected with drugs
As mentioned earlier, in the revers ion of transformation section, the goal of isolating transformation revertants is to understand the mechanism(s) of malignant cell transformation
(Ozer and Jha, 1977; Bassin and Nada, 1987). By using special
techniques such as negative selection which involves placing a population of transformed cells in a situation which supports the growth of only transformed cells and adding an agent which is taxie and preferentially kills transformed cells, flat revertants from different cell lines transformed by different agents can be isolated and characterized to define and resolve the above
mechanism ( s) . Recently, revertants have been isolated by
positive selection i.e. on the basis of their resistance to certain drugs (Nada et al., 1983). There are some advantages to
the isolation of such drug-resistant mutants. Drug resistant
mutants frequently have other properties which allow the investigator to begin the genetic analysis of a system which would otherwise be very complicated. The drug-resistant mutants in the example given above are sometimes defective for transformation, continue to express the transforming proteins and are phenotypically normal. A combination of these properties was found useful for the isolation of transformation revertants
DRUG RESISTANCE
Development of drug-resistance is one of the major causes for failure of chemotherapy in cancer patients and this area is under investigation in several laboratories (Ling et al., 1988;
see ref. in Gupta, 1989). studies with drug resistant mutants
should prove useful in understanding the molecular mechanisms of
drug action, .eventually leading ta a more effective
chemotherapeutic usage of drugs.
This study is concerned wi th characterization of the methylglyoxal-bis(guanylhydrazone)-resistant detransformed
mutants (MGBGR) isolated from adenovirus transformed rat cells. 1. METHYLGLYOXAL-BIS(GUANYLHYDRAZONE) (MGBG)
Methylglyoxal-bis(guanylhydrazone) (MGBG) is a drug used ta treat cancer patients and was f irst reported by Freedlander and French (1958) ta inhibit the growth of leukemia cells in mice. Later, French et al., (1960) postulated MGBG resembled spermidine structurally (Fig. 4A) and thus probably interfered with the
biological function of the naturally occurring polyamines. In
1972, Williams-Ashman and Schenone discovered that MGBG was a powerful inhibitor of s-adenosylmethionine decarboxylase (EC 4.1.1.50), the second rate limiting enzyme in polyamine metabolism.
(a) Structure-activity relations of MGBG
The MGBG molecule contains several different demains (Fig.4B)
B
SPERMIDINE 8 6 ? 5 H N4 3 2 1 METH~LGL~OXAL-BIS<GUAN~LH~DRAZONE) MGBG D D NH----®---'
FIGURE ~ Chemical structures of spermidine andmethylgloxal-bis(guanylhydrazone) MGBG
(A) Spermidine structure.
(B) MGBG structure. The demains A, B,
c
and D represent various activities assigned to the MGBG molecule (Janne et al., 1985). Domain A, f ormed by carbon number 4 and groups attached to it, influences inhibi tien of s-adenosylmethionine decarboxylase. Domain B consti tu tes the entire length of the molecule and is utilized for binding to the polyamine carrier transport. Domainc
and D are amino-guanidine derivatives responsible for the inhibition of diamine oxidase (Janne et al., 1985).There are four demains, namely A, B,
c
and D. Domain A, formed by the central carbon and all groups attached to it, influencesinhibition of the s-adenosylmethionine decarboxylase. The entire length of the molecule constitutes domain B and is utilised for binding ta the polyamine carrier. The exterior portions of the molecule (demains C and D) are responsible for diamine oxidase
(EC 1.4.3.6) inhibition.
(b) Properties and Function of MGBG
Under physiological conditions, due to its positive charge, MGBG has several intracellular binding sites (Pegg and McCann, 1982, Janne and Morris, 1984), induces enzymes like spermidine N'-acetyltransferase (SAT) (Persson and Pegg, 1984, Pegg et al., 1985b, Karvonen and Poso, 1984) and interferes with polyamine
transport (Wiseman et al., 1983, Kramer et al., 1985). In
addition to inhibiting cellular polyamine biosynthesis, MGBG also damages mitochondria (Mikles-Robertson et al., 1979,
Williams-Asham and Seidenfeld, 1986). As a result there are some
limitations to its clinical usefulness because of its somewhat nonspecific cytotoxicity (Kingsnorth, 1986) .
(c) Cellular uptake of MGBG
Transport of MGBG into the cells occurs by the polyamine transport system as naturally occuring polyamines due to i ts structural resemblance with spermidine and it can influence the normal cellular flux of polyamine compounds (Dave and Caballes, 1973, Gordensmith et al., 1983, Williams-Ashman and Seidenfeld, 1986). Although MGBG resembles spermidine, it does not undergo
biotransformation and is often used as a nonmetabolised substrate for detailed characterization of the polyamine transport system (Pegg, 1988, Williams-Ashman and Seidenfeld, 1986). Uptake and accumulation of MGBG was shown to occur both in normal as well as
malignant cells (Kramer et al., 1985). However, under certain
experimental conditions MGBG accumulated to a greater extent in cancer tissues than in normal tissues, not necessarily due to malignancy, but primarily due to rapid multiplication or division of mice cells (Kallio et al., 1983, Herr et al., 1981).
2. Polyamine biosynthesis pathway
The three key enzymes that regulate the mammal ian
polyamine biosynthesis pathway are: (1) ornithine decarboxylase
(ODC; EC 4.1.1.17), (2) S-adenosylmethionine decarboxylase
(SAMDC; EC 4.1.1.50) and (3) Spermidine/Spermine
N'-acetyltransferase (SAT; no EC number assigned) (Pegg et al., 1982, Morgan, 1987).
All three enzymes have been targets for analysis of polyamine synthesis since they are highly regulated, have very short half lives and are essentially rate-limiting enzymes in this pathway (Morgan, 1987, Pegg and McCann, 1982, Tabor and Tabor, 1984, Porter and Sufrin, 1986, Pegg, 1986, 1988).
(a) S-adenosylmethionine decarboxylase
Among various enzymes of the polyamine biosynthesis pathway the SAMDC (the only enzyme studied in this present study, as it
is the target component of MGBG) has been most thoroughly investigated due to its rate limiting role in this biosynthetic pathway. It is a putrescine-activated enzyme and is present in minute amounts in normal and malignant cells (Pegg et al., 1981, Williams-Ashman and Seidenfeld, 1986). The enzyme has a subunit Mr of 32,000 and contains a covalently bound pyruvate prosthetic group (Pegg, 1984a, Tabor and Tabor 1984b). The role.of SAMDC is to provide an aminopropyl donor for the formation of spermidine and spermine (Pegg and Williams-Ashman, 1969) by decarboxylating s-adenosylmethionine. Like all pyridoxal-phosphate-dependent decarboxylases, the SAMDC reaction proceeds wi th retenti on of steric configuration of the substrate (Allen and Klinman, 1981). This enzyme was recently cloned by the cDNA method from rat prostate, after pretreatment with MGBG to increase tissue content of the enzyme (Paso and Pegg, 1982, Shirahata and Pegg, 1985, Pegg et al., 1973,) . As such MGBG has no effect on the mRNA (Pegg et al., 1988) and is able to stabilize the protein (Pegg et al., 1984a, Pegg, 1984b). In vitro translation showed SAMDC to be first synthesized as an inaC'tive precusor of Mr 37,000, then converted to an active form of Mr 32,000 containing the pyruvate prosthetic group and it can exists as a protein dimer (Pegg, 1986, Pegg et al., 1988). Southern blet analysis of rat, mouse and human DNA suggests that SAMDC belongs to a multigene family and its sequence is highly conserved among mammals (Pegg et al., 1988, Morgan, 1987).
TUMOR NECROSIS FACTOR
In cancer chemotherapy, clinical studies have shown that cytokines, e.g. tumor necrosis factor (TNF), provide an opportunity for advances in antitumor therapy (Frei and Spriggs,
1989) . This therapy is potentially superior to most classical
cancer chemotherapeutic agents because of its extremely high selectivity for tumor cells.
A. History of TNF
Several years ago physicians observed rare spontaneous regression of tumors in cancer patients and this occurrence
coincided occasionally wi th bacterial infections. Attempts to
recreate this phenomenon failed and the investigation was further limited by marked toxicity of the preparations used i.e. crude form of bacterial products (Coley, 1893) or purified form (LPS)
(Shear et al., 1943). Sorne years later, a factor called tumor necrosis factor (TNF) was isolated from mice (Carwell et al., 1975) treated with bacterial lipopolysaccharide (LPS) (Fisch and Giffard, 1983, Mannel et al., 1980, Matthews, 1981, Satomi et al., 1981) and shown to exhibit tumor necrosis activity.
B. Isolation and Structure of TNF
TNF originally obtained from LPS-induced monocyte lines, is now known to be produced by activated lymphocytes (Turner et al., 1987), a number of tumor cells and various cell lines e.g. chronic B-cell malignancies and human epithelial cell,
(Cordingley et al., 1988a, Dealtry et al., 1987). In addition to LPS, the cell lysa te products of several parasites, viral particles, and enterotoxin induce TNF expression and release (Aderka et al., 1986, Hotez et al., 1984, Nedwin et al., 1985, Wong et al., 1986). In both man and mouse, TNF is encoded by a single copy gene and is linked to the major histocompatibility complex (Spies et al., 1986) that has been cloned and sequenced from HL-60 cells for human TNF and from PU5-1.8 murine macrophage cells for the murine TNF (Pennica et al., 1984, Marmenout et al., 1985, Wang et al., 1985). TNF is produced as a pro-hormone with a well-conserved 76- 79 amine acid N-terminal appendage, the function of which is unknown (Caput et al., 1986, Pennica et al.,
1984). Although not expressed constitutively, TNF mRNA forms
0.5% of total cellular RNA (Beutler et al., 1986) after activation, however, it is extremely unstable. Recent evidence suggests that post-transcriptional down regulation of TNF may be due, in part, to destabilization of the TNF message by a non-transcribed 3' sequence (Caput al., 1986). The native, mature-1 7Kd TNF is a trimer, wi th each subuni t containing a cysteine-bond and this protein multimer is thought to be the active form of the complex (Smith and Baglioni, 1987).
Virtually all somatic cells, with the exception of erythocytes, possess a receptor for TNF (Kull er al., 1985). Following binding, the receptors are internalized within minutes and receptor re-expression may not occur for up to 48h
(Cordingley et al., 1988b}. Little is known about the signals
that are transduced after binding of TNF to i ts receptor, however, a rapid change in cellular transcription and translation
results, leading to an altered profile of cellular protein synthesis, and thus cell function (Balkwill, 1989).
c. Studies on the activities of TNF
TNF is considered to be a pleiotropic cell regulatory cytokine, which acts on a variety of cells and induces a spectrum of responses depending on the target cell (Beutler and Cerami, 1988, 1988a, 1988b, Balkwill, 1989, Brenner, 1988, Fiers et al,, 1988, Frei and Spriggs, 1989, Malik and Balkwill, 1988, Old, 1987, 1988, Oliff, 1988, Ruddle, 1987, Tracey et al., 1988). TNF has the ability to act as a growth factor for some cells
(Sugerman et al., 1985, Vilcek et al., 1986) or as an inducer of
differentiation in others (Jelinek and Lipsky, 1987). TNF is
considered central to induction of the inflammatory response and it is also an immune modulator which suggests that TNF plays a modulatory role in inflammation and immunity in the mammalian system (Beulter and Cerami, 1987, Old, 1987).
TNF was originally characterized on the basis of i ts activity against tumor cells, while sparing normal cells both in vitro and in vivo (Carswell et al., 1975, Helson et al., 1975, Old, 1985, 1988). Some of these properties of TNF are discussed below.
(1) cytotoxic activities
One distinct function of TNF is its ability to reduce tumor
cell survival. Certain tumor cells and tumor cell lines are
al., 1975). These cells are all TNF receptor positive, although the number of receptors expressed does not correlate wi th the degree of sensitivity (Aggarwal et al., 1985, Kull et al., 1985). A number of mechanisms were suggested as to why some cells are particularly sensitive to direct killing by TNF, including free radical generation during TNF dependent conversion of arachidonic acid to prostaglandins, intracellular release of lysosomal enzymes (Ruddle, 1987), free oxygen radical formation (Wong and Goeddel, 1988) and the inhibition of synthesis of certain important endogenous proteins (Hahn et al., 1985, Kull and
cuatrecasas, 1981, Ostrove and Gifford, 1979). Whatever the
mechanism, cell death occurs in association with DNA fragmentation, well before cell lysis occurs (Dealtry et al., 1987, Rubin et al., 1988, Ruddle, 1987, Laster et al., 1988, Schmid et al., 1986, 1987).
(2) Antiviral activity
TNFs can induce a cellular antiviral state, similar to that of interferons (Koff and Fann, 1986, Mestan et al., 1986, Wang and Goeddel, 1986). Together with other cytokines, they protect cells from infection by both DNA and RNA viruses, though not on a broad spectrum of cells as do interferons (Balkwill, 1989). However, a single oncogene product is sufficient to render the cell susceptible to the cytotoxic action of TNF. Two well known oncogene products that can induce TNF sensitivity are pp60v-src, a tyrosine protein kinase, and ElA (Fletcher et al., 1987, Chen
oncogene product is responsible for susceptibility to TNF lysis, the mechanism for this activity is net known. On the other hand, pp60v-src is thought ta overcome cell resistance ta TNF by inhibiting the formation of gap junctions (Fletcher et al., 1987) .
The selecti ve toxici ty of TNF against certain tumor cell lines and the various other functions of TNF are apparently mediated by activating complex (es) and perhaps independent biochemical pathways (Reid et al., 1989) in the cells.
RESEARCH OBJECTIVES
The present study deals principally with investigating the basis of drug-resistance and the cause of detransformation in mutants derived from an Ad2 transformed rat cell line (Gallimore, 1974) . Further, an attempt has been made ta characterize cellular genes involved in the transformation process. Knowledge of these parameters is important ta establish a possible link between drug-resistance and detransformation.
(1) Ta investigate the basis of drug resistance, in these cells, there are two potential possibilities: (a) the cellular target enzyme, SAM-decarboxylase, has an altered affinity ta MGBG or (b) the cells have an al tered drug transport. Ta assess these possibilities, an enzymatic assay was performed ta investigate whether the target enzyme incurred a mutation and as a resul t
led ta development of resistance or if the resistance was due mainly ta cell surface changes leading ta altered drug
(2) For cellular detransformation, there could be three possible causes: (a) loss or inactivation of the adenovirus transforming genes (ElA and ElB) , (b) mutation in a cellular gene which is required for transformation, and (c) activation of a cellular tumor suppressor gene. Tc distinguish between these possibilities, several experiments were designed and carried out as described briefly below:
(A) . Are the El genes functional in the detransformed cell lines? As we have already reported elsewhere, the integrated adenovirus oncogenes remained unaltered and continued te synthesize the ElA and ElB oncoproteins (Rodrigues et al., 1987, Sircar et al., 1987, Sircar and Weber, 1988) in the detransformed cells. Tc prove uneqivocally that the cause of detransformation was due te a change in the cellular genome, the functional integrity of El products was tested directly by their capacity te complement El deletion mutants and also by the El-dependent lytic effects of tumor necrosis factor-alpha. The resul ts show that some cell lines express biologically functional ElA proteins and the ElA protein, itself, is responsible for inducing cell susceptibility te TNF. However, the mechanism is net known.
(B). Is the El+ revertant cell line, G2, defective in a cellular factor required for El-mediated transformation?
Our f indings suggest that the El proteins are functional in the G2 revertant cell line. This was supported by the studies of Sircar et al. (1988), demonstrating that this revertant appeared
to be resistant to retransformation by El plasmids. The se results suggest that the resident El proteins in this cell line are not altered or affected. Hence a cellular mutation could be the cause for detransformation, one that perhaps behaves in a dominant manner. To test this hypothesis, somatic cell hybrids were constructed between F4 and G2 as well as G2 and FR3T3. The resul ts suggest that the G2 mutation is dominant and the revertant phenotype does not resul t from the absence of some cellular factor neccessary for transformation.
MATERIALS AND METHODS
1. CELLS
The F4 cells, derived from embryonic rat brain cells and
transformed with Ad2 (Gallimore et al., 1977), were obtained from
Bruce stillman (Cold Spring Harbor Laboratory). These cells are shown te have a transformed phenotype by their ability te (a) grow either in soft agar or in low serum te high density and (b) induce tumors in immunosuppressed rats and nude mice (Gallimore
et al., 1977) • The cells contain 16 copies of an Ad2 DNA
fragment integrated at a single site (Flint, 1977). The F4
cells were recloned three times in succession and the variants used in the present study were isolated from only one of the
subclones (Sircar et al., 1987).
(a) Growth Conditions
All cells were grown in Dulbecco's modified Eagle's essential medium (DMEM, GIBCO) containing 5% calf serum (GIBCO)
in air-5% co2 incubators at 37° in Falcon plastic 10 cm petri
dishes.
2. ISOLATION OF MUTANTS
A. Mutagenesis and Selection of Mutants The F4 populations isolation were of mutagenized by drug resistant several variants procedure·s prier te
resistant te MGBG. In the present study several different
mutagens were used te isolate mutants in order te minimize the chance of isolating similar mutants. The mutants are called G2,
G2a, H2, G5, G4, G4F, G4NF, and G4Dl. mutants is described below:
The isolation of these
(I) Ethylmethane sulfonate (EMS) mutagenesis: The F4 cells (5 x
io
6) were treated with 0.1% EMS (Eastman Kodak, Lot A27) for 4 to 4.5h. The cells were then rinsed with PBS and allowed to grow for 48h in order to express the point mutations induced byEMS. Under these conditions, only 50% of the cells survived.
These cells were then used to select mutants in medium containing
15 uM MGBG. Cell lines from this selection were designated G2
and Gl (Sircar et al., 1987). From the G2 cells, a subclone was selected and designated G2a.
(II) Retroviral insertion mutagenesis: The F4 cells (5 x
106 ) were infected with the Moloney murine leukemia virus,
ZipNeo-SVX, (Cepko et al., 1984; obtained from B. Roberts, M.I.T.; 5 x 10⁴ to 1 x 10⁵ FFU/ml; viral stocks were harvested
from Psi-2 packaging cells), for 3h with occasional agitation.
Twenty-four heurs post-infection, cells were treated with 6 uM or
15 uM of MGBG for 2 to 3 weeks. Colonies survi ving
MGBG-treatment were isolated and named H2 and G5. These cells were
then further selected for G418 (500 ug/ml; GIBCO) resistance (Rodrigues et al., 1987).
(III) DNA transfection: For this experiment the F4 cells were transfected wi th G2 cellular DNA ( 10 ug/plate) using the calcium phosphate precipitation method (Wigler et al., 1979).
Briefly, cells (6 x 10⁵ ) in 10 cm petri dishes were seeded 24h
ratio with the plasmid pSV2gpt and G2 DNA. Four hours later cells were shocked with 10% glycerol and incubated at 37°c for 48h, prier ta selection. Mutants were selected from these cells with 7. 5 uM MGBG and designated G4 (Rodrigues et al., 1987). Subclones G4F and G4NF were deri ved from the G4 cells. These clones were isolated according ta their cellular morphology. G4F appeared flat and grew very slowly whereas G4NF appeared very similar ta F4 ( epithelial-like) . G4Dl, another subclone of G4 was isolated after transfecting with an Ad2-E1A DNA bearing plasmid, pLB206.
(IV) Retransformation: Sorne of the above isolated mutants were retransformed in order ta assess if these cells expressed a biologically functional adenoviral early protein (ElA) . The cells were treated for 48h with freshly prepared 3.
o
uM 5-Azac(Sigma) or 3.0 uM 6-AzaC (ICN Biochemical). After the cells were
subcul tured in absence of the drug, they were checked for phenotypic alterations. Foci that appeared were picked and expanded into mass cultures and checked for retransformation.
3. MGBG RESISTANCE
The isolated mutants were selected in the presence of MGBG in order to isola te mutants wi th a nontransf ormed phenotype. After allowing time for expression and fixation of mutant phenotypes, cells from each mutagenized dish were replated at a lower concentration (10 3-105 cells/dish). The following day various concentrations of MGBG were added ta each dish and the
medium was changed with fresh medium every third day. After 2 te 3 weeks, colonies which appeared te be resistant te MGBG were picked and expanded into mass cultures and tested for MGBG resistance. Growth curves were determined by plating different concentrations of cells and MGBG in 10-cm petri dishes. After 14 te 21 days, the dished were washed with PBS, rinsed with methanol
and the colonies w~re stained wi th Giemsa sol ut ion ( 1: 10 in
methanol) and counted.
4. PROPERTIES OF THE TRANSFORMATION MUTANT CELLS
In order to assess properties of the isolated MGBG resistant mutants, several of the transformation properties were examined.
(I) Growth in soft-agar: Anchorage-independent growth of
the cells was determined by seeding 5 x 10³ cells/60 mm dish in 0.33% agar (Difco) and DMEM supplemented with 10% fetal calf serum (GIBCO). Colonies, visible by eye, were counted after 14 te 21 days with the aid of a microscope.
(II) Tumorigenicity: Balb/c nu/nu mice were used for
these studies to determine the tumorigenic potential of the
various cell lines. About 5 x 10⁵ cells per site (in 0.2 ml
DMEM) were injected subcutaneously at three different places on
the back of each mouse. The mice were observed for up te 16
weeks, noting the day of appearance and growth of the tumors.
(III) Karyotype analysis: Subconfluent cultures (50-60%
4h. After trypsinizing and gently pelleting the cells they were placed in an hypotonie KCl (0.75 M) solution for 15 to 50 min at 37°c. These cells were then fixed with methanol: acetic acid (3:1) for 10 min on ice. Fixation was repeated three times, and the cells were spread on cold, wet slides and allowed to air dry. When dried, they were stained with a Giemsa solution (1: 10), mounted in Permount and examined under the microscope.
(IV) SAM Decarboxylase activity: This assay was based on measurements of 14co2 released from c14c) s-adenosylmethionine by
cell extracts as described by Williams-Ashman and Schenone (1972).
1. Preparation of cell extracts
Cells (106 ) were washed twice with PBS, harvested in Tris buffer (Tris 10 mM pH 8.1, NaCl 50 uM, EDTA 1 mM) sonicated for 30 sec and centrifuged at 10,000 x g for 20 min. Supernatant
(O. 1 ml) obtained from the above spin was used for the enzyme
assay.
2. Enzyme assay
The reaction was carried out in 2.0 ml Eppendorf tubes each containing a second modified 500 ul Eppendorf tube with 200 ul hyamine hydroxide to trap (14co2) released from 2.5 nM (14c) SAM
in the presence of 100 mM sodium phosphate, pH 7. 2, 2. 5 mM
putrescine, 5 mM dithiothreitol, various concéntrations of MGBG and the enzyme extract (O.l ml) prepared above. All incubations were performed at 37°c for 45 min. To terminate the reaction, 0.2 ml 5 N H2so4 was added to the reaction mixture. The tube was
then incubated for an additional 30 min at- 37°c. During this period all the 14 co 2 so released was absorbed by hyamine hydroxide. Total counts in hyamine hydroxide were determined by counting in aquasol scintillation fluid. Enzyme activity was expressed as pmoles co2 released per mg of protein. Protein was determined using the Bio-rad assay (Bio-Rad Laboratories) .
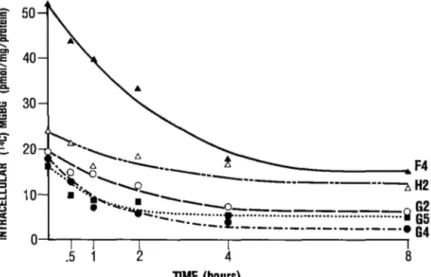
(V) L 14.Ql MGBG uptake and efflux studies
c
14c)-MGBG uptake studies were performed with cells grown in monolayers as described elsewhere (Wiseman et al., 1983). For these experiments, 5 x 10⁵ cells were plated in a 6-well (3.5 cm diameter) Linbro dish in 5 ml DMEM containing 10% calf serum. At subconfluence, the medium was replaced with 1 ml fresh DMEM containing ( 14c) -MGBG ( 19 uCi/umol; Amersham) at a final concentration of 20 uM. After 1 to 60 min incubation at 37°c the cells were rinsed three times with cold 200 uM MGBG in PBS, lysed with 1 ml 1 N NaOH at 60°c for 40 min. Aliquots were taken from the lysate for protein determination by the Bio-rad assay and scintillation counting. Results are based on three expriments, each carried out in triplicate.MGBG efflux was measured in 6-cm petri dishes with the same concentration of cells as above. The cells were incubated for 30 min at 37°c in the presence of 1 ml 10 uM
c
14c)-MGBG. Rinsed four times with PBS containing cold 200 uM MGBG, replenished with 3 ml drug-free medium and incubated for various periods of time. At designated times intracellular MGBG was measured as given above.containing 105 cells/well (Mandel! and Flintoff, 1978). Cells were washed with PBS and incubated with 0.48 ml/well DMEM plus 5% dialyzed herse serum (because it is devoid of polyamine oxidase activity; the serum was dialyzed against PBS for 16 ta 18 h at 4°c). After one heur 20 ul of (3H)-spermidine (40.1 Ci/mmol; New England Nuclear, 1 uM final concentration) was added and the
incubation was carried on for another 30 min. The cells were washed, lysed and incorporated radioactivity was counted as above. Cells grown in parrallel were trypsinized and used for determination of cell number.
5. FUNCTIONAL INTEGRITY OF THE ElA PROTEINS
To assess the functional integrity of ElA in transformation-mutants that express this protein, a deletion mutant dl312 virus
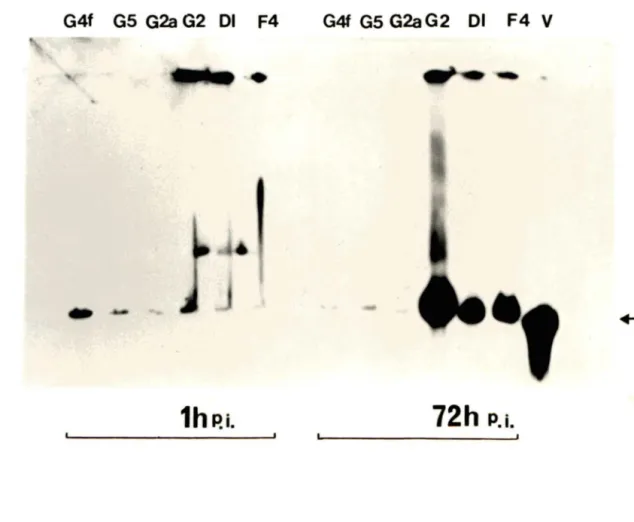
(Jones and Shenk, 1979) was used ta determine whether the resident ElA complements the mutant virus for replication in these cells. The multiplication of mutant viral DNA was determined by a simple gel technique as described by Gardella et al. (1984).
(a) Virus
Adenovirus type 2 (Ad2) was used as the probe ta detect viral replication and the Ad5 hast-range deletion mutant (dl312) defective in transformation and replication (described by Jones and Shenk, 1979) was used for the complementation assay.
(b) Virus infection
were appropriately diluted in growth medium (DMEM supplemented with 2% calf serum, and 0.4 mM arginine), and dispersed on F4 and the revertant cell monolayers. The multiplicity of infection (MOI) was maintained at 10 PFU/cell. Adsorption was allowed for lh at 37°c with frequent agitation to enhance uniform distribution of virus over the cells. After adsorption, the monolayers were rinsed with PBS and incubated with complete DMEM plus 5% calf serum for 72 h. The cytopathic eff ects ( cells rounded up and were grouped together) were evident only in cells capable of propagating the virus.
(c) Preparation of samples
Samples were prepared for electrophoresis as follows: Infected cells (between 1 to 2. 5 x 10⁶ ) were rinsed with PBS, trypsinized and centrifuged at 10,000 x g for 5 min. The pellet was resuspended in
o.
1 ml sample buf fer ( 15% F icoll, 2 Kuni tz units RNase type lA (Sigma) per ml, and 0.01% bromophenol blue) in TBE (0.09 M Tris, 0.09 M Borie acid and 2.5 mM EDTA, pH 8.2) before electrophoresis.(d) Horizontal lysing agar gel·electrophoresis
This method was done essentially as described by Gardella et
al. (1984). The horizontal gels were prepared in two steps. Ini tially, aga rose (O. 7 5%) in TBE buffer was poured onto a
plastic plate (20 x 25 cm). Gels were usually 7 to 8 mm thick. After the gel solidified, wells were eut out 5 cm from the top
(long side) of the gel. A comb was placed in the resulting gap between the plastic mold and solidified agarose. The gap was filled wi th O. 8% agarose in TBE containing 2% SDS and pronase
(final concentration, 1 mg/ml). After solidification, the gel was transferred into the gel running tank. The wells were loaded with cell suspensions in 15% Ficoll and electrophoresed (3h at o.8 V/cm) at 4°c, immediately, to avoid SDS diffusion and to
allow the cells to be digested. Electrophoresis current was
increased (4.5 V/cm) and terminated when the tracking dye ran out of the gel completely. The gels were soaked in ethidium bromide (0.5 ug/ml) for 30 min, visualized and photographed under UV light.
(e) Southern blotting analysis
Replicated viral DNA was analyzed by the technique of Southern (1975) with some modifications. The DNA in the gel was partially depurinated (15 min in 0.25 M HCl), then denatured in 0.5 M NaOH, 0.6 M NaCl and 0.015 M sodium citrate. As the DNA of interest had a large size, the gels were blotted overnight to allow complete transfer. After blotting the transferred DNA was crosslinked to the nylon membrane (Amersham) under UV light for 5
min and baked in an oven at 8a0c for 2h as suggested by the
manufacturer.
(f) Preparation of probes
Various DNA probes used in this study were labeled according to the procedure described in the Multiprime DNA Labeling Kit
(Amersham) . The 50 ul reactions contained 25 ng of
heat-denatured DNA (100°c for 5 min, then chilled on ice for 1 min), 50 uCi of dCTP (32P; 3000 Ci/mmol; Amersham) , 10 ul of the multiprime buffer solution (dATP, dGTP and dTTP in a concentrated buffer solution of Tris-HCl pH 7.8, MgC1 2 and 2-mercaptoethanol),
![Figure 5. 120 "ê ]! e 100 Q. ...... "" E ...... ~ 80 .e c.:> m c.:> 60 :E ~ = 40 < ....](https://thumb-eu.123doks.com/thumbv2/123doknet/2740761.65178/61.919.274.699.249.623/figure-ê-q-e-gt-gt-e-lt.webp)