HAL Id: pastel-00006223
https://pastel.archives-ouvertes.fr/pastel-00006223
Submitted on 10 Aug 2010
HAL is a multi-disciplinary open access archive for the deposit and dissemination of sci-entific research documents, whether they are pub-lished or not. The documents may come from teaching and research institutions in France or abroad, or from public or private research centers.
L’archive ouverte pluridisciplinaire HAL, est destinée au dépôt et à la diffusion de documents scientifiques de niveau recherche, publiés ou non, émanant des établissements d’enseignement et de recherche français ou étrangers, des laboratoires publics ou privés.
Models and methods of risk assessment and control in
dangerous goods transportation (DGT) systems, using
innovative information and communication technologies
Angela Maria Tomasoni
To cite this version:
Angela Maria Tomasoni. Models and methods of risk assessment and control in dangerous goods trans-portation (DGT) systems, using innovative information and communication technologies. Chemical Sciences. École Nationale Supérieure des Mines de Paris; Università degli studi di Genova - Italie, 2010. English. �NNT : 2010ENMP1703�. �pastel-00006223�
T
T
H
H
E
E
S
S
N°: 2009 ENAM XXXX MINES ParisTechÉcole doctorale n° 432: SMI-Sciences des métiers de l'ingénieur
présentée et soutenue publiquement par
Angela Maria Tomasoni
21 avril 2010Modèles et méthodes d'évaluation et de gestion des risques appliqués aux systèmes de transport de marchandises dangereuses(TMD) reposant sur les nouvelles technologies de
l'information et de la communication (NTIC)
Doctorat ParisTech
T H È S E
pour obtenir le grade de docteur délivré par
l’École nationale supérieure des mines de Paris
Spécialité “ Science et génie des activités à risques ”
Directeur de thèse : Roberto Sacile
Co-encadrement de la thèse : Emmanuel Garbolino
T
H
È
S
E
JuryM.Riccardo Minciardi, Professeur, DIST, Università degli Studi di Genova M. Agostino Poggi, Professeur,DII, Università degli Studi di Parma
M. Domenico Pizzorni, Partenaire industriel, Logistica Secondaria, ENI R&M S.p.A M. Pierre Carrera, Professeur, CNRS UMR6012, Université Nice-Sophia- Antipolis
M. Jérôme Tixier, Maître Assistant, Sécurité industrielle et environnement, Ecole des Mines d'Alès
M. Emmanuel Garbolino,Maître Assistant,HDR, CRC, Ecole des Mines de Paris
M. Roberto Sacile, Professeur, DIST, Università degli Studi di Genova
(PhD Thesis sponsored by UIF-UFI)
“Science and Information Technology for SystemMonitoring and Environmental Risk Management” – XXII Cycle – DIST – UNIGE - Italy
“Science and Engineering of risk activities” – CRC – MINES PARIS-TECH – France
T H E S I S I N C O T U T O R I N G
for the degree of
DOCTOR OF PHILOSOPHY
presented and publicly defended by
Angela Maria TOMASONI
MODELS AND METHODS OF RISK ASSESSMENT AND CONTROL
IN DANGEROUS GOODS TRANSPORTATION SYSTEMS, USING
INNOVATIVE INFORMATION AND COMMUNICATION
TECHNOLOGIES
Thesis Supervisor: Prof. Roberto Sacile
Modèles et méthodes d'évaluation et de gestion des risques appliqués aux systèmes de transport de marchandises dangereuses (TMD), reposant sur les nouvelles technologies de l'information et de la communication (NTIC)
RESUME :Durant ma thèse de doctorat, j'ai développé plusieurs modèles et méthodes d'évaluation des risques dans les systèmes de transport de matières dangereuses. En raison de la multiplicité des approches d’évaluation de risque, tous les modèles décrits, définis et utilisés sont fondés sur la définition classique du risque technologique - liés à l'activité de l'homme - la catégorie des risques accidentels, - ou d'un accident - d'un véhicule transportant des matières dangereuses.
Cette définition des risques est la même pour les conduites que pour le transport par route, mais différentes approches méthodologiques pour l’évaluation des risques de transport peuvent être abordées:
Au chapitre 2: une définition générale des marchandises dangereuses a été réalisé ainsi que différents types de matières dangereuses considérées. Ensuite, l’étude a été focalisé sur les hydrocarbures ainsi que sur les réglementations qui y sont liés.
Dans le chapitre 3, l’étude a porté sur la définition des risques dans le transport des matières dangereuses, respectivement, dans le cas des pipelines ainsi que pour le transport routier.
Au cours du chapitre 4, une description complète de la méthodologie d'évaluation des risques de pipelines a été réalisé. Par la suite, au chapitre 5, un modèle innovant et technologique a été utilisé afin de décrire un scénario d'accident du GPL par route et d’évaluer son impact sur la population concernée.
Au chapitre 6, j'aborde des modèles et des méthodes innovants pour l’évaluation des risques et le contrôle de la DGT par route. Cette méthodologie est basée sur une approche «Risk adverse decision making».
Au chapitre 7, une loi de contrôle optimale de la DGT a été développé et appliqué dans le cas d’une infrastructure critique, spécifiquement, dans le cas des tunnels. Enfin, le chapitre 8 a pour objectif de résumer mon travail en termes de résultats obtenus au cours de ma thèse.
Mots clés : systèmes de transport, marchandises dangereuses, modèles d'évaluation des risques, technologies de l'information et de la communication.
Models and methods of risk assessment and control in dangerous goods transportation (DGT) systems, using innovative information and communication technologies (ICT)
ABSTRACT : All the models that I have described and defined originate from the classical definition of technological risk, specifically of accidental risk, that is related to human activities. The risk I have dealt with is so related to the failure – or accident – either of a vehicle on road or a pipeline, transporting dangerous goods (DG). Although different means of transportation do not deeply influence the basic definition of risk (which is more affected by the quantity, the type and the nature of the transported dangerous good), different methodological approaches may be used to evaluate the risk in transportation.
In Chapter 1, some preliminary basic concepts on industrial risk, its assessment and its characterisation in the transportation and logistic domain are introduced. On the ground of the basic assumption that “an accident may happen” both in road and in pipeline transportation, in Chapter 2 I have defined what a DG is, which type of DG I have considered in this study, which transportation modalities are generally used, and which of them I have chosen for my research activity, and finally, what the main relative regulations are present in France, Italy and in general in Europe. Chapter 3 deals with the risk definition in the transportation of DG, respectively, in pipeline and on road, starting from one risk definition, univocally based on the risks related to humans activities. Similarities and differences between pipeline and road transportation risk definition are also discussed. Then, in Chapter 4, an original methodology used to describe pipeline risk assessment has been defined and validated on a case study. In Chapter 5, an innovative and technological real-time approach which can be used to describe the effects of a DG accident scenario on road, and the population involved, has been described. Finally, I tackle specific models and methods of risk assessment and control in DGT on road, considering two different approaches: a risk adverse decision maker approach (Chapter 6); and an optimal real-time control of DGT flow towards a critical infrastructure, such as a tunnel (Chapter 7). Conclusions and future developments are reported in Chapter 8.
To Davide and Elena “Home, sweet home”. John Howard Payne (1791-1852)
Acknowledgements
I would like to extend my most sincere thanks to:
Pierre CARREGA, full professor at University of Nice, who is an expert in
Geography, Planning and Territorial Development, and in Environment and Sustainable Development, who is the first reviewer of my thesis;
Riccardo MINCIARDI, full professor at University of Genoa, who teaches
Modelling and Control of Transportation Systems, Industrial Automation and Optimization and other courses;
Domenico PIZZORNI, Eni HSE manager, expert in dangerous goods transportation
on road and in pipeline, because of a long career in PraOil Group before, and then in Eni Group – an international Oil Company with head office in Roma;
Agostino POGGI, full professor of Computer Engineering at University of Parma,
who teaches Computer Networks, Distributed and Agent Systems and Software Engineering, and he is the second reviewer of this thesis;
Jerome TIXIER, teacher researcher, expert in Industrial Safety and Environment,
Methods of analysis and evaluation of major industrial hazards in fixed plants; because of their rule in my thesis jury.
Emmanuel GARBOLINO and Roberto SACILE, thesis directors, guidance and
support for the development of this thesis.
Then, I wish to acknowledge:
Italo-French University (UIF) because I won a scholarship and contributions to joint
initiatives in a VINCI programme for the realization of my PhD theses under the co-supervision of University of Genoa and Mines Paris-Tech.
Roberta Valentina GAGLIARDI and ISPESL (National Institute for Occupational
Safety and Prevention – Department of Industrial Premises and Interaction with the environment) for the opportunity to develop the topic of transportation in pipeline considering aspects related to safety and security. Stefania BRIATA, and her staff of Eni Secondary Logistic, Francesca POLLAMATTIOT, and her staff of Eni Corporate - Health, Safety & Operational Environment - Major Emergencies, Pierluigi TIMOSSI,
transportation data and information, for both modality of transportation, road and pipeline.
Régine MOLINS, “MINES ParisTech - Direction de la Recherche - Responsable
Formation Doctorale”, and Gérard COFFIGNAL, “Directeur de l'Ecole Doctorale Sciences des Métiers de l'Ingenieur, Directeur de la formation doctorale Arts et Métiers ParisTech” for their welcome in Paris. Yves LABOUREUR, “Adjoint du Délégué - Chargé de la formation et de la recherché” of Mines Paris-Tech in Sophia Antipolis;
Frank GUARNIERI, Denis BESNARD, Valérie GODFRIN, Myriam PERRAULT LAVIGNE, Aldo NAPOLI, Samuel OLAMPI, Eric RIGAUD, and all the other
researchers, PhD students and technicians of the CRC, for their kindness and hospitality during my stay in Sophia Antipolis.
Chiara BERSANI, Irene MARRAS, Fabio MERLO, Michela ROBBA, Massimo ROVATTI, Stefania TRAVERSO, and Eva TRASFORINI, who not only provided
Index
1INTRODUCTION ... 28
1.1RISK ASSESSMENT... 29
1.2SYSTEMS AND MODELS TO SUPPORT DECISIONS... 46
1.3GENERAL OBJECTIVE... ERRORE.IL SEGNALIBRO NON È DEFINITO. 2DANGEROUS GOODS TRANSPORTATION... 57
2.1HYDROCARBONS... 58
2.1.1Crude Oil. ... 60
2.1.2Oil products ... 60
2.1.3Oil products and their potential risks ... 61
2.1.4Dangerous substances in oil products ... 62
2.1.5Oil products hazard classification ... 63
2.1.6Material Safety Data Sheet (MSDS) ... 63
2.2TRANSPORTATION MODALITIES... 64
2.2.1 Dangerous goods transported on road ... 66
2.2.2 Dangerous goods transported by pipeline ... 75
2.3REGULATIONS... 77
2.3.1 Introduction... 77
2.3.2 Dangerous goods transported by pipeline ... 81
2.3.3 Dangerous goods transported by road... 83
3RISK DEFINITION ... 90
3.1RISK DEFINITION INTRODUCTION... 91
3.2DGT RISK BY PIPELINE... 91
3.3DGT RISK BY ROAD... 98
3.4MONITORING A DGT VEHICLE – STATE OF THE ART... 111
3.5DGT RISK DEFINITION COMMENTS AND COMPARISON... 113
4ACCIDENT OCCURRENCE EVALUATION IN THE PIPELINE TRANSPORTATION OF DANGEROUS GOODS ... 117
4.1INTRODUCTION... 117
4.2TYPES OF ACCIDENT... 118
4.3FACTORS LEADING TO AN ACCIDENT... 119
4.4DATA SOURCES... 120
4.5EVALUATION OF FAILURE OCCURRENCE... 121
4.6THIRD PARTY ACTIVITY RESULTS... 122
4.7PRELIMINARY RESULTS... 125
4.8FUTURE DEVELOPMENTS... 125
5RISK EVALUATION OF REAL-TIME ACCIDENT SCENARIOS IN THE TRANSPORTATION OF DANGEROUS GOODS ON ROAD... 128
5.1INTRODUCTION... 129
5.2ACCIDENT SCENARIO... 130
5.3PROBLEM FRAMEWORK... 134
5.3.1 Transport Integrated Platform (TIP) ... 134
5.3.2 Areal Location of Hazardous Atmospheres (ALOHA) ... 136
5.3.3 GIS Interface ... 137
5.4CASE STUDY... 137
5.5CONSEQUENCE-BASED APPROACH METHODOLOGY... 138
5.6SOLUTION METHOD AND COMPUTATIONAL RESULTS: ACCIDENT SCENARIOS... 141
5.7CONCLUDING REMARKS... 149
6 RISK ADVERSE ROUTING OF DANGEROUS GOODS WITH SCHEDULED DELAYS ... 152
6.3THE MODEL... 157
6.3.1 Network model ... 157
6.3.2 Decision making behavior... 158
6.3.3 Set definitions... 159
6.3.4 Modelling assumptions and parameters... 159
6.3.5 Decisional variables... 159 6.3.6 Other variables... 160 6.3.7 Model formulation... 160 6.4CASE STUDY... 161 6.5RESULTS... 163 6.6DISCUSSION... 167
7OPTIMAL CONTROL OF DANGEROUS GOODS TRAFFIC FLOW - THE CASE OF TRANSPORT THROUGH A CRITICAL INFRASTRUCTURE ... 169
7.1INTRODUCTION... 169
7.2THE SYSTEM MODEL... 171
7.2.1 The queue state equation... 172
7.2.2 The highway tract state equations... 172
7.2.3 Hazard assessment ... 173
7.2.4 The decision problem ... 174
7.2.5 The statement of the optimal control problem... 174
7.3RESULTS... 176
7.4CONCLUSIONS... 178
8GENERAL CONCLUSION AND FUTURE DEVELOPMENTS ... 180
REFERENCES ... 183
LINKS... 195
ATTACHMENTS... 202
ATTACHMENT N.1-THE CLASSES OF DANGEROUS GOODS ACCORDING TO HAZARDOUSMATERIAL TRANSPORTATIONGUIDES.(DGGUIDELINES,2010). ... 203
ATTACHMENT N.2–KEROSENE MATERIAL SAFETY DATA SHEET (MSDS)... 209
ATTACHMENT N.3–GIS AND WEB-GIS PLATFORM AND PROTOTIPE... 211
ATTACHMENT N.4–ACCIDEN SCENARIO FROM TIP TO ALOHA... 228
ATTACHMENT N.5–RISK ADVERSE DECISION MAKING CODE... 262
Index of Figures
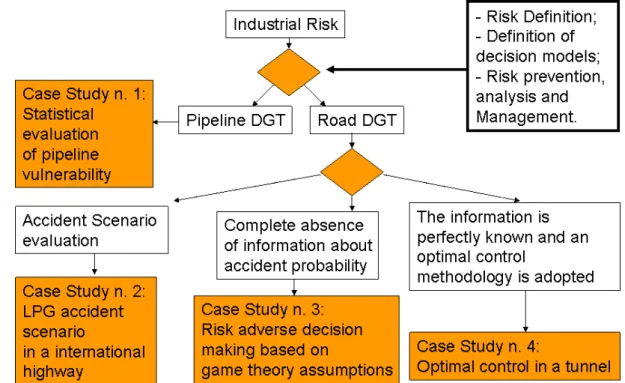
FIGURE 1.THESIS ARCHITECTURE: STARTING FROM DGT RISK DEFINITION UNTIL MATHEMATICAL
FORMALIZATION IN CASE STUDY SOLVING... 29
FIGURE 2.A BLOCK FLOW DIAGRAM OF THE HAZOP PROCESS (B), AND HAZOP STRUCTURED TECHNIQUE IN WHICH A MULTI-DISCIPLINE TEAM PERFORMS A SYSTEMATIC STUDY OF A PROCESS USING GUIDE WORDS TO DISCOVER HOW DEVIATIONS FROM THE DESIGN INTENT CAN OCCUR IN EQUIPMENT, ACTIONS, OR MATERIALS, AND WHETHER THE CONSEQUENCES OF THESE DEVIATIONS CAN RESULT IN A HAZARD (A). ... 31
FIGURE 3.LIKELIHOOD-CONSEQUENCE RISK MATRIX -(MUHLBAUER,1996). ... 33 FIGURE 4.TYPOLOGY OF RISK ASSESSMENT -(EEA,1998). ... 35
FIGURE 5.GMESFAST TRACK EMERGENCY RESPONSE CORE SERVICE STRATEGIC IMPLEMENTATION
PLAN*-FINAL VERSION,24/04/2007AUTHOR:PROFESSOR BERNARDO DE BERNARDINIS... 35
FIGURE 6.RISK MANAGEMENT POLICY AND CRITERIA OF ACCEPTABILITY IN THE NETHERLANDS.(ALE,
B.J.M.,1991). ... 38 FIGURE 7.THE ALARP REGION IS DEFINED IN:VRIJLING ET AL.,1995;VRIJLING ET AL.,2004; AND HOJ ET
AL.,2002. ... 39 FIGURE 8.PROVISIONAL RISK CRITERIA FOR PEOPLE, CONSIDERING (IR) AND ITS ACCEPTABLE LIMITS.(ALE,
2002)... 40 FIGURE 9.PROVISIONAL RISK CRITERIA FOR PEOPLE, CONSIDERING (SR) AND ITS ACCEPTABLE LIMITS.
(ALE,2002)... 40
FIGURE 10.RISK ASSESSMENT DECISION MATRIX (RADM)-OFFICIAL JOURNAL OF FRANCE REPUBLIC – REGULATION 7OCTOBER 2005.(RENIERS ET AL.,2005). ... 41 FIGURE 11.ADVISORY LIMITS REFERRING TO SOCIETAL RISK, WHERE TRANSPORT SR AND INSTALLATION
SR ARE COMPARED.(ALE AND PIERS,2000);(ALE,2002). ... 42
FIGURE 12.THE ELEMENTS OF RISK ASSESSMENT.(EEA,1998). ... 46
FIGURE 13.THE FOUR DECISIONAL LEVELS... 47 FIGURE 14.CHEVALLIER AND CARON (2002) APPROACH TO SHARE AND MANAGE DATA FROM A
TERRITORIAL POINT OF VIEW. ... 51
FIGURE 15.DGTSYSTEM ARCHITECTURE.THIS SYSTEM CAN BE DIVIDED INTO ITS SUB-SYSTEMS, THAT ARE CONNECTED EACH OTHERS, AND A DECISION PROCESS CAN BE FOLLOW TO FIND AN OPTIMAL
SOLUTION FOR THE DGT SYSTEM... 52
FIGURE 16.RISK MANAGEMENT IN CASE OF A DGT ACCIDENT EVENT... 53
FIGURE 17.STRUCTURAL FORMULA OF DIFFERENT HYDROCARBONS, DIVIDED IN PARAFFINS, OLEFINS, NAPHTHENES, AND AROMATICS... 60 FIGURE 18.GOODS TRANSPORTED IN EU-27-(“PANORAMA OF TRANSPORT”,2009) AND (“ANNUAL ROAD
FREIGHT TRANSPORT OF DANGEROUS GOODS, BY TYPE OF DANGEROUS GOODS AND BROKEN DOWN BY ACTIVITY”,2010). ... 65
FIGURE 19.LENGTH OF MAIN TRANSPORT NETWORKS -(“PANORAMA OF TRANSPORT”,2009) AND
(“ANNUAL ROAD FREIGHT TRANSPORT OF DANGEROUS GOODS, BY TYPE OF DANGEROUS GOODS AND BROKEN DOWN BY ACTIVITY”,2010). ... 65
FIGURE 20.COMPARISON BETWEEN TONS OF DG AND FREIGHT TRAFFIC TRANSPORTED BY DIFFERENT TRANSPORT MODALITIES IN FRANCE,(1996-2001 AND EVOLUTION),(ANALYSE DES RISQUES TMD, DDE42/STI/TDP,SOURCE:CYPRES)... 66
FIGURE 21.DANGEROUS GOODS TRANSPORTED BY ROAD [% TKM]-(“PANORAMA OF TRANSPORT”,2009) AND (“ANNUAL ROAD FREIGHT TRANSPORT OF DANGEROUS GOODS, BY TYPE OF DANGEROUS GOODS AND BROKEN DOWN BY ACTIVITY”,2010)... 67 FIGURE 22.DANGEROUS GOODS TRANSPORTED ON ROAD [MILLION veh⋅km] IN EUROPEAN UNION.
ITALIAN AND FRANCE PARTICULAR -(“PANORAMA OF TRANSPORT”,2009) AND (“ANNUAL ROAD FREIGHT TRANSPORT OF DANGEROUS GOODS, BY TYPE OF DANGEROUS GOODS AND BROKEN DOWN BY ACTIVITY”,2010). ... 68
FIGURE 23.DANGEROUS GOODS TRANSPORTED ON ROAD [MILLION veh⋅km].ITALIAN AND FRANCE COMPARISON IN TEN YEARS DATA -(“PANORAMA OF TRANSPORT”,2009) AND (“ANNUAL ROAD FREIGHT TRANSPORT OF DANGEROUS GOODS, BY TYPE OF DANGEROUS GOODS AND BROKEN DOWN BY ACTIVITY”,2010). ... 68
FIGURE 24.COMPARISON BETWEEN THE TOTAL AMOUNT OF DANGEROUS GOODS, FLAMMABLE LIQUIDS, AND GASES – RESPECTIVELY -TRANSPORTED IN ITALY, EXPRESSED IN [MILLION veh⋅km]
-(“PANORAMA OF TRANSPORT”,2009) AND (“ANNUAL ROAD FREIGHT TRANSPORT OF DANGEROUS
GOODS, BY TYPE OF DANGEROUS GOODS AND BROKEN DOWN BY ACTIVITY”,2010). ... 69
FIGURE 25.COMPARISON BETWEEN THE TOTAL AMOUNT OF DANGEROUS GOODS, FLAMMABLE LIQUIDS, AND GASES – RESPECTIVELY -TRANSPORTED IN FRANCE, EXPRESSED IN [MILLION veh⋅km] -(“PANORAMA OF TRANSPORT”,2009) AND (“ANNUAL ROAD FREIGHT TRANSPORT OF DANGEROUS GOODS, BY TYPE OF DANGEROUS GOODS AND BROKEN DOWN BY ACTIVITY”,2010). ... 69
FIGURE 26.THE RISK OF TDG(SOURCE:MINISTRY OF ECOLOGY AND SUSTAINABLE DEVELOPMENT – FRANCE)... 72
FIGURE 27.CALCULATION OF THE VEHICLES THAT PASS THE TOLL BARRIER OF VENTIMIGLIA (ITALY). DATA SUPPLIED BY THE COMPANY ESCOTA.SOURCE:UNION ROUTIÈRE DE FRANCE... 73
FIGURE 28.NUMBER OF VEHICLES THAT CROSS THE TOLL BARRIER AT VENTIMIGLIA (ITALY).DATA SUPPLIED BY THE COMPANY ESCOTA.SOURCE:ROAD UNION OF FRANCE... 73
FIGURE 29.FIGURES OF THE FLOW OF THE TWO TYPES OF DANGEROUS GOODS.INDICATING THE ORIGIN AND DESTINATION OF THE GOODS.DATA SUPPLIED BY THE COMPANY ENI. ... 74
FIGURE 30.DIFFERENT CLASSES OF DANGEROUS GOODS TRANSPORTED ON ROAD AND COMPARISON WITH THE ROAD FREIGHT TRAFFIC IN THREE YEARS OF DATA ACQUISITION IN FRANCE... 74
FIGURE 31.EXAMPLE OF A CODE OF DANGER SIGN FOR DANGEROUS GOODS, IN ACCORDANCE WITH THE KEMLER CODE... 87
FIGURE 32.EXAMPLE OF A TICKET FOR DANGEROUS GOODS IN ACCORDANCE WITH THE KEMLER CODE.... 87
FIGURE 33.DANGEROUS GOODS CLASSIFICATION ON THE BASES OF TYPE OF DG AND HAZARD LABEL, (ADR,2009). ... 88
FIGURE 34.RISK DEFINITION AND ITS CLASSIFICATION... 90
FIGURE 35.METHODS OF RISK ASSESSMENT... 93
FIGURE 36.METHODS FOR ESTIMATING THE RISK –CANADIAN STANDARD ASSOCIATION,2001... 94
FIGURE 37.MODEL ARCHITECTURE FOR ASSESSING AND EVALUATING – COMPUTING - THE POTENTIAL CONSEQUENCES... 95
FIGURE 38.METHODOLOGIES FOR RISK ASSESSMENT IN LONG PIPELINES. ... 95
FIGURE 39.POTENTIAL HAZARD ZONE, DEFINED AFTER AN ACCIDENTAL RELEASE OF A DANGEROUS GOODS INTO THE AIR. ... 96
FIGURE 40.GENERAL DIAGRAM THAT FORMALIZE THE ENVIRONMENTAL CONSEQUENCES CAUSED BY A PIPELINE FAILURE OR RUPTURE. ... 97
FIGURE 41.DYNAMIC AND STATIC PARAMETERS INVOLVED IN RISK DEFINITION... 108
FIGURE 42.REPRESENTATION OF THE AREA OF PERTINENCE OF A SEGMENT AND THE DISTANCE BETWEEN THE CENTRES OF THE TWO DIFFERENT SEGMENTS. ... 109
FIGURE 43.SUMMARY DIAGRAM REGARDING THE DEFINITION OF RISK IN THE TRANSPORT OF DANGEROUS GOODS RELATIVE TO A H ARCH... 110
FIGURE 44.ARTIFICIAL NEURAL NETWORK ARCHITECTURE IMPLEMENTED FOR THIRD PARTY ACTIVITY CAUSE OF FAILURE. ... 121
FIGURE 45.ARTIFICIAL NEURAL NETWORK ARCHITECTURE IMPLEMENTED FOR CORROSION CAUSE OF FAILURE. ... 122
FIGURE 46.TUBE DIAMETER INFLUENCE IN ACCIDENTAL EVENTS CAUSED BY THIRD PARTY ACTIVITY. ... 122
FIGURE 47.MEAN SQUARE ERROR AS A FUNCTION OF THE LEARNING STEP DURING THE ANN TRAINING ON THE SET OF 256 PATTERNS (128 ACCIDENTS,128 NO ACCIDENTS). ... 124
FIGURE 48.ILLUSTRATION OF A SIMPLIFIED SCHEME OF DATA MODEL ARCHITECTURE, FROM TIP TO ALOHA, UNTIL GIS VISUALIZATION. ... 134
FIGURE 49.THE CASE STUDY AREA –A4HIGHWAY NEAR PADUA,NORD-EAST OF ITALY: A TRUCK TRACING, IN A SPECIFIC LPG TRANSPORT PLANNING DAY... 138
FIGURE 50.METHODOLOGY CONSTRUCTION, AS A FLOW OF INFORMATION REPRESENTATION, IN ORDER TO OBTAIN ACCIDENT CONSEQUENCE EVALUATION... 138
FIGURE 51.ALOHATOXIC THREAT ZONE PLOT FOR THIS SCENARIO... 142
FIGURE 52.ALOHASOURCE STRENGTH GRAPH FOR PROPANE ACCIDENT SCENARIO... 143
FIGURE 53.ALOHACONCENTRATION AT POINT. ... 143
FIGURE 54.ALOHAFLAMMABLE THREAT ZONE PLOT FOR THIS SCENARIO... 144
FIGURE 55.ALOHABLAST THREAT ZONE PLOT FOR THIS SCENARIO. ... 145
FIGURE 56.ALOHATOXIC VAPOUR CLOUD APPLIED TO THE RELEASE POINT IN ARINO DI DOLO EST PETROL STATION, CHARACTERIZED BY LONGITUDE AND LATITUDE -ARCGIS REPRESENTATION. .. 146
FIGURE 57.ALOHAOVERPRESSURE (BLAST FORCE) FROM VAPOUR CLOUD EXPLOSION –ARCGIS REPRESENTATION AND NUMBER OF PEOPLE POTENTIALLY EXPOSED. ... 147
FIGURE 58.TRANSPORTATION NETWORK USED IN THIS WORK (ADAPTED FROM BELL 2006)... 162
FIGURE 60.RESULTS OBTAINED FOR A VARYING NUMBER OF DG VEHICLES. ... 166 FIGURE 61.THE CONSIDERED SYSTEM. ... 171
Index of Tables
TABLE.1.RISK ACCEPTABILITY CRITERIA.P IS THE CUMULATIVE FREQUENCY IN ONE YEAR, AND N IS THE
NUMBER OF DEATHS.ANALYSIS PERFORMED BY DUTCH STUDIES.(HOJ AND KROGER,2002). ... 43
TABLE 2.THE FOUR DECISIONAL LEVELS... 49
TABLE 3.THE CLASSES OF DANGEROUS GOODS ACCORDING TO ADR2009.(ADR,2009-COPIRIGHT® UNITED NATIONS.ALL RIGHT RESERVED)... 57
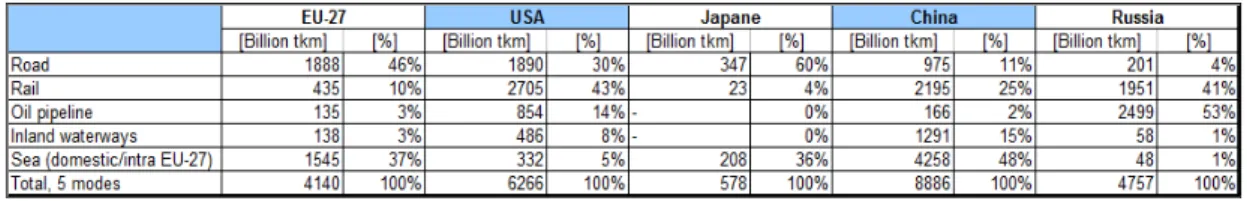
TABLE 4.COMPARATIVE GOODS TRANSPORT PERFORMANCE.THE DATA, CONCERNING DIFFERENT GEOGRAPHICAL ENTITIES, ARE QUALITATIVELY COMPARABLE –(“PANORAMA OF TRANSPORT”, 2009)... 64
TABLE 5.FACTORS INTERRELATED TO THE INTRINSIC CHARACTERISTICS OF THE ROAD. ... 108
TABLE 6.FACTORS INTERRELATED TO THE WEATHER CONDITIONS. ... 108
TABLE 7.FACTORS INTERRELATED TO THE CHARACTERISTICS OF TRAFFIC ON THE A7 MOTORWAY... 108
TABLE 8.RELEVANT CAUSES LEADING TO AN ACCIDENT OR FAILURE AND THEIR PERCENTAGE. ... 119
TABLE 9.MAIN FACTORS LEADING TO A CAUSE OF ACCIDENT. ... 120
TABLE 10.MAIN FACTORS LEADING TO FAILURE DUE TO CORROSION, A MECHANICAL CAUSE, AND THIRD PARTIES CAUSES. ... 120
TABLE 11.SIGNIFICANT (GREATER THAN 0.85) PREDICTIONS OF THIRD PARTIES ACCIDENT OCCURRENCE BY THE ANN. ... 124
TABELLA 12.THE MONITORING PARAMETERS USING TIP. ... 135
TABLE 13.DATA SUMMARY REQUIRED BY ALOHA FOR THE CASE STUDY... 140
TABLE 14.COMPARISON BETWEEN THE THREE DIFFERENT THREAT ZONE EFFECT AT THE SAME AND DIFFERENT DISTANCE FROM THE POINT SOURCE OF RELEASE. ... 149
TABLE 15.COMPARISON BETWEEN THE THREE DIFFERENT THREAT ZONE EFFECT AT THE POPULATION EXPOSED IN TERM OF POPULATION DENSITY [AB/KM^2]... 149
TABLE 16.EXPOSURES (FOR SQUARE UNIT) ON EACH OF THE 12 LINKS AT EACH OF 8 INSTANTS.IN BOLD, THE MAXIMUM VALUES FOR EACH LINK. ... 163
TABLE 17.WORST AND AVERAGE EXPOSURES FOR EACH LINK USED TO COMPARE THE PROPOSED MODEL WITH THE BELL’S APPROACH (2006). ... 163
TABLE 18.PATH PROBABILITIES OBTAINED ACCORDING TO THE BELL’S APPROACH (2006), COMPUTED ON THE LINK COSTS OF TABLE 17... 164
TABLE 19.PATH PROBABILITIES OBTAINED ACCORDING TO THE BELL’S APPROACH (2006) ON WORST LINK EXPOSURES, SPREAD IN TIME. ... 164
TABLE 20.PATH PROBABILITIES OBTAINED ACCORDING TO THE BELL’S APPROACH (2006) ON AVERAGE LINK EXPOSURES, SPREAD IN TIME... 164
TABLE 21.RESULTS OF THE OPTIMIZATION PROBLEM:Ut,Zt,It. ... 177
Abbreviations
ADN: European Agreement concerning the International Carriage of Dangerous Goods by Inland Waterways;
ADR: the European Agreement concerning the international carriage of Dangerous goods by Road;
ALARP: As Low As Reasonably Practicable;
ALOHA: Areal Locations of Hazardous Atmospheres; ANN: Artificial Neural Network;
BARPI: Bureau d’Analyse des Risques et Pollutions Industrielles; BLEVE: Boiling Liquid Expanding Vapour Explosion;
CAMEO: Computer-Aided Management of Emergency Operations; CFR: Code of Federal Regulations;
CYPRESS: Le centre d’information du public pour la prévention des risques majeurs et la protection de l’environnement;
CONCAWE: CONservatio of Clear Air and Water in Europe; COTIF: Convention concerning International Carriage by Rail; CSA: Canadian Standards Association;
Da.Go.T: Dangerous Goods Transportation (Project); DG: Dangerous Goods;
DGT: Dangerous Goods Transportation;
DIST: Department of Communication, Computer, and System Sciences; DM: Decision Maker;
DRIRE: Directions Régionales de l'Industrie, de la Recherche et de l'Environnement; DSS: Decision Support Systems;
EEC: European Economic Community; EEA: European Environmental Agency; EFTA: European Free Trade Association; ERA: Environmental Risk Assessment; EU: European Union;
FD: full drop;
FERC: Federal Energy Regulatory Commission;
GHS: Globally Harmonized System of Classification and Labelling of Chemicals; GIR: Interdivisional Group of Radiochemitry and Radiation Chemistry applied to environment, health and industry, Italian Society of Chemistry;
GIS: Geographical Information System;
GMES: Global Monitoring for Environment and Security; GPS: Global Positioning System;
HAZMAT: Hazardous Materials;
HSELINE: Health and Safety Executive (HSE) Library and Information Services; HMTA: The Hazardous Materials Transportation Act;
HMTUSA: Hazardous Materials Transportation Uniform Safety Act; HSE: Health, Security and Environment;
IAEA: International Atomic Energy Agency; IATA: the International Air Transport Association; ICAO: the International Civil Aviation Organization; IChemE: Institution of Chemical Engineers;
ICT: Information and Communication Technologies; IMDG: the International Maritime Dangerous Goods Code; IMO: the International Maritime Organization;
INERIS: Institut National de l'EnviRonnement industriel et des rISques; IR: Individual Risk;
JSA: Job Safety Analysis UIF: Italian-France University in Turin. LOC: Level of Concern;
LOPA: layer of protection analysis; LPG: Liquefied Petroleum Gas;
NATO-OTAN: North Atlantic Treaty Organization; MAL: Maximum Acceptable Level;
MEEDDM: Ministère de l'Ecologie, de l'Energie, du Développement durable et de la Mer;
MHIDAS: Major Hazardous Incident Data Service; MIT: Italian Ministry of Transport;
MMS: Minerals Management Service;
MTBE: Methyl tert-butyl ether, also known as methyl tertiary butyl ether; NEB: National Energy Board;
NOAA: National Oceanic and Atmospheric Administration Office of Response and Restoration;
OD: Origin – Destination pair;
ONU: The United Nations Organization; OEM: Office of Emergency Management; PACA: Provence-Alpes-Côte d'Azur; PET: Polyethylene Terephthalate;
PHMSA: Pipeline and Hazardous Materials Safety Administration; PLL: Potential Loss of Life;
PNA: Peptide Nucleic Acid;
PRA: Probabilistic Risk Assessment; PVC: Polyvinyl Chloride;
QARA: Quantitative Area Risk Assessment; QRA: Quantitative Risk Assessment;
RADM: Risk Assessment Decision Matrix;
ReLaMP: “Regione Liguria Merci Pericolose” – Dangerous Goods in Liguria Region;
REX: Retour d’EXpériences;
RID: Regulation concerning the International transport by railway of Dangerous goods;
SDIS 13 : Service departimental d’incendie et de secours des bouches du Rhone ; SIMAGE: “Sistema Integrato per Monitorraggio del Rischio e delle Emergenze”: Integrated System for Monitoring Risks and Emergencies;
SR: Societal Risk;
TIP: Transport Integration Platform;
TMDNIS: Transport of Dangerous Materials through Nice, Imperia Savona; UNECE: The United Nations Economic Commission for Europe;
UN Recommendation: United Nations Reccomendation; UVCE: Unconfined Vapor Cloud Explosion.
Foreword
Every day, dangerous goods (DG) are transported in different modalities from one or more origins to their destinations, all over the word, where people needs DG to live, to work, but also to find out new frontiers. Every country needs DG for everyday civil life activities: for example to use energy, to transport goods and passengers, or simply to conduct a healthy and safe life.
For these main reasons, the contemporary generation is addicted to DG, and for this reason we have the duty to monitor and to control their overall supply chain from producer to consumer – including their transportation - using innovative information and communications systems - such as Global Positioning Systems, Geographic Information Systems, Decision Support Systems.
The awareness of DG production, loading, unloading, storage, and transport, gives us the challenge to use DG, firstly, in a sustainable way, (optimizing, preventing cost and time delays, avoiding waste), secondly, in a safe and sustainable way in order to reduce the human exposition to the possible harmful effects of such DG (reducing emissions and spills), and also to quantify the potential damage or consequences links to its use, not only for us, but also for the future generations (avoiding accidents, injuries, and deaths).
These are some reasons for which I decided to face this world, the world of DGT, unknown for me before 2001, year of my first research to get my degree in Environmental Engineering with a topic dealing with “Definition of a methodology for real-time evaluation of risk from the transport of dangerous goods by road. Application to a case study in the transport of hydrocarbons in Liguria.”
After almost ten years, I have understood that the DG transport system has an extremely complex architecture and a stratified framework. DG transport is a complex system due to the aspect of "mobility and dynamicity" of its hazard, but also because of external and boundary conditions, and also for the mode of transport, (such as the nature of the materials transported, the state vehicle, weather condition, condition of transport infrastructure, proximity to urban centres, traffic density etc.). In addition, public
through European Union territory. In addiction, it is a complex subject to study in all its dimensions (scientific, technical, economical, sociological, environmental, etc.).
This system has different levels of research and investigation, and - at a strategic level - I should not leave out even a single part, otherwise I can not reconstruct the whole system. Otherwise, it is unrealistic to describe mathematically, or analytically the whole system with the hope to have only one and realistic and finite solution for such a complex problem.
A DGT, and the related risk, might be characterized by several aspects:
− The DG type and the related chemical-physical characteristics related to the hazard in its transportation;
− The transportation modality;
− The infrastructure used in the transportation;
− The human factors linked to the transportation (drivers, users, decision makers, public and private authorities and their policies);
− The territorial and geographical elements exposed to the transport considered; − The meteorological, atmospheric, and environmental conditions monitored during the transportation.
In my PhD work, two transportation modalities, pipeline and road, have been taken into account, since they represent the most common modalities of transportation in Europe of DG, as well as in France and Italy.
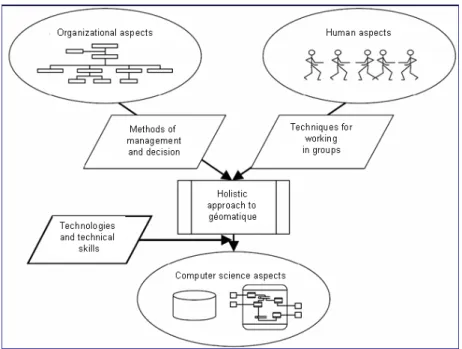
The different methodologies that have been used throughout my PhD work are strongly oriented to an engineering vision of the hazard and of the related risk, where a numerical quantitative evaluation is required. To support this view, I have deepened and used methodologies and technologies oriented to Geographic Information Systems, Innovative Statistic Approaches, Mathematical Programming, Optimal Control and, in part, Game Theory.
Specifically, in first place, I have defined an on-line / off-line GIS for the quantitative definition of the vulnerability of a pipeline to third parties activities, corrosion and mechanical failures. The proposed methodology, which also includes
innovative statistical approaches based on artificial neural networks, has been applied to an important oil pipeline in the South of Italy.
Secondly, I have integrated the real-time information coming by the Eni tracking/tracing system used to monitor the transportation of petrol products on the roads of the European territory (currently about 400 vehicles) with a common tool (ALOHA) used to evaluate the hazard and the exposure according to different accident scenarios. This approach has been tested with some case studies in the North of Italy, where a LPG explosion and release scenarios where supposed on a highway.
In addition, I have also formulated two original methodologies - might be more theoretical than the previous ones - with some direct practical application. The first methodology, which originates from a work by Prof. Bell, Imperial College, London, aims to verify how a risk adverse behaviour in DG transport on road can contribute to a practical reduction of risk if a mixed strategy – that is spreading travels both in time and in space – is applied. This methodology is based both on a game theory vision of the problem and on a practical mathematical programming modelling approach. The second methodology is based on the computation of optimal control laws in the DG transport on road to define the DG optimal flow which must access throughout a critical infrastructure, such as a tunnel.
In my opinion, it is also important to underline that I have had the chance to relate my PhD work to an International context, as well as to access to the most recent “know-how” on DG transport. Specifically, my work on the vulnerability of pipelines is strictly connected to a National project, funded by University of Genova and by ISPESL, and it has also been performed in close collaboration with Eni. My work on DG transport risk on road has been developed in close connection with the VIFP EU project Da.Go.T, as well as with two ALCOTRA-Interreg projects between Italy and France.
In fact, my overall PhD work strongly reflects the effects of the co-tutoring between University of Genoa and Mines Paris-Tech. A part from the Interreg projects, I have had the chance to deepen and to compare the Italian and French regulations and organisations to face DG transport risk. During my stay at the Mines Paris-Tech, for example, I met
such as Albemarle, Arcelor, Arkema, Charabot, Mane Fils, Primagaz, SB Formulation, Shell, SNPE, Total; association stakeholders (CYPRES) and finally institutional stakeholders (BARPI, DRIRE of Midi-Pyrenees and PACA, INERIS, PACA Prefecture, SDIS 13).
I focused my attention on "industrial safety" and I spent an intensive period of three weeks where I met decision makers in the field of risk prevention and of crisis management during visits to industrial sites and conferences.
From a methodological viewpoint, my work strongly reflects some research studies I have followed in my hosting in the French institution, specifically as regards how DG risk is faced in several French companies as well as on some software tools, such as ALOHA, that are currently used in France, for example at INERIS. Indeed, as Mines Paris-Tech student, I went to INERIS for one day course on Industrial Risk Prevention.
In this occasion I was introduced on research, development and expertise of this institute. They described what kind of methods of risk analysis for complex industrial systems used, in order to give me practical know-how in the accidental risk topic. Finally, the overall research has been inserted and cofounded by the UIF - Italian and France University in Turin, (http://www.universite-franco-italienne.org/) that supported me for mobility in the joint supervision of my PhD thesis.
The main results of my PhD work have been discussed at International level in several contexts. Among others, in 2009, I discussed my PhD work on the risk adverse methodology at Imperial College, where Prof. Michael G.H. Bell leaded a specific NATO workshop on DGT. Other results have been also discussed in a similar NATO workshop co-organised by University of Genova and by Mines ParisTech in Genova in 2007. In these workshops, I have had the chance to discuss my work with the most outstanding scientists in the field such as:
Professor Rajan BATTA
Associate Dean for Graduate Studies, School of Engineering and Applied Sciences Professor of Industrial and Systems Engineering
412G Bonner Hall - University at Buffalo (State University of New York) - Buffalo, NY 4260, USA.
Professor Michael.G.H. BELL, Centre for Transport Studies
Imperial College London - Exhibition Road, London, SW7 2AZ, UK.
Associated Professor Bahar YETİŞ KARA Department of Industrial Engineering Bilkent University, 06800 Ankara-Turkey.
Professor Vedat VERTER,
Desautels Faculty of Management,
McGill University, 1001 Sherbrooke Street West, Montreal, Canada H3A 1G5.
During these four years of my PhD work I concretely handled a complex subject in all its dimensions (scientifically, technically, economically, sociologically and environmentally) and I managed a complex problem in a context of uncertainty. I worked in teams with people of various cultures and different occupations, in an international atmosphere of proficiency, skills and expertise.
1 Introduction
This thesis is based on the need to describe the DGT system to find solutions or answers in order to minimize the risks arising from transportation or maximize the level of security in freight transport. DG logistics is a complex system of which the DGT system is a specific subsystem which can be in turn be modelled in several other subsystems. In the thesis work, I have developed approaches and found optimal solutions of models - applied to some of these DGT subsystems - with assumptions, methodologies and targets ad hoc for each analyzed case study.
The DGT risk is related to the risk derived from human settlements – technologies, biological activities, socio-political behaviours – where an action and its consequence, or the binomial cause-effect, is strictly links to human factor, and all risk derived from human activities are called technological risk, (Rinatech, 2010).
When a dangerous event happens, caused by human error, and involving DG, the consequences cannot sometimes be reduced or contained. So, it is essential to apply preventive measure to reduce the probability of occurrence, or/and magnitude of the consequences.
To achieve this goal, it is possible to implement monitoring and control systems, using new and state-of-the-art Information Communication Technologies (ICT), sensors and failure (or leak) detection systems, alarms, but also using models and methods to develop possible scenarios or simulation.
Using simulations, it is possible to have more information about the DGT system behaviours in different situation, considering many decision makers, on the bases of different what-if hypothesis and taking into account different approaches.
In case of emergency management, or for planning activities, such as operative training, models and simulations could be useful for technicians, drivers, controllers, fireman, emergency operators and others DGT subjects.
could be followed to evaluate risk. I focused my attention on risk linked, not only to vehicles transporting DG incidents (or accidents), but also to infrastructures used for transporting DG, and the surrounding territory. This kind of risk is defined as an accidental risk, and the consequences associated to a DGT hazardous event can be, for example, explosions, thermal accidents, fires in urban areas, toxic releases and plums, air, or water or soil pollution, and acid rains.
All the models that I have described and defined are based on the classical definition of technological risk – related to human activities – categorized as accidental risk, where the risk is related to the failure – or accident – of a DGT vehicle or pipeline.
This risk definition is the same for the pipeline and road, but I can use different methodological approaches to evaluate the risk.
Figure 1. Thesis architecture: starting from DGT risk definition until mathematical formalization in case study solving.
1.1 Risk
assessment
Generally speaking and as I mentioned in the foreword, the DGT system has a complex architecture, and there is not one way to evaluate risk. For the sake of simplicity I want to report what are the most common methods used in risk assessment.
Actually, the chemical industry makes use of eleven different procedures for hazard assessment, (Muhlbauer, 1996):
− checklists; − safety review; − relative ranking
− preliminary hazard analysis; − “what if” analysis;
− hazard and operability studies (HAZOP);
− failure modes, effects, and criticality analysis (FMEA); − fault tree analysis;
− event tree analysis;
− cause-consequence analysis; − human-error analysis.
Examples of Qualitative Risk Assessment are: − Job Safety Analysis (JSA)
− Logic diagrams − What-if/Checklist
− Failure Modes and Effects Analysis (FMEA) − Hazard and Operability Study (HAZOP).
Each process has a cost, effectiveness and a degree of appropriateness for the system analyzed. With regard to the formal techniques used by industry and companies that transport DG, the methods mainly used are:
− hazard and operability studies (HAZOP); − quantitative risk assessment (QRA); − probabilistic risk assessment (PRA).
HAZOP - which is the acronym for HAZard OPerability studies - is a technique that must be performed by a group of experts, who know in detail the system that they intend to analyze. This is a very expensive process, both in terms of hours worked and number of skills involved. This technique requires a deep knowledge of the plant because the experts have to examine any possible failure or rupture, using a variety of keywords
(Figure 2 part A) (Figure 2 part B)
Figure 2. - Part A: HAZOP structured technique description, following a systematic study of a process, using guide words to discover how deviations from the design intent can occur in equipment, actions, or materials, and whether the consequences of these deviations can result in a hazard. - Part (B): A block diagram of the HAZOP process.
QRA is the acronym for Quantitative Risk Assessment and it is a strictly mathematical technique that numerically determines the absolute frequency of "accidents". This technique is used not only in the petro-chemical, but also in the nuclear and aerospace industries.
With this technique it is possible to quantify the risks on their own and the social risk related to a process, activity or system analysis, management plans for internal and external security for an industrial system concerned, (Muhlbauer, 1996).
− Fault Tree Analysis (FTA) − Probit statistical analysis − In-process energy modeling − Event probabilities
− Risk/cost trade-off.
PRA stands for Probabilistic Risk Assessment and is a technique obtained by linking the probability of individual events, such as failures or disruption of plant components and poorly functioning security system. The probabilistic risk assessment (or analysis / probabilistic assessment of safety) is indeed a complex and systematic methodology for assessing the risk associated with complex technological devices (such as aircraft or power plants), (Kumamoto and Henley, 1996).
The PRA is a well established technology, where PRA analysts aim to estimate parameters used to determine the frequencies and probabilities of different events modelled. The cause of an event is an accident. In a PRA model, the parameters are estimated - on the bases of data used to evaluate each of the parameters - and the uncertainties in estimation can be quantified using methods and sources of information that delineate the response of systems and operators to accident initiating events. In this context, performance and plant reliability are enhanced by monitoring equipment performance and evaluation of equipment trends. (Atwood et al., 2003)
The probabilistic risk assessment usually answers three questions, (Muhlbauer, 1996):
− What can go wrong? What are the initial events that lead to adverse consequences?
− How likely is it? What are the likely consequences of this unwanted, or what is their frequency?
− What are the adverse consequences and how serious are the potential damage?
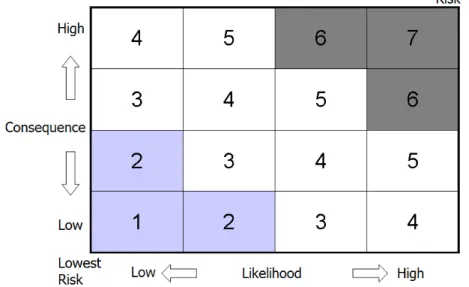
The probability of failure or the probability of having an event - in terms of importance – is associated to the consequences of that event, and this relationship is plotted and qualitatively in the matrix of probability of hazard-effects shown in Figure 3.
Figure 3. Likelihood-consequence risk matrix - (Muhlbauer, 1996).
ERA, an Environmental Risk Assessment is a process leading to problems that are caused by pollutants in the environment, and it is evaluate predicting whether there may be a risk of dangerous effects on the environment caused by a chemical substance, (EEA, 1998). “Environmental Risk Assessment (ERA) is the examination of risks resulting from technology that threaten ecosystems, animals and people. It includes human health risk assessments, ecological or eco-toxicological risk assessments, and specific industrial applications of risk assessment that examine end-points in people, biota or ecosystems”, (EEA, 1998).
There is an environmental risk only if there is an exposition to a hazard, and one - or more than one -outcomes associated to the exposition. First of all, to evaluate the risk a hazard identification is requested. Secondly, a dose-response assessment has to be evaluated: what is the link between exposure and severity, how many factors might influence this relationship, and what is the relationship between animal responses, human responses, high-dose and low-dose responses. Thirdly, the intensity, frequency and duration of an individual exposition is described characterizing an exposure assessment. Finally, a risk characterization is needed.
Identify, evaluate, and assess risk leading to environment is a complex task, because of its complexity in system architecture, levels of decision, and subjects – public or private - involved. Indeed, ERA depends, at least, on four sub-systems:
− Ecological risk assessment; − Health risk assessment;
− Industrial risk assessment leading to facilities at strategic and planning level; − Industrial risk assessment leading to supply chain and system utilities, such as transportation, at strategic, planning, operational or real time level.
Moreover, the economical efforts and the great amount of indirect costs associated to a risk evaluation have to be taken into account to better understand another level of complexity of this system.
Each sub-system can be characterized by many other smaller systems, in which others decision and subjects are involved. So, to conduct an ERA the socio-political, economical, territorial, industrial, and heath systems have to share decisions and objectives having a common target: reduce the occurrence and severity of consequences in risk estimation on the environment. This is a management goal, in which communication and information must be shared to reach the goal. So, communication protocol and standards, tools, software or methods adopted have to be defined and the knowledge have to be shared in order to respect low and regulation in ER prevention, and protection. Also data acquisition, elaboration, and visualization should be in common at each level, and a continuous control and monitoring might be performed to update the levels of risk in each sub-system and also in the ERA system.
Only one subject has not the economic power, the skills, and the ability to develop an ERA, this kind of assessment must be manage by an ad hoc Authority, with an extraordinary political, decisional and economical power, that can coordinate all the other subject involved in the system analysed, considering also al the phases of a risk assessment, before the initial accidental event, during the accident and after.
Figure 4. Typology of Risk Assessment - (EEA, 1998).
Figure 5. GMES Fast Track Emergency Response Core Service Strategic Implementation Plan* - Final Version, 24/04/2007 Author: Professor Bernardo De Bernardinis.
In the risk assessment definition, many are the concepts involved:
Hazard is defined as "the potential to cause harm", (Royal Society, 1992). Hazard is related to the intrinsic characteristic of a material, good, condition, or activity that has the potential to cause harm to people, property, or the environment, and it is often defined in terms of a probability, (EEA, 1998). For Gilles Dusserre (Analyse des risques TMD, 2010), hazard is the probability of an event that may affect the system studied.
Elements exposed are resources (goods, people) and the environment that may suffer damage, (Dusserre, 2003).
Sensitivity is the propensity to recover or resist damage assessment, (Dusserre, 2003).
Vulnerability is the measurement of the consequences of the event (hazard with a certain intensity) on the exposed elements involved. It can be defined as the sensitivity of the element exposed studied taking into account the ability of emergency response, (Dusserre, 2003).
Danger is define as all processes involved in the chain or sequence of events leading to an undesirable event which could have a destructive nature on population, ecosystems and goods, (Dusserre, 2003).
Severity is defined as the effect of an undesirable event on the targets point, or on the elements exposed. Can be defined as a function of the elements exposed and the vulnerability of those elements, (Dusserre, 2003).
Probability is defined as a value between 0 and 1 and in some words is the likelihood of a sequence of events to an event not desired, (Gilles Dusserre, 2003).
Industrial risk is defined as a function (usually the product) of the probability of occurrence and the phenomenon (occurrence) and severity of consequences, (Gilles
In the context of natural hazards, the definition by UNESCO (1972) is generally adopted, which allows computing the risk on a set of territorial elements that may be damaged by a natural hazard, as a function (specifically, a product) of the likelihood of the hazard, of the value of elements at risk, and the so called vulnerability, that is the capacity of an element to resist to a hazard event.
Risk is most commonly defined as "The combination of the probability, or frequency, of occurrence of a defined hazard and the magnitude of the consequences of the occurrence" (Royal Society, 1992).
“Risk is used in everyday language to mean "chance of disaster", but hazard and risk are not the same. Risk is a function of hazard. […] The distinction between hazard and risk can be made clearer by the use of a simple example. A large number of chemicals have hazardous properties. Acids may be corrosive or irritant to human beings for example. The same acid is only a risk to human health if humans are exposed to it. The degree of harm caused by the exposure will depend on the specific exposure scenario. If a human only comes into contact with the acid after it has been heavily diluted, the risk of harm will be minimal but the hazardous property of the chemical will remain unchanged”, (EEA, 1998).
In the risk evaluation it is essential to say that the zero risk does not exist. In the process of DGT there is always a level of acceptability, even if the perception of hazard, danger, and also of risk is not so easy to quantify.
“The risk assessment may include an evaluation of what the risks mean in practice to those affected. This will depend heavily on how the risk is perceived. Risk perception involves people's beliefs, attitudes, judgements and feelings, as well as the wider social or cultural values that people adopt towards hazards and their benefits. The way in which people perceive risk is vital in the process of assessing and managing risk. Risk perception will be a major determinant in whether a risk is deemed to be "acceptable" and whether the risk management measures imposed are seen to resolve the problem”, (EEA, 1998).
The notion of acceptability is most important in the risk study, but it is difficult to define because of its subjectivity depending on different dynamic factors. The evaluation of acceptability is not the same in each United Europe Country. The Netherlands used a probabilistic approach in risk definition, at a planning level, and the acceptability is determined as follow in Figure.6:
Figure 6. Risk management policy and criteria of acceptability in The Netherlands. (Ale, B.J.M., 1991).
To quantify the risk in term of cost-benefits trade off, the values of risk are determined by a political choice, derived from the art. 5, of the Seveso Directive 82/501/EEC, approved by Parliament (1990). Risk criteria have only been defined for people, and three regions of acceptability are considered:
− MAL (Maximum Acceptable Level) – should not be exceeded, irrespective of the economic or societal benefit that could result from the activity under consideration.
− NL(Negligible Level) – it is not sensible to try to further reduce the risk, in view of the fact that man and the environment are already subject to other risks resulting from nature or society.
− IN THE MIDDLE – risk needs to be reduced according to the ALARP concept.
Figure 7. The ALARP region is defined in: Vrijling et al., 1995; Vrijling et al., 2004; and Hoj et
al., 2002.
Risks are “acceptable only if reasonable practical measures have been taken to reduce risks” (IAEA 1992).
The level of acceptability is quantified considering an Individual Risk (IR) to people, a Societal Risk (SR) to people, and a Potential Loss of Life (PLL).
INDIVIDUAL RISK (IR) is defined as the probability that an unprotected person, who permanently is located at a specific position in the vicinity of a risk source, is affected by the undesired consequences of an event, and he/she will be killed. IR is expressed as a period of year. It can be pictured on a map by connecting points of equal IR around a facility, the risk contours. (Ale, 2002).
Figure 8. Provisional risk criteria for people, considering (IR) and its acceptable limits. (Ale, 2002).
SOCIETAL RISK (SR) is defined as the relationship between the number of people killed in a single accident (N) and the chance (F) that this number will be exceeded. It is the probability that in an incident more than a certain number of people are killed. Societal risk usually is represented as a graph in which the probability or frequency F is given as a function of N, the number of people killed. This graph is called the FN curve.
Figure 9. Provisional risk criteria for people, considering (SR) and its acceptable limits. (Ale, 2002).
POTENTIAL LOSS OF LIFE (PLL) is the expectation value of the number of people killed per year. It is the sum of all individual risks and it is the area under the FN curve.
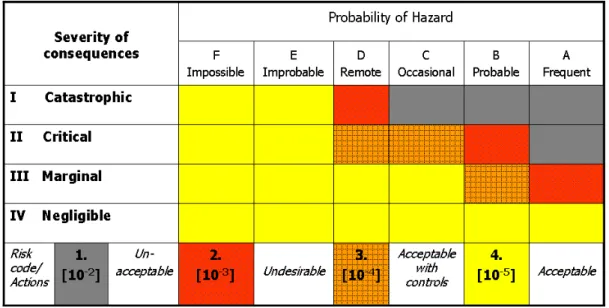
The probability of a hazard referring to people has to be compared to its severity of consequences, and both the Netherlands, and French Policy, adopt a Risk Assessment Decision Matrix approach to determine qualitatively a level of risk. RADM can be employed to measure and categorize the risk. This procedure is based on probability and consequences parameters.
This approach is well assessed in fixed plants, subjected to SEVESO Directives, and for the evaluation of major technological risk. But, there is a substantial difference between the Netherland approach and the French one: while the accidents with a low probability are not considered in the first approach (probabilistic risk approach), the second one considers and studies all the accident scenario happened (deterministic risk approach).
Figure 10. Risk Assessment Decision Matrix (RADM) - Official Journal of France Republic – Regulation 7 October 2005. (Reniers et al., 2005).
In Italy, four levels of risk are taken into account, (Fabiano et al., 2002). The risk is divided into "Acceptable", "Region of tolerability: type A", "Region of tolerability: type B" and "unacceptable." The criteria for assessing the degree of risk are not standardized at the European level.
To compare the RADM criterion with the Italian one, Italian analysts processed ISTAT data for 20 years of accidents, showing that the rate of IR is between 10^-3 and 10^-4, precisely, the IR for DGT accidents is about 5 x 10 ^ -4; while the SR is modeled with an approach that uses the frequency curve of deaths, (F/N curves), related to transport, as established by the Netherlands standards, and adopted by Italian case study (Fabiano et al., 2002).
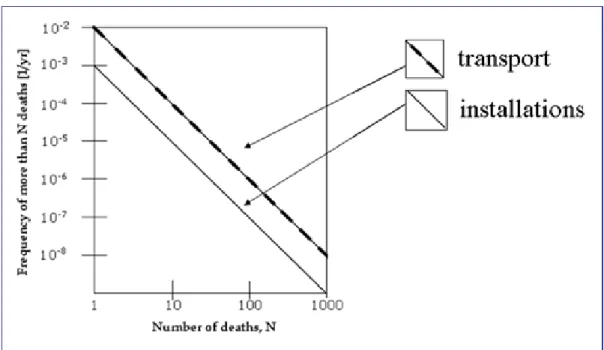
For SR, the limits are set as a guidelines: They are also set as a limit per kilometer of the route, F=[1x10⁻²/yr]. In addiction, advisory limit is given for fixed installation and transport, and it should be noted that in spatial planning the limit for transport will only be observed within 200 m from the route.
Figure 11. Advisory limits referring to societal risk, where transport SR and installation SR are compared. (Ale and Piers, 2000); (Ale, 2002).
“Risk management is the decision-making process through which choices can be made between a range of options which achieve the "required outcome". The "required outcome" may be specified by legislation by way of environmental standards, may be determined by a formalised risk-cost-benefit analysis or may be determined by another process for instance "industry norms" or "good practice". It should result in risks being reduced to an "acceptable" level within the constraints of the available resources”, (EEA, 1998).
accident evaluation, but I hope that in a near future it might be adopted in French using a deterministic approach, collecting all the accident scenario happened in DGT.
Risk Evaluation Criteria Description Acceptable risk
(
)
2 5/
10 N
P< − Verify that risk remains at this level, no need for detailed study.
Region of tolerability: type A
(
10−5/N2)
<P<(
10−4/N)
Tolerable risk. If cost of reduction would exceed the improvements achieved. Region of tolerability:type B
(
10−4/N2)
<P<(
10−3/N2)
Tolerable only if risk reduction is impracticable orthe cost is disproportionate in relation to th improvements obtained.
Unacceptable risk
(
10 3/N2)
P> − Risk intolerable: risk cannot be justified even in extraordinary circumstances.
Table. 1. Risk acceptability criteria. P is the cumulative frequency in one year, and N is the number of deaths. Analysis performed by Dutch studies. (Hoj and Kroger, 2002).
Also in Italy many DGT Companies are implementing tools and technologies able to detect accidents or abnormalities during the routing, for reasons of safety and security, and those observed data represent a set of accident really happened, that could helps analyst to define classes of probability of hazard, and new IR, and SR limits.
The risk definition is also a hard task because of not only the socio-political context, but also the economic and utilities and services - leading to the dangerous activity - can influence the risk estimation.
In this context, especially in France, the so called “retour d’expériences”, or “REX”, is a sort of feedback after an accident scenario really happened, it is an “experience feedback”. Lessons learned from past experiences or dangerous events, especially the most serious ones, are highly instructive to prevent recurrence of accidents and increase the level of safety related to the systems analysed, (Van Wassenhove and Garbolino, 2008).
Indeed, negative REX focuses on accidents, failures, technical problems, and errors, which have consequences on the system considered, and it is an essential tool in the risk management. On the other hand, positive REX focuses on good practices and techniques implemented. In our study, REX is a methodology for understanding safety dimension after a dangerous event, to prevent future accidents, and helps people to be ready and arranged for the effects of a similar event. It is also an approach to both individual and collective level, where each operator (or generally, a subject) is invited to share his experiences and to benefit from the other actors, (Van Wassenhove and Garbolino, 2008).
“One of the major difficulties concerning the use of risk assessment is the availability of data and the data that is available is often loaded with uncertainty”, (EEA, 1998).
To this end, there are many databases that collect all accident and incident occurred in the past; some of them are public and their access is direct, others are private and have an authorized or restricted access:
− ARIA, (http://www.aria.developpement-durable.gouv.fr/barpi_3252.jsp); − HSELINE, (http://www.datec.lavoisier.fr/fr/not_bdd.asp?bdd_id=628); − ICHEME, (http://www.prosim.net/fr/resources/liens.html);
− MHIDAS, (Major Hazardous Incident Data Service:
http://www.highbeam.com/doc/1G1-10875699.html) ;
− TNO,
(http://www.tno.nl/content.cfm?context=markten&content=product&laag1=186&laag2=
151&item_id=443&Taal=2).
Studying an accident - a failure or generally a dangerous event - after its occurrence prepare technicians, and all the subject involved, for estimation of damages, for establishing an event chronology, for a realistic hypothesis of accident scenario evaluation, for identifying barriers, and defence in depth, but also for quantifying the organizational and human dimensions, and, finally, for defining recommendation.
The right management of DGT is a hard task and get complicated because of many subject, who have to take different decisions, with objectives that are partially orientated to risk reduction.
Surely, to manage DGT system:
− first of all, a good knowledge and skills in transportation types and dangerous goods identification is required;
− secondly, principal risk leading to DG and its transport are taken into account;
− thirdly, not only, the nature of risk and the principal dangers and consequences leading to DGT, but also the principal causes of accident are taken into account;
− fourthly, perusing and investigating accident reports need to better understand the dynamics of an event, to be more able to prevent, act and deal with future incidents or accidents;
− fifthly, preventive actions and disaster relief are to be taken into account in the management chain;
− sixthly, the emergency organization is a tricky task not only at a planning level, bat also at operational and real time levels;
− seventhly, prevention through training of stakeholders is an effective goal to risk prevention at a public and private level of liability;
− eighthly, informing people before, during and after an event using codified instructions is to be hoped;
− finally, a compensation could be foreseen, and provided for low, deriving from DGT accidents.
“Risk assessment is carried out to enable a risk management decision to be made. It has been argued that the scientific risk assessment process should be separated from the policy risk management process but it is now widely recognised that this is not possible. The two are intimately linked” (EEA, 1998).
Figure 12. The elements of risk assessment. (EEA, 1998).
1.2
Systems and Models to support decisions
To narrow the gap between scientific risk assessment and policy risk management process models designed and implemented to support stakeholders in the decisional process exist.
The DGT topic and especially the accident prevention and crisis management interest a huge panel of decision makers. We all recognize that some decisions are more important than others, whether in their immediate impact or long term significance.
The significance of a decision is a measure of understanding, and especially the knowledge about how much resources and time to spend on a decision is a crucial point. So, the decisional process could be divided in levels of decision, on the bases of time and space information and priority. To project an informative system able to manage the infrastructure of the transport of dangerous goods, (for example, as done in the TMDNIS project), it is useful to refer to a classification hierarchy of the decisional levels that may be associated with the management of that type of transport. This classification consists of four levels:
− The strategic level; − The tactical level; − The operative level;
− The level of control in real-time.
The four levels are ordered according to the time horizon (in decreasing order) considered and the level of detail of the model used (in increasing order, see Figure 13 and Table 2).
Figure 13. The four decisional levels.
In the strategic level decisions are taken on models on a national scale with a time horizon of a few years (generally 5-10 years); it mainly regards the dimension of the infrastructure of the transport as well as the definition of the types of dangerous goods that can be transported in the considered infrastructure. These decisions are made based on an estimate of the demand for transport (scenario) for the time horizon considered. This level of planning due to its nature requires a long time and enormous resources and
has the Public Administration as its main component, which could require the collaboration of external experts, also private, who could be involved in the creation and/or the running of the activity or service.
In the tactical level a time horizon of a few months or a maximum of one or two years is considered, decisions are made on a model with a level of detail corresponding to a multi-regional geographic area. The choices made at this level are substantially connected to the planning of the transport of the average period. At this level therefore how much and which dangerous goods can be transported in the considered territory in the chosen period of time is defined. These decisions are made based on accurate estimates of the demand for the transport of dangerous goods and based on the infrastructure network configured at the strategic decision level. At this level who makes the choice could also be private and, even under the control of the Public Administration, is assigned the management of the transport of dangerous goods.
The operative level considers a time horizon of a few days and the activities of this level are aimed at the scheduling of the transport in the present week/month. The decisional models are at a regional level or, at maximum, a multi-regional level; the definition of the transport can be based on specific algorithms of scheduling, strategies of the route of vehicles or specific heuristics defined for the problem under consideration, and must take into account the risk levels connected to the infrastructure in order to minimize the risk deriving from the transport of dangerous goods. This level can be managed directly by the local Administration, by the managers of road infrastructures and by single transport companies.
The level of control in real-time is aimed at the continuous monitoring of the transport resources through suitable hardware instrumentation installed in the vehicles and in the infrastructure; potential decisions in the control of this traffic are taken on a local scale and regard a time horizon of a few seconds, minutes or at most some hours. The strategies present at this decisional level are necessary to contrast any hitches in the transport network such as the temporary unavailability of infrastructure or excessive density of vehicles that transport dangerous goods in a certain stretch of the network. This phase is initially run by the transport companies able to interact with the vehicles in


![Figure 21. Dangerous goods transported by road [% tkm] - (“Panorama of Transport”, 2009) and (“Annual road freight transport of dangerous goods, by type of dangerous goods and broken down by activity”, 2010)](https://thumb-eu.123doks.com/thumbv2/123doknet/2736484.65128/68.892.279.835.130.456/dangerous-transported-panorama-transport-transport-dangerous-dangerous-activity.webp)

